 Fourplex
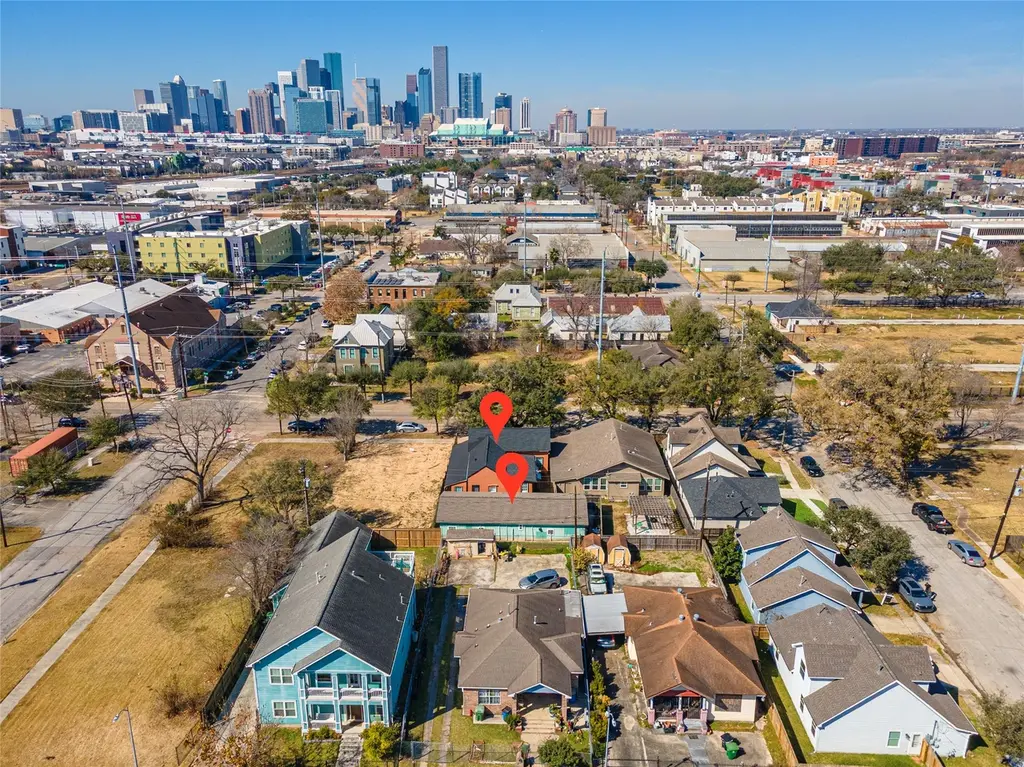
307 York St #4 · Houston, TX
Flood risk 4/10 · Minor
- FEMA flood zone
- X (unshaded)
- Chance of flooding over 30 yrs
- 0.2%
- Est. flood insurance / yr
- $507 – $1,088
Fire risk 1/10 · Minimal
- Est. fire insurance / yr
- $1,222 – $2,270
Heat risk 9/10 · Severe
- Hot days now (above 109°F)
- 7 days/yr
- Hot days in 30 yrs
- 25 days/yr
Wind risk 9/10 · Severe
- Chance of severe wind over 30 yrs
- 99.0%
Air-quality risk 2/10 · Minimal
- Unhealthy air days now
- 2 days/yr
- Unhealthy air days in 30 yrs
- 2 days/yr
Risk factors via First Street. Map © Google.
Why this score? — see what drove the B+ grade
The composite is a weighted blend of 9 inputs, each scored 0–100. Each bar is that input's sub-score; the figure is the points it added to the 100-point composite (weight × sub-score).
- Cash flow +30.0/30.0
- ARV discount +15.0/15.0
- DSCR +10.0/10.0
- 1% rule +8.7/10.0
- Condition / age +3.8/5.0
- Livability +3.7/5.0
- Schools +2.7/10.0
- Rent growth +2.1/5.0
- Appreciation +0.0/10.0
$475,000
🖨 Deal sheet 📄 Offer letter ✓ Due diligence
Multi-family units
County records classify this as Multi-Family (2-4 Unit). Listing-text estimate: 4 units. confirmed
Listing remarks MLS
Excellent investment opportunity! One-story 4-plex featuring a practical layout with two units in the front and two units in the back, offering flexibility for tenants and owner-occupants alike. Perfect opportunity to live in one unit and rent the other three to generate income. Each unit offers private entrances and functional living spaces. Located just minutes from Downtown Houston with easy access to major freeways, dining, and entertainment. Strong rental potential in a high-demand area makes this an ideal addition to any portfolio or a smart house-hack opportunity. A rare chance to secure a versatile multi-family property with income-producing potential in a rapidly growing location.
Key facts
- High demand area
- One story 4 plex
- Private entrances
Tags
Neighborhood map
What this means for you Summary
Snapshot
- This is a 4 × 2-bed/2.0-bath units multifamily listed at $475k. Condition is rated good.
Deal economics
- At list price, monthly cash flow is $2k ($23k/yr) — positive. Per door: $469/mo.
- The deal already cash-flows at list — no discount required.
- Meets the 1% rule at list price ($7k rent vs $475k).
- Recommended offer: $432k (9.0% below list) — sets the bar for market timing.
- Cap rate 11.0% vs local median 3.2% in Houston — top-decile yield for the area; either an underpriced asset or a hidden risk that comps aren't pricing in. Stress-test before assuming the spread holds.
Location & tenants
- Location reads 74/100 on livability (#184 in TX, #4,771 nationally) — a middle-class / working-renter tenant base. Strengths: amenities A+, cost of living A+, housing A+; Watch: schools D, crime F.
- Houston ISD (urban): math 27% / reading 35% proficiency, ranked #593 of 826 in TX (top 72%) — families likely to look elsewhere, expect single-tenant / working-renter base with shorter leases; 71% free/reduced lunch — lower-income household profile, screen leases tightly.
- Market conditions: Rents soft (-1.6%/yr); 206 active listings in the ZIP; solid renter incomes; 29,883 units permitted in Harris County in 2024 (8,621 in 5+ unit buildings).
- At $6,531/mo this rent would consume 93% of the median local household income ($84k/yr) (locally 572% of renters already pay >50% of income on rent) — very limited rent-growth headroom before tenants either downsize or default.
Forward outlook
- Local home prices are declining (-3.0%/yr); year-one equity from $3k of loan paydown is wiped out by about $14k of value loss. Plan a longer hold.
- Harris County population projected at +47% by 2050 — long-run rental-demand tailwind backs the buy-and-hold thesis.
- At projected returns (-3.0% appreciation + 0.0% rent growth), your $133k cash investment doubles in ~10 years — after that, you're playing with house money.
Negotiation context
- It's been on market 116 days — a 9% lower offer ($432k) is reasonable based on typical stale-listing flexibility.
Risks & watch-outs
- Watch-outs: built in 1938 — expect roof / HVAC / electrical / plumbing capex.
- Climate carrying-cost: severe wind risk, 99% chance of damaging wind over 30y; extreme-heat days projected 7→25/yr by 2055 (HVAC capex compounding) — expect insurance premiums to compound above CPI over the hold.
Questions for the listing agent
- It's been on market 116 days. Have you received any prior offers? Is the seller open to a 9% concession, seller financing, or rate buy-down credit?
- Can we see the unit-by-unit rent roll, current vacancy, and any below-market leases? What's the average tenancy length?
- What capital expenditures (roof, boiler, parking lot, exteriors) have been made in the last 5 years, and what's planned in the next 2?
- Built in 1938 — when were the roof, HVAC, electrical panel, plumbing, and water heater last replaced?
- Why hasn't it sold? Are there any deal-killer items the seller is aware of (foundation, flood, title, zoning, code violations)?
- Is there a deadline driving the sale (1031 exchange, divorce, estate, relocation)? That informs how much negotiation room exists.
- Schools are D-rated, which usually means shorter tenancies and higher turnover. Who's the typical renter profile here, and what's been the actual vacancy rate?
- Crime grade is F in this area — have there been break-ins, vandalism, or insurance claims at this property in the last 3 years? What carrier currently insures it and at what premium?
- What's the average days-on-market for RENTAL listings here right now (not sales)? A rising rental-DOM trend means longer vacancies and softer asking-rent achievability than the comps imply.
- What's the recent tenant-quality profile in this submarket — average credit score on applications, eviction rate, late-payment / NSF rate, and stable-employment percentage? A property-management company in the area should have these aggregated.
- How much new apartment / multifamily construction is in the pipeline within 1–3 miles? Heavy new supply (>2% of stock underway) typically softens rents 12–24 months out; light construction supports rent growth.
Investment metrics
- 1% rule
- 1.37% ✓
- Cap rate
- 11.03%
- Cash-on-cash
- 16.93%
- DSCR
- 1.75
- GRM
- 6.1
CMA / ARV
- ARV (median comp)
- $593,055
- List price
- $475,000
- Delta
- -19.91%
- Verdict
- UNDERPRICED
- Comps
- 10 within 1.0 mi
Projected returns pro-forma
-3.0% appreciation · 0.0% rent growth · sell at horizon
- IRR
- 4.7%
- Equity multiple
- 1.18×
- Total profit
- $23,527
- Equity at exit
- $70,824
- IRR
- 11.2%
- Equity multiple
- 1.76×
- Total profit
- $100,845
- Equity at exit
- $41,069
Cash invested: $133,000 (down + closing). Projections, not guarantees.
Landlord ↔ Tenant lean methodology
- Overall (STATE)
- 87 Strongly Landlord-Friendly
- State Texas
- 87 Strongly Landlord-Friendly · R+5
- County
- — inherits STATE
- City
- — inherits STATE
ZIP-level market 77003
- Home prices YoY
- -29.2%
- Rents YoY
- -1.6%
- Active inventory
- 206
- Price-to-rent
- 24.2×
Monthly cashflow live
- Estimated rent
- $6,531 high interval (Pro) →
- Mortgage (P&I)
- −$2,491
- Tax est. 1.5%
- −$594 /mo · $7,125/yr
- Insurance
- −$198
- HOA
- −$0
- Vacancy / Maint / Mgmt
- −$1,372
- Net cashflow
- $1,877
Break-even live
4-unit breakdown (identical units grouped — click to expand)
| Units | Beds | Baths | Est. rent |
|---|---|---|---|
| 4× units | 2 | 2 | $6,532 |
| #1 | 2 | 2 | $1,633 |
| #2 | 2 | 2 | $1,633 |
| #3 | 2 | 2 | $1,633 |
| #4 | 2 | 2 | $1,633 |
| Total (4 units) | $6,531 | ||
UW: 25.0% down · 7.5% · 30yr · 1.5% tax · 5.0% vac · 8.0% maint · 8.0% mgmt
Financing live
Cash to close
- Down payment
- $118,750
- Closing costs
- $14,250
- Reserves months
- —
- Total cash needed
- —
Loan-product check · same deal, 3 products live
Conventional
25% down · 7.5% · 30yr
- Down + closing
- —
- Monthly P&I
- —
- Monthly cashflow
- —
- DSCR
- —
- Eligible?
- —
Personal DTI + credit; lowest rate.
DSCR
20% down · 8.5% · 30yr
- Down + closing
- —
- Monthly P&I
- —
- Monthly cashflow
- —
- DSCR
- —
- Eligible?
- —
No personal income docs; deal must DSCR.
Hard money
10% down · 12.0% · 12mo
- Down + closing
- —
- Monthly P&I
- —
- Monthly cashflow
- —
- DSCR
- —
- Eligible?
- —
Short-term bridge; refi at stabilization.
Listing history 12 events
-
2026-06-18days on market $475,000 Active 116 DOM
-
2026-06-17days on market $475,000 Active 115 DOM
-
2026-06-16days on market $475,000 Active 114 DOM
-
2026-06-15days on market $475,000 Active 113 DOM
-
2026-06-13days on market $475,000 Active 111 DOM
-
2026-06-10days on market $475,000 Active 107 DOM
-
2026-06-08days on market $475,000 Active 106 DOM
-
2026-06-07days on market $475,000 Active 105 DOM
-
2026-06-04days on market $475,000 Active 102 DOM
-
2026-06-01days on market $475,000 Active 99 DOM
-
2026-05-31days on market $475,000 Active 98 DOM
-
2026-02-22$475,000 Active 698-char remark
Show marketing remark (698 chars)
Excellent investment opportunity! One-story 4-plex featuring a practical layout with two units in the front and two units in the back, offering flexibility for tenants and owner-occupants alike. Perfect opportunity to live in one unit and rent the other three to generate income. Each unit offers private entrances and functional living spaces. Located just minutes from Downtown Houston with easy access to major freeways, dining, and entertainment. Strong rental potential in a high-demand area makes this an ideal addition to any portfolio or a smart house-hack opportunity. A rare chance to secure a versatile multi-family property with income-producing potential in a rapidly growing location.
ⓘ Source: listings_history table (triggers on properties + properties_extension) + one-shot
backfill from property_details.listing_events for pre-trigger history.
Climate risk First Street
- Flood 4/10 Moderate FEMA zone X (unshaded) · 20% chance over 30 yrs
- Wildfire 1/10 Low
- Heat 9/10 Extreme 7 d/yr ≥109°F today · 25 d/yr by 30 yrs out
- Wind 9/10 Extreme 99% chance of damaging wind over 30 yrs
- Air quality 2/10 Low 2 unhealthy d/yr today · 2 by 30 yrs out
Nearby sold comps map
Loading sold comps map…
Walkable amenities ~0.75 mi
Loading nearby amenities…
Taxation est. · year 1
- Rental income
- $78,372
- − Mortgage interest
- −$26,607
- − Property taxes
- −$7,125
- − Insurance
- −$2,375
- − Repairs & maintenance
- −$6,270
- − Management
- −$6,270
- − Depreciation
- −$13,818
- Taxable income
- $15,907
- Est. tax owed @ 24.0%
- −$3,818
- After-tax cash flow
- $18,705/yr
For passive investors: Depreciation is non-cash, so a rental often shows a tax loss while cash-flowing — sheltering income. Rental losses are passive: they offset passive income freely, and up to $25,000/yr can offset ordinary (W-2) income if you actively participate and your MAGI is under $100k (phasing out to $0 by $150k); unused losses carry forward. On sale, claimed depreciation is recaptured at up to 25%, and gains may owe capital-gains tax (a 1031 exchange can defer both). Figures are a year-1 estimate at your 24.0% rate — not tax advice; consult a CPA.
Condition & rehab AI · 14 photos
This multi-family property is in good condition with a good condition score of 75. It has a cosmetic rehab level and requires minor repairs and maintenance. The highest-ROI updates would be deep cleaning and organization in the kitchen and landscaping improvements to enhance curb appeal and attract more interest.
Repairs flagged
- Minor Kitchen clutter — Clutter in the kitchen suggests a need for cleaning and organization.
Value-add opportunities
- Both Deep cleaning and organization in the kitchen — A clean and organized kitchen enhances the home's appeal and can attract more tenants or buyers.
- Both Landscaping improvements — Enhanced landscaping can improve curb appeal and attract more interest from potential buyers or tenants.
Renovation cost estimate screening
| Repair item | Severity | Est. cost |
|---|---|---|
| Kitchen clutter · Clutter in the kitchen suggests a need for cleaning and organization. | Minor | $500–3,000 |
| Total estimated repair cost · 1 items | $500–3,000 |
Value-add ROI direction
- Both Deep cleaning and organization in the kitchen — A clean and organized kitchen enhances the home's appeal and can attract more tenants or buyers. ↑
- Both Landscaping improvements — Enhanced landscaping can improve curb appeal and attract more interest from potential buyers or tenants. ↑
ⓘ Cost ranges are severity-bucket heuristics (US national rule-of-thumb). Get contractor quotes + a written scope before underwriting a rehab budget.
Schools (NCES district)
- District
- Houston ISD
- NCES district ID
- 4823640
- Math proficiency
- 27% ▼ -18.00%
- Reading proficiency
- 35% ▼ -6.00%
- Median HH income
- $46,054
- Composite
- 26.63/100
- National rank
- #7173
- State rank
- #593 of 826 in TX
Livability — Houston
- Score
- 74/100
- State rank
- #184
- US rank
- #4771
Category grades
Schools grade is shown separately in the Schools card above.
Census & demographics
- Census place
- Houston, TX
- County
- Harris County · 4,702,590 people
- City population
- 3,226,434
- Metro
- Houston-The Woodlands-Sugar Land, TX
- Population (ZIP)
- 10,164
- Household income
- $83,980
- Rent vs Own
- Severe rent burden
- 572.0
Population outlook (Harris County) Hauer SSP2
- Today (2025)
- 5,571,493 people
- By 2030
- 6,089,821 · +9.3%
- By 2040
- 7,142,806 · +28.2%
- By 2050
- 8,185,864 · +46.9%
- By 2075
- 10,574,329 · +89.8%
- By 2100
- 12,109,958 · +117.4%
Race, ethnicity, and origin ACS 2023
- Neighborhood character
- Highly diverse neighborhood (Simpson 0.72)
- Race & ethnicity
- Hispanic / Latino 35% White 33% Black 21% Two or more races 20% Asian 6% Native American 1%
- Hispanic origin (detail)
- Mexican 24% Puerto Rican 2% Cuban 2%
- Common ancestry
- Lithuanian 2% Romanian 2% Slovak 1%
- Foreign-born
- 15% · Canada, South Korea, Jamaica
- Languages at home
- 69% English-only · Spanish 27% Korean 2% Other Asian/Pacific 1%
Political lean MEDSL · Harris
- 2024 margin
- Lean D (+5.5) · D 52.0% · R 46.4% · Other 1.6%
- 2008→2024 swing
- +3.9pp toward D · 2008: 1.6pp · 2024: 5.5pp
- All cycles
- 2024: D+5.5 2020: D+13.3 2016: D+12.4 2012: D+0.1 2008: D+1.6
Not yet ingested
- Civics
- —
Market trends
- HPI YoY
- ▼ -53.64%
- Current HPI
- 130.0078
- Rent YoY
- ▼ -1.65%
- Metro
- Houston-The Woodlands-Sugar Land, TX
- State GDP YoY
- ▲ 3.95%
- F500 in state
- 110
Industry mix (Fortune 500 HQ in TX)
| Industry | F500 HQs | Revenue |
|---|---|---|
| Energy | 16 | $1,198B |
|
||
| Technology | 5 | $198B |
|
||
| Engineering / Construction | 4 | $72B |
|
||
| Energy Services | 3 | $60B |
|
||
| Utilities | 3 | $41B |
|
||
| Healthcare | 2 | $330B |
|
||
Price history
1 event — show timeline
- 2026-02-22 Listed $475,000 HARMLS
Cash-flow waterfall
monthlySold comps — $/sqft
last 12 mo · ≤1 miLoading sold comps…