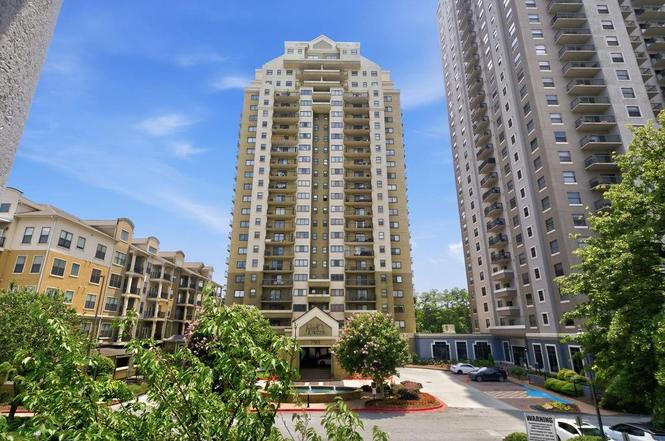
795 Hammond Dr #710 · Sandy Springs, GA
Flood risk 1/10 · Minimal
- FEMA flood zone
- X (unshaded)
- Chance of flooding over 30 yrs
- 0.0%
- Est. flood insurance / yr
- $507 – $1,088
Fire risk 1/10 · Minimal
- Est. fire insurance / yr
- $963 – $1,789
Heat risk 5/10 · Moderate
- Hot days now (above 103°F)
- 7 days/yr
- Hot days in 30 yrs
- 18 days/yr
Wind risk 4/10 · Minor
- Chance of severe wind over 30 yrs
- 18.0%
Air-quality risk 5/10 · Moderate
- Unhealthy air days now
- 6 days/yr
- Unhealthy air days in 30 yrs
- 8 days/yr
Risk factors via First Street. Map © Google.
Why this score? — see what drove the C- grade
The composite is a weighted blend of 9 inputs, each scored 0–100. Each bar is that input's sub-score; the figure is the points it added to the 100-point composite (weight × sub-score).
- Cash flow +16.7/30.0
- 1% rule +8.1/10.0
- ARV discount +7.5/15.0
- DSCR +5.2/10.0
- Schools +4.5/10.0
- Livability +3.7/5.0
- Condition / age +2.5/5.0
- Rent growth +2.4/5.0
- Appreciation +0.0/10.0
$135,000
🖨 Deal sheet (PDF) 📄 Offer letter ✓ Due diligence
Listing remarks MLS
1BD/1BA IN PARK TOWERS HIGHRISE. CLOSE PROXIMITY TO PERIMETER MALL, SHOPPING, DINING, SR 400 AND I-285. PROPERTY SOLD AS/IS. PROOF OF FUNDS FOR CASH OFFERS.
Key facts
- Hardwood flooring
- Private view
- $390 HOA
Tags
Property features AI
Finance
- Financial info: Multifamily community of 1 unit
- HOA & community: HOA fee $390 per month; Community amenities: concierge, fitness center, pool, playground, park, tennis courts, storage, street lights, near public transport, near schools, near shopping
Exterior
- Parking: Assigned parking in a parking lot (1 space)
- Utilities: Public water; Public sewer; Electricity available; Natural gas available
- Home design: Condominium; One level; Resale property
- Construction: Other construction materials; Other roof
- Exterior features: Balcony; Storage; City street frontage
Interior
- Kitchen: Breakfast bar; Eat-in kitchen; Stone counters; Dishwasher; Disposal; Electric cooktop; Microwave; Refrigerator
- Bedrooms: Studio layout (main level)
- Flooring: Hardwood floors
- Bathrooms: 1 full bathroom (main level)
- Heating & cooling: Wall heating units; Wall cooling units
- Interior features: Vaulted ceilings; Shared walls (2+ units)
Neighborhood map
What this means for you Summary
Snapshot
- This is a 1-bed/1.0-bath condo listed at $135k.
Deal economics
- At list price, monthly cash flow is $84 ($1k/yr) — positive.
- The deal already cash-flows at list — no discount required.
- Meets the 1% rule at list price ($2k rent vs $135k).
- Cap rate 7.0% vs local median 2.6% in Sandy Springs — top-decile yield for the area; either an underpriced asset or a hidden risk that comps aren't pricing in. Stress-test before assuming the spread holds.
Location & tenants
- Location reads 73/100 on livability (#45 in GA) — a middle-class / working-renter tenant base. Strengths: employment A+, crime A-, commute A-; Watch: amenities F, cost of living F.
- Fulton County (suburban): math 49% / reading 53% proficiency, ranked #12 of 174 in GA (top 7%) — acceptable for families but not a draw, mixed tenant base, ~2y average lease.
- Zoned schools: High Point Elementary School (math 46% / reading 51%, grade D, #284 of 1,228 statewide, top 23%, 675 students, 48% FRL); Ridgeview Charter School (math 33% / reading 45%, grade F, #155 of 470 statewide, top 33%, 996 students, 45% FRL); Riverwood International Charter School (math 24% / reading 10%, grade F, #269 of 424 statewide, top 65%, 1,737 students, 30% FRL) — zoned schools at 41% FRL track the district average.
- Zoned-school proficiency averages 35% at this address vs 51% district-wide (-16 pts) — the specific schools serving this property underperform the Fulton County average; the district grade overstates school quality for this exact location.
- Market conditions: Rents soft (-0.2%/yr); 381 active listings in the ZIP; 3 comparable units currently listed for rent nearby; rentals leasing fast (median 7d on market — plan ~1-2 weeks tenant-placement turnaround); high-income renter base; 11,565 units permitted in Fulton County in 2024 (8,159 in 5+ unit buildings).
Forward outlook
- Local home prices are declining (-3.0%/yr); year-one equity from $933 of loan paydown is wiped out by about $4k of value loss. Plan a longer hold.
- Fulton County population projected at +38% by 2050 — long-run rental-demand tailwind backs the buy-and-hold thesis.
Negotiation context
- Only 5 days on market — expect competitive offers; lowballing is unlikely to land.
- 3 sale attempts since 14y ago with the ask held roughly flat each time — persistent listings suggest the price (not the market) is what's stuck; bring a comps-based counter.
- Current owner paid $26k; list at $135k implies a 419% gain — meaningful room to come down on a strong offer.
Risks & watch-outs
- Watch-outs: HOA is 22% of rent.
- Climate carrying-cost: extreme-heat days projected 7→18/yr by 2055 (HVAC capex compounding) — expect insurance premiums to compound above CPI over the hold.
Questions for the listing agent
- What does the HOA fee cover, when was the last increase, and are there any pending special assessments or reserve-fund shortfalls?
- Any open or pending special assessments — roof, HVAC, plumbing, elevator, façade? What's the per-unit balance and payoff schedule, and is the seller paying it off at close or rolling it to the buyer?
- Is there a deadline driving the sale (1031 exchange, divorce, estate, relocation)? That informs how much negotiation room exists.
- What's the average days-on-market for RENTAL listings here right now (not sales)? A rising rental-DOM trend means longer vacancies and softer asking-rent achievability than the comps imply.
- What's the recent tenant-quality profile in this submarket — average credit score on applications, eviction rate, late-payment / NSF rate, and stable-employment percentage? A property-management company in the area should have these aggregated.
- How much new apartment / multifamily construction is in the pipeline within 1–3 miles? Heavy new supply (>2% of stock underway) typically softens rents 12–24 months out; light construction supports rent growth.
Investment metrics
- 1% rule
- 1.31% ✓
- Cap rate
- 7.04%
- Cash-on-cash
- 2.67%
- DSCR
- 1.12
- GRM
- 6.4
CMA / ARV
No comps found within radius.
Projected returns pro-forma
-3.0% appreciation · 0.0% rent growth · sell at horizon
- IRR
- -16.6%
- Equity multiple
- 0.43×
- Total profit
- $-21,433
- Equity at exit
- $20,129
- IRR
- -18.5%
- Equity multiple
- 0.19×
- Total profit
- $-30,689
- Equity at exit
- $11,672
Cash invested: $37,800 (down + closing). Projections, not guarantees.
Landlord ↔ Tenant lean methodology
- Overall (STATE)
- 90 Strongly Landlord-Friendly
- State Georgia
- 90 Strongly Landlord-Friendly · R+3
- County
- — inherits STATE
- City
- — inherits STATE
ZIP-level market 30328
- Rents YoY
- -0.2%
- Active inventory
- 381
- Price-to-rent
- 6.4×
Monthly cashflow live
- Estimated rent
- $1,762 medium interval (Pro) →
- Mortgage (P&I)
- −$708
- Tax from tax record
- −$154 /mo · $1,850/yr
- Insurance
- −$56
- HOA
- −$390
- Vacancy / Maint / Mgmt
- −$370
- Net cashflow
- $84
Break-even live
Sensitivity live
| Price | -10% $160 | -5% $122 | +0% $84 | +5% $46 | +10% $8 |
|---|---|---|---|---|---|
| Rent | -10% $-55 | -5% $14 | +0% $84 | +5% $154 | +10% $223 |
| Rate | -1.0pp $152 | -0.5pp $118 | base $84 | +0.5pp $49 | +1.0pp $13 |
UW: 25.0% down · 7.5% · 30yr · 1.5% tax · 5.0% vac · 8.0% maint · 8.0% mgmt
Financing live
Cash to close
- Down payment
- $33,750
- Closing costs
- $4,050
- Reserves months
- —
- Total cash needed
- —
Loan-product check · same deal, 3 products live
Conventional
25% down · 7.5% · 30yr
- Down + closing
- —
- Monthly P&I
- —
- Monthly cashflow
- —
- DSCR
- —
- Eligible?
- —
Personal DTI + credit; lowest rate.
DSCR
20% down · 8.5% · 30yr
- Down + closing
- —
- Monthly P&I
- —
- Monthly cashflow
- —
- DSCR
- —
- Eligible?
- —
No personal income docs; deal must DSCR.
Hard money
10% down · 12.0% · 12mo
- Down + closing
- —
- Monthly P&I
- —
- Monthly cashflow
- —
- DSCR
- —
- Eligible?
- —
Short-term bridge; refi at stabilization.
Rent comps 3 comps
| Address | Beds | Baths | Sqft | Rent | $/sqft | DOM | Units | Dist |
|---|---|---|---|---|---|---|---|---|
| 1050 Hammond Dr Atlanta, GA | — | 1.0 | 270 | $2,050 | $7.59 | 7d | 1 | 0.40mi |
| 905 Crestline Pkwy Atlanta, GA | — | 1.0 | 300 | $2,014 | $6.71 | 3d | 1 | 0.74mi |
| 6330 Peachtree Dunwoody Rd Atlanta, GA | — | 1.0 | 300 | $1,439 | $4.80 | 7d | 1 | 0.78mi |
HOA detail condo
- Monthly dues
- $390 · $4,680/yr
- Assessments
- None detected in remarks — confirm with the listing agent.
Listing history 4 events
-
2026-06-21days on market $135,000 Active 5 DOM
-
2026-06-18days on market $135,000 Active 2 DOM
-
2026-06-17remarks 699-char remark
-
2026-06-17$135,000 Active 1 DOM
ⓘ Source: listings_history table (triggers on properties + properties_extension) + one-shot
backfill from property_details.listing_events for pre-trigger history.
Tax reassessment forecast GA · Resets to sale price
- Current annual tax
- $1,850 · $154/mo
- Projected year-2 tax
- $1,850 · $154/mo
- Expected delta
- $0/yr ($0/mo · 0.0%)
ⓘ Screening estimate from a state-policy table — verify with the county assessor before closing.
Climate risk First Street
- Flood 1/10 Low FEMA zone X (unshaded) · 0% chance over 30 yrs
- Wildfire 1/10 Low
- Heat 5/10 Major 7 d/yr ≥103°F today · 18 d/yr by 30 yrs out
- Wind 4/10 Moderate 18% chance of damaging wind over 30 yrs
- Air quality 5/10 Major 6 unhealthy d/yr today · 8 by 30 yrs out
Nearby sold comps map
Loading sold comps map…
Walkable amenities ~0.75 mi
Loading nearby amenities…
Taxation est. · year 1
- Rental income
- $21,150
- − Mortgage interest
- −$7,562
- − Property taxes
- −$1,850
- − Insurance
- −$675
- − Repairs & maintenance
- −$1,692
- − Management
- −$1,692
- − HOA
- −$4,680
- − Depreciation
- −$3,927
- Taxable loss
- −$928
- Est. tax savings @ 24.0%
- +$223
- After-tax cash flow
- $1,231/yr
For passive investors: Depreciation is non-cash, so a rental often shows a tax loss while cash-flowing — sheltering income. Rental losses are passive: they offset passive income freely, and up to $25,000/yr can offset ordinary (W-2) income if you actively participate and your MAGI is under $100k (phasing out to $0 by $150k); unused losses carry forward. On sale, claimed depreciation is recaptured at up to 25%, and gains may owe capital-gains tax (a 1031 exchange can defer both). Figures are a year-1 estimate at your 24.0% rate — not tax advice; consult a CPA.
Schools (NCES district)
- District
- Fulton County
- NCES district ID
- 1302280
- Math proficiency
- 49% ▼ -2.00%
- Reading proficiency
- 53% ▬ 0.00%
- Median HH income
- $68,035
- Composite
- 45.33/100
- National rank
- #2640
- State rank
- #12 of 174 in GA
Livability — Sandy Springs
- Score
- 73/100
- State rank
- #45
- US rank
- #5106
Category grades
Schools grade is shown separately in the Schools card above.
Census & demographics
- Census place
- Sandy Springs, GA
- County
- Fulton County · 1,094,430 people
- City population
- 108,027
- Metro
- Atlanta-Sandy Springs-Alpharetta, GA
- Population (ZIP)
- 39,508
- Household income
- $112,111
- Rent vs Own
- Severe rent burden
- 1884.0
Population outlook (Fulton County) Hauer SSP2
- Today (2025)
- 1,203,707 people
- By 2030
- 1,299,706 · +8.0%
- By 2040
- 1,488,256 · +23.6%
- By 2050
- 1,664,580 · +38.3%
- By 2075
- 2,036,072 · +69.2%
- By 2100
- 2,222,402 · +84.6%
Race, ethnicity, and origin ACS 2023
- Neighborhood character
- Diverse neighborhood (Simpson 0.61)
- Race & ethnicity
- White 59% Black 18% Asian 12% Two or more races 8% Hispanic / Latino 7%
- Hispanic origin (detail)
- Mexican 2%
- Common ancestry
- Romanian 3% Italian 3% Slovak 3%
- Foreign-born
- 17% · Canada, China, South Korea
- Languages at home
- 81% English-only · Other Indo-European 5% Spanish 4% Other Asian/Pacific 4%
Political lean MEDSL · Fulton
- 2024 margin
- Solid D (+44.9) · D 71.9% · R 27.0% · Other 1.1%
- 2008→2024 swing
- +9.8pp toward D · 2008: 35.0pp · 2024: 44.9pp
- All cycles
- 2024: D+44.9 2020: D+46.4 2016: D+42.1 2012: D+29.6 2008: D+35.0
Not yet ingested
- Civics
- —
Market trends
- HPI YoY
- ▼ -361.92%
- Current HPI
- 238.4936
- Rent YoY
- ▼ -0.24%
- Metro
- Atlanta-Sandy Springs-Alpharetta, GA
- State GDP YoY
- ▲ 2.66%
- F500 in state
- 28
Industry mix (Fortune 500 HQ in GA)
| Industry | F500 HQs | Revenue |
|---|---|---|
| Paper / Packaging | 2 | $29B |
|
||
| Retail | 1 | $160B |
|
||
| Transportation / Logistics | 1 | $91B |
|
||
| Airlines | 1 | $62B |
|
||
| Consumer Goods | 1 | $47B |
|
||
| Utilities | 1 | $25B |
|
||
Price history
+467.2% since first listed14 events — show timeline
- 2026-06-16 Listed $135,000 FMLS
- 2014-11-05 Price Changed $26,000 GAMLS
- 2012-06-20 Price Changed $26,000 FMLS
- 2012-06-20 Listing Removed — FMLS
- 2012-06-14 Sold (MLS) $26,000 GAMLS
- 2012-06-14 Price Changed $28,900 FMLS
- 2012-06-14 Sold (MLS) $26,000 FMLS
- 2012-06-04 Listing Removed — GAMLS
- 2012-06-04 Pending — FMLS
- 2012-05-24 Price Changed $28,900 GAMLS
- 2012-04-24 Listed $28,900 GAMLS
- 2012-04-24 Listed $28,900 FMLS
- 2012-03-14 Sold (Public Records) $23,800 Public Records
- 2010-05-17 Listing Removed — FMLS
Property tax history
+4.2%/yrLatest (2025): $1,850 · -0.0% YoY. Source: county tax records.
Cash-flow waterfall
monthlySold comps — $/sqft
last 12 mo · ≤1 miLoading sold comps…