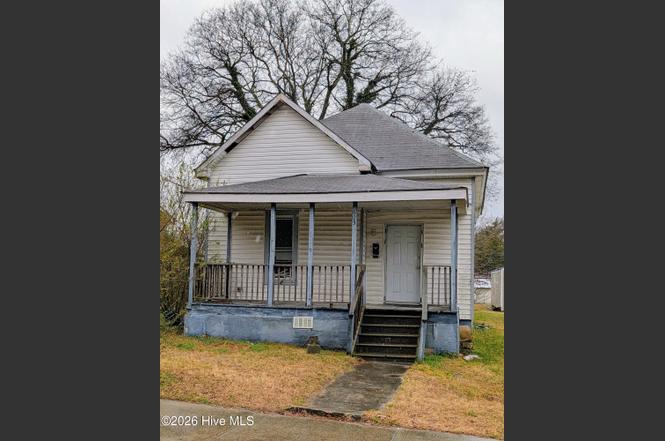
603 Kenmore Ave · Louisburg, NC
Flood risk 1/10 · Minimal
- FEMA flood zone
- X (unshaded)
- Chance of flooding over 30 yrs
- 0.0%
- Est. flood insurance / yr
- $507 – $1,088
Fire risk 3/10 · Minor
- Est. fire insurance / yr
- $906 – $1,684
Heat risk 6/10 · Moderate
- Hot days now (above 107°F)
- 7 days/yr
- Hot days in 30 yrs
- 16 days/yr
Wind risk 6/10 · Moderate
- Chance of severe wind over 30 yrs
- 55.0%
Air-quality risk 2/10 · Minimal
- Unhealthy air days now
- 1 days/yr
- Unhealthy air days in 30 yrs
- 1 days/yr
Risk factors via First Street. Map © Google.
Why this score? — see what drove the B- grade
The composite is a weighted blend of 9 inputs, each scored 0–100. Each bar is that input's sub-score; the figure is the points it added to the 100-point composite (weight × sub-score).
- Cash flow +30.0/30.0
- 1% rule +10.0/10.0
- DSCR +10.0/10.0
- ARV discount +7.5/15.0
- Livability +3.3/5.0
- Schools +3.0/10.0
- Rent growth +2.5/5.0
- Condition / age +2.5/5.0
- Appreciation +0.0/10.0
$79,900
🖨 Deal sheet (PDF) 📄 Offer letter ✓ Due diligence
Listing remarks MLS
Great investment property! * * * * * * * Selling bonus offered by Homesteps.com (register online for details and bonus amount) * * * * * *
Key facts
- Convenient access
- Easy commute
- 3,049 sq ft lot
Tags
Neighborhood map
What this means for you Summary
Snapshot
- This is a 3-bed/1.0-bath single-family listed at $80k.
Deal economics
- At list price, monthly cash flow is $691 ($8k/yr) — positive.
- The deal already cash-flows at list — no discount required.
- Meets the 1% rule at list price ($2k rent vs $80k).
- Recommended offer: $79k (1.5% below list) — sets the bar for market timing.
- Cap rate 16.7% vs local median 3.2% in Louisburg — top-decile yield for the area; either an underpriced asset or a hidden risk that comps aren't pricing in. Stress-test before assuming the spread holds.
Location & tenants
- Location reads 66/100 on livability (#289 in NC) — a middle-class / working-renter tenant base. Strengths: cost of living A+, housing A+, crime A; Watch: amenities F, commute F, employment F.
- Franklin County Schools (rural): math 34% / reading 37% proficiency, ranked #128 of 178 in NC (top 72%) — families likely to look elsewhere, expect single-tenant / working-renter base with shorter leases.
- Zoned schools: Royal Elementary (math 22% / reading 27%, grade F, #1,112 of 1,410 statewide, top 82%, 347 students, 73% FRL); Terrell Lane Middle (math 26% / reading 34%, grade F, #335 of 475 statewide, top 72%, 395 students, 79% FRL); Louisburg Magnet High (math 47% / reading 52%, grade D, #311 of 535 statewide, top 60%, 536 students, 69% FRL) — zoned schools average 74% FRL vs 54% district-wide (19 pts higher); higher-poverty schools than district average — tighter screening recommended.
- Market conditions: 441 active listings in the ZIP; 948 units permitted in Franklin County in 2024 (0 in 5+ unit buildings).
Forward outlook
- Local home prices are declining (-3.0%/yr); year-one equity from $552 of loan paydown is wiped out by about $2k of value loss. Plan a longer hold.
- Franklin County population projected at +13% by 2050 — modest demand growth; plan on rents tracking national, not racing it.
- At projected returns (-3.0% appreciation + 3.0% rent growth), your $22k cash investment doubles in ~4 years — after that, you're playing with house money.
Negotiation context
- It's been on market 22 days — a 2% lower offer ($79k) is reasonable based on typical stale-listing flexibility.
- 3 sale attempts since 22y ago with the ask held roughly flat each time — persistent listings suggest the price (not the market) is what's stuck; bring a comps-based counter.
- Current owner paid $12k; list at $80k implies a 566% gain — meaningful room to come down on a strong offer.
Risks & watch-outs
- Watch-outs: built in 1901 — expect roof / HVAC / electrical / plumbing capex.
- Climate carrying-cost: major wind risk, 55% chance of damaging wind over 30y; extreme-heat days projected 7→16/yr by 2055 (HVAC capex compounding) — expect insurance premiums to compound above CPI over the hold.
Questions for the listing agent
- Built in 1901 — when were the roof, HVAC, electrical panel, plumbing, and water heater last replaced?
- Is there a deadline driving the sale (1031 exchange, divorce, estate, relocation)? That informs how much negotiation room exists.
- Schools are D-rated, which usually means shorter tenancies and higher turnover. Who's the typical renter profile here, and what's been the actual vacancy rate?
- What's the average days-on-market for RENTAL listings here right now (not sales)? A rising rental-DOM trend means longer vacancies and softer asking-rent achievability than the comps imply.
- What's the recent tenant-quality profile in this submarket — average credit score on applications, eviction rate, late-payment / NSF rate, and stable-employment percentage? A property-management company in the area should have these aggregated.
- How much new for-sale + rental construction is in the pipeline within 1–3 miles? Heavy new supply typically softens prices + rents 12–24 months out; constrained supply supports both.
Investment metrics
- 1% rule
- 1.91% ✓
- Cap rate
- 16.68%
- Cash-on-cash
- 37.08%
- DSCR
- 2.65
- GRM
- 4.4
CMA / ARV
- ARV (on-the-fly)
- $229,788
- Comps found
- 1
Show comp detail 1 sale within ~0.75 mi
| Address | Dist | Beds/Ba | Sqft | Sold | Price | $/sf | Match |
|---|---|---|---|---|---|---|---|
| 309 Ridley St | 0.28mi | 3/2.0 | 1,080 (+10%) | 17mo | $253,000 | $234 | 52 |
Match score weights: distance 35% · size 25% · config 20% · recency 20%. Top-matched comps best support the ARV.
Projected returns pro-forma
-3.0% appreciation · 3.0% rent growth · sell at horizon
- IRR
- 33.0%
- Equity multiple
- 2.39×
- Total profit
- $31,083
- Equity at exit
- $11,913
- IRR
- 40.0%
- Equity multiple
- 4.74×
- Total profit
- $83,762
- Equity at exit
- $6,908
Cash invested: $22,372 (down + closing). Projections, not guarantees.
Landlord ↔ Tenant lean methodology
- Overall (STATE)
- 85 Strongly Landlord-Friendly
- State North Carolina
- 85 Strongly Landlord-Friendly · R+3
- County
- — inherits STATE
- City
- — inherits STATE
ZIP-level market 27549
- Home prices YoY
- -18.7%
- Active inventory
- 441
- Price-to-rent
- 4.4×
Monthly cashflow live
- Estimated rent
- $1,527 medium interval (Pro) →
- Mortgage (P&I)
- −$419
- Tax from tax record
- −$63 /mo · $752/yr
- Insurance
- −$33
- HOA
- −$0
- Vacancy / Maint / Mgmt
- −$321
- Net cashflow
- $691
Break-even live
Sensitivity live
| Price | -10% $737 | -5% $714 | +0% $691 | +5% $669 | +10% $646 |
|---|---|---|---|---|---|
| Rent | -10% $571 | -5% $631 | +0% $691 | +5% $752 | +10% $812 |
| Rate | -1.0pp $732 | -0.5pp $712 | base $691 | +0.5pp $671 | +1.0pp $650 |
UW: 25.0% down · 7.5% · 30yr · 1.5% tax · 5.0% vac · 8.0% maint · 8.0% mgmt
Financing live
Cash to close
- Down payment
- $19,975
- Closing costs
- $2,397
- Reserves months
- —
- Total cash needed
- —
Loan-product check · same deal, 3 products live
Conventional
25% down · 7.5% · 30yr
- Down + closing
- —
- Monthly P&I
- —
- Monthly cashflow
- —
- DSCR
- —
- Eligible?
- —
Personal DTI + credit; lowest rate.
DSCR
20% down · 8.5% · 30yr
- Down + closing
- —
- Monthly P&I
- —
- Monthly cashflow
- —
- DSCR
- —
- Eligible?
- —
No personal income docs; deal must DSCR.
Hard money
10% down · 12.0% · 12mo
- Down + closing
- —
- Monthly P&I
- —
- Monthly cashflow
- —
- DSCR
- —
- Eligible?
- —
Short-term bridge; refi at stabilization.
Listing history 2 events
-
2026-05-31remarks 699-char remark
-
2026-05-31$79,900 Pending 22 DOM
ⓘ Source: listings_history table (triggers on properties + properties_extension) + one-shot
backfill from property_details.listing_events for pre-trigger history.
Tax reassessment forecast NC · Resets to sale price
- Current annual tax
- $752 · $63/mo
- Projected year-2 tax
- $752 · $63/mo
- Expected delta
- $0/yr ($0/mo · 0.0%)
ⓘ Screening estimate from a state-policy table — verify with the county assessor before closing.
Climate risk First Street
- Flood 1/10 Low FEMA zone X (unshaded) · 0% chance over 30 yrs
- Wildfire 3/10 Moderate
- Heat 6/10 Major 7 d/yr ≥107°F today · 16 d/yr by 30 yrs out
- Wind 6/10 Major 55% chance of damaging wind over 30 yrs
- Air quality 2/10 Low 1 unhealthy d/yr today · 1 by 30 yrs out
Nearby sold comps map
Loading sold comps map…
Walkable amenities ~0.75 mi
Loading nearby amenities…
Taxation est. · year 1
- Rental income
- $18,323
- − Mortgage interest
- −$4,476
- − Property taxes
- −$752
- − Insurance
- −$400
- − Repairs & maintenance
- −$1,466
- − Management
- −$1,466
- − Depreciation
- −$2,324
- Taxable income
- $7,440
- Est. tax owed @ 24.0%
- −$1,786
- After-tax cash flow
- $6,510/yr
For passive investors: Depreciation is non-cash, so a rental often shows a tax loss while cash-flowing — sheltering income. Rental losses are passive: they offset passive income freely, and up to $25,000/yr can offset ordinary (W-2) income if you actively participate and your MAGI is under $100k (phasing out to $0 by $150k); unused losses carry forward. On sale, claimed depreciation is recaptured at up to 25%, and gains may owe capital-gains tax (a 1031 exchange can defer both). Figures are a year-1 estimate at your 24.0% rate — not tax advice; consult a CPA.
Schools (NCES district)
- District
- Franklin County Schools
- NCES district ID
- 3701530
- Math proficiency
- 34% ▬ 0.00%
- Reading proficiency
- 37% ▼ -4.00%
- Median HH income
- $44,630
- Composite
- 30.25/100
- National rank
- #6286
- State rank
- #128 of 178 in NC
Livability — Louisburg
- Score
- 66/100
- State rank
- #289
- US rank
- #12287
Category grades
Schools grade is shown separately in the Schools card above.
Census & demographics
- Census place
- Louisburg, NC
- County
- Franklin County · 64,885 people
- City population
- 25,543
- Metro
- Raleigh-Cary, NC
- Population (ZIP)
- 25,543
- Household income
- $67,879
- Rent vs Own
- Severe rent burden
- 677.0
Population outlook (Franklin County) Hauer SSP2
- Today (2025)
- 69,848 people
- By 2030
- 72,480 · +3.8%
- By 2040
- 76,682 · +9.8%
- By 2050
- 78,993 · +13.1%
- By 2075
- 82,888 · +18.7%
- By 2100
- 80,784 · +15.7%
Race, ethnicity, and origin ACS 2023
- Neighborhood character
- Diverse neighborhood (Simpson 0.58)
- Race & ethnicity
- White 58% Black 25% Hispanic / Latino 13% Two or more races 5%
- Hispanic origin (detail)
- Mexican 10%
- Common ancestry
- Serbian 1% Italian 1% Slovak 1%
- Foreign-born
- 6% · Canada
- Languages at home
- 88% English-only · Spanish 10% German/W. Germanic 1%
Political lean MEDSL · Franklin
- 2024 margin
- R (+13.6) · D 42.7% · R 56.3%
- 2008→2024 swing
- -12.9pp toward R · 2008: -0.7pp · 2024: -13.6pp
- All cycles
- 2024: R+13.6 2020: R+13.4 2016: R+11.7 2012: R+4.2 2008: R+0.7
Not yet ingested
- Civics
- —
Market trends
- HPI YoY
- ▼ -52.02%
- Current HPI
- 225.8639
- Rent YoY
- —
- Metro
- Raleigh-Cary, NC
- State GDP YoY
- ▲ 3.28%
- F500 in state
- 26
Industry mix (Fortune 500 HQ in NC)
| Industry | F500 HQs | Revenue |
|---|---|---|
| Financial Services | 2 | $213B |
|
||
| Retail | 2 | $95B |
|
||
| Industrial Conglomerate | 1 | $38B |
|
||
| Metals / Steel | 1 | $35B |
|
||
| Utilities | 1 | $30B |
|
||
| Industrial Machinery | 1 | $19B |
|
||
Price history
+565.8% since first listed7 events — show timeline
- 2026-04-01 Pending — Hive MLS
- 2026-03-10 Listed $79,900 Hive MLS
- 2005-02-25 Sold (MLS) $12,000 AMLSNC
- 2005-02-25 Sold (MLS) $12,000 TMLS
- 2005-01-28 Listing Removed — TMLS
- 2004-07-11 Listed $12,000 AMLSNC
- 2004-07-11 Listed $12,000 TMLS
Property tax history
+4.1%/yrLatest (2025): $752 · +0.0% YoY. Source: county tax records.
Cash-flow waterfall
monthlySold comps — $/sqft
last 12 mo · ≤1 miLoading sold comps…