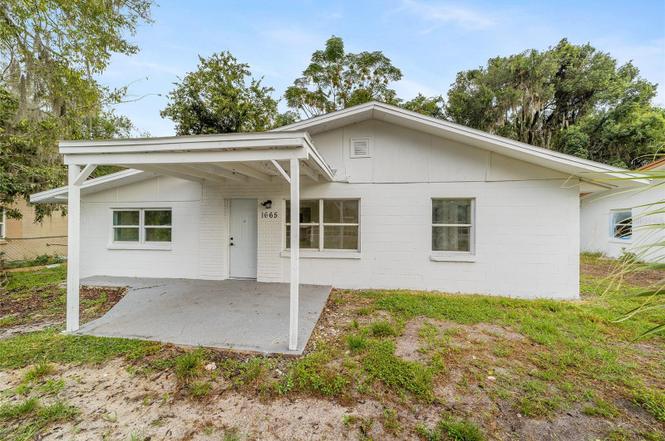
1665 SW 3rd St · Ocala, FL
Flood risk 1/10 · Minimal
- FEMA flood zone
- X (unshaded)
- Chance of flooding over 30 yrs
- 0.0%
- Est. flood insurance / yr
- $507 – $1,088
Fire risk 3/10 · Minor
- Est. fire insurance / yr
- $947 – $1,759
Heat risk 8/10 · Major
- Hot days now (above 107°F)
- 7 days/yr
- Hot days in 30 yrs
- 22 days/yr
Wind risk 9/10 · Severe
- Chance of severe wind over 30 yrs
- 99.0%
Air-quality risk 3/10 · Minor
- Unhealthy air days now
- 3 days/yr
- Unhealthy air days in 30 yrs
- 3 days/yr
Risk factors via First Street. Map © Google.
Why this score? — see what drove the B- grade
The composite is a weighted blend of 9 inputs, each scored 0–100. Each bar is that input's sub-score; the figure is the points it added to the 100-point composite (weight × sub-score).
- Cash flow +25.1/30.0
- ARV discount +14.5/15.0
- DSCR +8.2/10.0
- 1% rule +6.0/10.0
- Schools +3.6/10.0
- Livability +3.5/5.0
- Condition / age +2.5/5.0
- Rent growth +2.3/5.0
- Appreciation +0.0/10.0
$144,900
🖨 Deal sheet (PDF) 📄 Offer letter ✓ Due diligence
Listing remarks
PRICED ADJUSTED BELOW APPRAISED VALUE! Welcome to this charming and affordable home offering over 1,040 sq ft of comfortable living space, enhanced with a brand-new 2025 roof for added peace of mind. Nestled in a quiet, well-established neighborhood with no HOA, this property blends convenience, value, and location. Perfectly positioned less than one mile from Historic Downtown Ocala, only a few miles from the World Equestrian Center, and minutes from shopping, hospitals, dining, and major highways—making daily living and commuting a breeze. Inside, you’ll find easy-care tile floors throughout, a spacious kitchen ideal for family gatherings, and a functional layout featuring t
Key facts
- Brand new roof
- Spacious kitchen
- 6,098 sq ft lot
Tags
Neighborhood map
What this means for you Summary
Snapshot
- This is a 3-bed/2.0-bath single-family listed at $145k.
Deal economics
- At list price, monthly cash flow is $318 ($4k/yr) — positive.
- The deal already cash-flows at list — no discount required.
- Meets the 1% rule at list price ($2k rent vs $145k).
- Recommended offer: $128k (12.0% below list) — sets the bar for market timing.
- Cap rate 8.9% vs local median 4.2% in Ocala — top-decile yield for the area; either an underpriced asset or a hidden risk that comps aren't pricing in. Stress-test before assuming the spread holds.
Location & tenants
- Location reads 69/100 on livability (#476 in FL) — a middle-class / working-renter tenant base. Strengths: cost of living A+, housing A+, health & safety A+; Watch: crime F, amenities F, commute F.
- Marion (rural): math 42% / reading 43% proficiency, ranked #61 of 73 in FL (top 84%) — families likely to look elsewhere, expect single-tenant / working-renter base with shorter leases; 61% free/reduced lunch — lower-income household profile, screen leases tightly.
- Zoned schools: Dr N H Jones Elementary School (math 81% / reading 81%, grade A+, #95 of 2,144 statewide, top 5%, 807 students, 38% FRL); Forest High School (math 36% / reading 54%, grade D-, #228 of 667 statewide, top 35%, 2,325 students, 42% FRL) — zoned schools average 40% FRL vs 61% district-wide (21 pts lower); this property's tenant base skews higher-income than the district average.
- Zoned-school proficiency averages 63% at this address vs 42% district-wide (+20 pts) — the actual schools serving this property are materially stronger than the Marion average implies; a family-tenant draw the district grade alone would hide.
- Market conditions: Rents soft (-0.6%/yr); 311 active listings in the ZIP; 18 comparable units currently listed for rent nearby; rentals at typical pace (median 15d on market — plan ~3-4 weeks tenant-placement turnaround); 7,071 units permitted in Marion County in 2024 (534 in 5+ unit buildings).
Forward outlook
- Local home prices are declining (-3.0%/yr); year-one equity from $1k of loan paydown is wiped out by about $4k of value loss. Plan a longer hold.
- Marion County population projected at +13% by 2050 — modest demand growth; plan on rents tracking national, not racing it.
Negotiation context
- It's been on market 129 days — a 12% lower offer ($128k) is reasonable based on typical stale-listing flexibility.
- 4 sale attempts since 4y ago; this cycle's ask has dropped $15k (9%) from the opening price — seller is motivated, your offer sets the floor, not the list.
- Current owner paid $56k; list at $145k implies a 159% gain — meaningful room to come down on a strong offer.
Risks & watch-outs
- Watch-outs: built in 1958 — expect roof / HVAC / electrical / plumbing capex.
- Climate carrying-cost: severe wind risk, 99% chance of damaging wind over 30y; extreme-heat days projected 7→22/yr by 2055 (HVAC capex compounding) — expect insurance premiums to compound above CPI over the hold.
Questions for the listing agent
- It's been on market 129 days. Have you received any prior offers? Is the seller open to a 12% concession, seller financing, or rate buy-down credit?
- Built in 1958 — when were the roof, HVAC, electrical panel, plumbing, and water heater last replaced?
- Why hasn't it sold? Are there any deal-killer items the seller is aware of (foundation, flood, title, zoning, code violations)?
- Is there a deadline driving the sale (1031 exchange, divorce, estate, relocation)? That informs how much negotiation room exists.
- Crime grade is F in this area — have there been break-ins, vandalism, or insurance claims at this property in the last 3 years? What carrier currently insures it and at what premium?
- What's the average days-on-market for RENTAL listings here right now (not sales)? A rising rental-DOM trend means longer vacancies and softer asking-rent achievability than the comps imply.
- What's the recent tenant-quality profile in this submarket — average credit score on applications, eviction rate, late-payment / NSF rate, and stable-employment percentage? A property-management company in the area should have these aggregated.
- How much new for-sale + rental construction is in the pipeline within 1–3 miles? Heavy new supply typically softens prices + rents 12–24 months out; constrained supply supports both.
Investment metrics
- 1% rule
- 1.10% ✓
- Cap rate
- 8.93%
- Cash-on-cash
- 9.40%
- DSCR
- 1.42
- GRM
- 7.5
CMA / ARV
- ARV (on-the-fly)
- $171,600
- Comps found
- 3
Show comp detail 3 sales within ~0.75 mi
| Address | Dist | Beds/Ba | Sqft | Sold | Price | $/sf | Match |
|---|---|---|---|---|---|---|---|
| 1937 SW 5 St | 0.26mi | 3/2.0 | 1,056 (+2%) | 9mo | $181,000 | $171 | 78 |
| 2023 NW 2nd St | 0.44mi | 3/2.0 | 1,092 (+5%) | 16mo | $145,000 | $133 | 58 |
| 807 NW 1st St | 0.54mi | 3/2.0 | 1,152 (+11%) | 23mo | $190,000 | $165 | 38 |
Match score weights: distance 35% · size 25% · config 20% · recency 20%. Top-matched comps best support the ARV.
Projected returns pro-forma
-3.0% appreciation · 0.0% rent growth · sell at horizon
- IRR
- -5.4%
- Equity multiple
- 0.80×
- Total profit
- $-7,938
- Equity at exit
- $21,605
- IRR
- 0.4%
- Equity multiple
- 1.02×
- Total profit
- $986
- Equity at exit
- $12,528
Cash invested: $40,572 (down + closing). Projections, not guarantees.
Landlord ↔ Tenant lean methodology
- Overall (STATE)
- 87 Strongly Landlord-Friendly
- State Florida
- 87 Strongly Landlord-Friendly · R+3
- County
- — inherits STATE
- City
- — inherits STATE
ZIP-level market 34471
- Rents YoY
- -0.6%
- Active inventory
- 311
- Price-to-rent
- 7.5×
Monthly cashflow live
- Estimated rent
- $1,601 high interval (Pro) →
- Mortgage (P&I)
- −$760
- Tax from tax record
- −$127 /mo · $1,519/yr
- Insurance
- −$60
- HOA
- −$0
- Vacancy / Maint / Mgmt
- −$336
- Net cashflow
- $318
Break-even live
Sensitivity live
| Price | -10% $400 | -5% $359 | +0% $318 | +5% $277 | +10% $236 |
|---|---|---|---|---|---|
| Rent | -10% $191 | -5% $255 | +0% $318 | +5% $381 | +10% $444 |
| Rate | -1.0pp $391 | -0.5pp $355 | base $318 | +0.5pp $280 | +1.0pp $242 |
UW: 25.0% down · 7.5% · 30yr · 1.5% tax · 5.0% vac · 8.0% maint · 8.0% mgmt
Financing live
Cash to close
- Down payment
- $36,225
- Closing costs
- $4,347
- Reserves months
- —
- Total cash needed
- —
Loan-product check · same deal, 3 products live
Conventional
25% down · 7.5% · 30yr
- Down + closing
- —
- Monthly P&I
- —
- Monthly cashflow
- —
- DSCR
- —
- Eligible?
- —
Personal DTI + credit; lowest rate.
DSCR
20% down · 8.5% · 30yr
- Down + closing
- —
- Monthly P&I
- —
- Monthly cashflow
- —
- DSCR
- —
- Eligible?
- —
No personal income docs; deal must DSCR.
Hard money
10% down · 12.0% · 12mo
- Down + closing
- —
- Monthly P&I
- —
- Monthly cashflow
- —
- DSCR
- —
- Eligible?
- —
Short-term bridge; refi at stabilization.
Rent comps 18 comps
| Address | Beds | Baths | Sqft | Rent | $/sqft | DOM | Units | Dist |
|---|---|---|---|---|---|---|---|---|
| 708 SW 20th Ave Ocala, FL | 2.0 | 1.0 | 700 | $999 | $1.43 | 22d | 1 | 0.39mi |
| 2006 SW 7th St Ocala, FL | 2.0 | 1.0 | 700 | $1,050 | $1.50 | 22d | 1 | 0.40mi |
| 717 W Silver Springs Pl Ocala, FL | 3.0 | 2.0 | 1000 | $1,445 | $1.45 | 14d | 1 | 0.56mi |
| 714 NW 1st St Ocala, FL | 3.0 | 2.0 | 1444 | $2,200 | $1.52 | 14d | 1 | 0.58mi |
| 1911 NW 6th St Ocala, FL | 3.0 | 1.0 | 877 | $1,400 | $1.60 | 14d | 1 | 0.60mi |
| 346 NW 24th Ave Ocala, FL | 3.0 | 2.0 | 1206 | $1,500 | $1.24 | 14d | 1 | 0.76mi |
| 1421 SW 27th Ave Ocala, FL | 2.0–4.0 | 1.0–2.0 | 1228 | $1,489 | $1.21 | 14d | 19 | 1.00mi |
| 1140 NW 20th Ave Ocala, FL | 4.0 | 1.0 | 1144 | $1,550 | $1.35 | 22d | 1 | 1.04mi |
| 1908 NW 13th Pl Ocala, FL | 3.0 | 1.0 | 1000 | $1,325 | $1.32 | 22d | 1 | 1.09mi |
| 1601 SW 27th Ave Ocala, FL | 1.0–2.0 | 1.0–2.0 | 754 | $1,357 | $1.80 | 14d | 18 | 1.10mi |
| 302 SE Broadway St #460 Ocala, FL | 2.0 | 2.0 | 1500 | $3,000 | $2.00 | 22d | 1 | 1.20mi |
| 900 SE 3rd Ave Ocala, FL | 2.0–3.0 | 2.0 | 1160 | $2,325 | $2.00 | 14d | 4 | 1.20mi |
| 1602 NW 20th Ct Ocala, FL | 3.0 | 2.0 | 1223 | $1,500 | $1.23 | 14d | 1 | 1.33mi |
| 510 SE 11th St Unit 510-D Ocala, FL | 2.0 | 1.0 | 925 | $995 | $1.08 | 14d | 1 | 1.38mi |
| 715 NE 3rd St Ocala, FL | 2.0 | 1.0 | 850 | $1,475 | $1.74 | 14d | 1 | 1.45mi |
| 339 NE Sanchez Ave Unit 111 Ocala, FL | 3.0 | 3.0 | 1422 | $1,649 | $1.16 | 22d | 1 | 1.47mi |
| 710 NE 4th St Unit 101 Ocala, FL | 3.0 | 3.0 | 1422 | $1,575 | $1.11 | 22d | 1 | 1.47mi |
| 580 SW 23rd Pl Unit 2330-3 Ocala, FL | 2.0 | 1.0 | 700 | $1,399 | $2.00 | 22d | 1 | 1.49mi |
Listing history 13 events
-
2026-03-12status Pending
-
2026-01-23price $144,900
-
2025-12-24status Active
-
2025-12-19status Pending
-
2025-12-04status Active
-
2025-11-06status Pending
-
2025-11-04price $149,900
-
2025-10-01$159,900 Active
-
2022-12-23soldstatus $56,000
-
2022-10-28historical
-
2022-10-22price $112,000
-
2022-10-15price $119,950
-
2022-10-13$129,000 Active
ⓘ Source: listings_history table (triggers on properties + properties_extension) + one-shot
backfill from property_details.listing_events for pre-trigger history.
Tax reassessment forecast FL · Resets to sale price
- Current annual tax
- $1,519 · $127/mo
- Projected year-2 tax
- $1,519 · $127/mo
- Expected delta
- $0/yr ($0/mo · 0.0%)
ⓘ Screening estimate from a state-policy table — verify with the county assessor before closing.
Climate risk First Street
- Flood 1/10 Low FEMA zone X (unshaded) · 0% chance over 30 yrs
- Wildfire 3/10 Moderate
- Heat 8/10 Severe 7 d/yr ≥107°F today · 22 d/yr by 30 yrs out
- Wind 9/10 Extreme 99% chance of damaging wind over 30 yrs
- Air quality 3/10 Moderate 3 unhealthy d/yr today · 3 by 30 yrs out
Nearby sold comps map
Loading sold comps map…
Walkable amenities ~0.75 mi
Loading nearby amenities…
Taxation est. · year 1
- Rental income
- $19,210
- − Mortgage interest
- −$8,117
- − Property taxes
- −$1,519
- − Insurance
- −$724
- − Repairs & maintenance
- −$1,537
- − Management
- −$1,537
- − Depreciation
- −$4,215
- Taxable income
- $1,561
- Est. tax owed @ 24.0%
- −$375
- After-tax cash flow
- $3,439/yr
For passive investors: Depreciation is non-cash, so a rental often shows a tax loss while cash-flowing — sheltering income. Rental losses are passive: they offset passive income freely, and up to $25,000/yr can offset ordinary (W-2) income if you actively participate and your MAGI is under $100k (phasing out to $0 by $150k); unused losses carry forward. On sale, claimed depreciation is recaptured at up to 25%, and gains may owe capital-gains tax (a 1031 exchange can defer both). Figures are a year-1 estimate at your 24.0% rate — not tax advice; consult a CPA.
Schools (NCES district)
- District
- Marion
- NCES district ID
- 1201260
- Math proficiency
- 42% ▼ -7.00%
- Reading proficiency
- 43% ▼ -4.00%
- Median HH income
- $40,015
- Composite
- 35.61/100
- National rank
- #4890
- State rank
- #61 of 73 in FL
Livability — Ocala
- Score
- 69/100
- State rank
- #476
- US rank
- #8461
Category grades
Schools grade is shown separately in the Schools card above.
Census & demographics
- Census place
- Ocala, FL
- County
- Marion County · 315,796 people
- City population
- 263,375
- Metro
- Ocala, FL
- Population (ZIP)
- 28,342
- Household income
- $65,789
- Rent vs Own
- Severe rent burden
- 1494.0
Population outlook (Marion County) Hauer SSP2
- Today (2025)
- 365,905 people
- By 2030
- 376,768 · +3.0%
- By 2040
- 396,555 · +8.4%
- By 2050
- 412,723 · +12.8%
- By 2075
- 446,090 · +21.9%
- By 2100
- 436,193 · +19.2%
Race, ethnicity, and origin ACS 2023
- Neighborhood character
- Predominantly White (67%)
- Race & ethnicity
- White 67% Hispanic / Latino 16% Two or more races 11% Black 10% Asian 3%
- Hispanic origin (detail)
- Mexican 2% Puerto Rican 6% Cuban 3% Dominican 1%
- Common ancestry
- Slovak 3% Italian 2% Lithuanian 2%
- Foreign-born
- 9% · Canada, Jamaica, Dominican Republic
- Languages at home
- 86% English-only · Spanish 11% Other Asian/Pacific 1%
Political lean MEDSL · Marion
- 2024 margin
- Solid R (+31.6) · D 33.8% · R 65.5%
- 2008→2024 swing
- -20.0pp toward R · 2008: -11.6pp · 2024: -31.6pp
- All cycles
- 2024: R+31.6 2020: R+25.9 2016: R+26.2 2012: R+16.2 2008: R+11.6
Not yet ingested
- Civics
- —
Market trends
- HPI YoY
- ▼ -176.55%
- Current HPI
- 224.1709
- Rent YoY
- ▼ -0.64%
- Metro
- Ocala, FL
- State GDP YoY
- ▲ 3.28%
- F500 in state
- 36
Industry mix (Fortune 500 HQ in FL)
| Industry | F500 HQs | Revenue |
|---|---|---|
| Industrial Technology | 2 | $29B |
|
||
| Insurance | 2 | $17B |
|
||
| Retail | 1 | $60B |
|
||
| Technology Distribution | 1 | $58B |
|
||
| Homebuilding | 1 | $35B |
|
||
| Technology Manufacturing | 1 | $35B |
|
||
Price history
+12.3% since first listed13 events — show timeline
- 2026-03-12 Pending — Stellar MLS as Distributed by MLS Grid
- 2026-01-23 Price Changed $144,900 Stellar MLS as Distributed by MLS Grid
- 2025-12-24 Relisted — Stellar MLS as Distributed by MLS Grid
- 2025-12-19 Pending — Stellar MLS as Distributed by MLS Grid
- 2025-12-04 Relisted — Stellar MLS as Distributed by MLS Grid
- 2025-11-06 Pending — Stellar MLS as Distributed by MLS Grid
- 2025-11-04 Price Changed $149,900 Stellar MLS as Distributed by MLS Grid
- 2025-10-01 Listed $159,900 Stellar MLS as Distributed by MLS Grid
- 2022-12-23 Sold (Public Records) $56,000 Public Records
- 2022-10-28 Listing Removed — Stellar MLS as Distributed by MLS Grid
- 2022-10-22 Price Changed $112,000 Stellar MLS as Distributed by MLS Grid
- 2022-10-15 Price Changed $119,950 Stellar MLS as Distributed by MLS Grid
- 2022-10-13 Listed $129,000 Stellar MLS as Distributed by MLS Grid
Property tax history
+16.7%/yrLatest (2025): $1,519 · +1.0% YoY. Source: county tax records.
Cash-flow waterfall
monthlySold comps — $/sqft
last 12 mo · ≤1 miLoading sold comps…