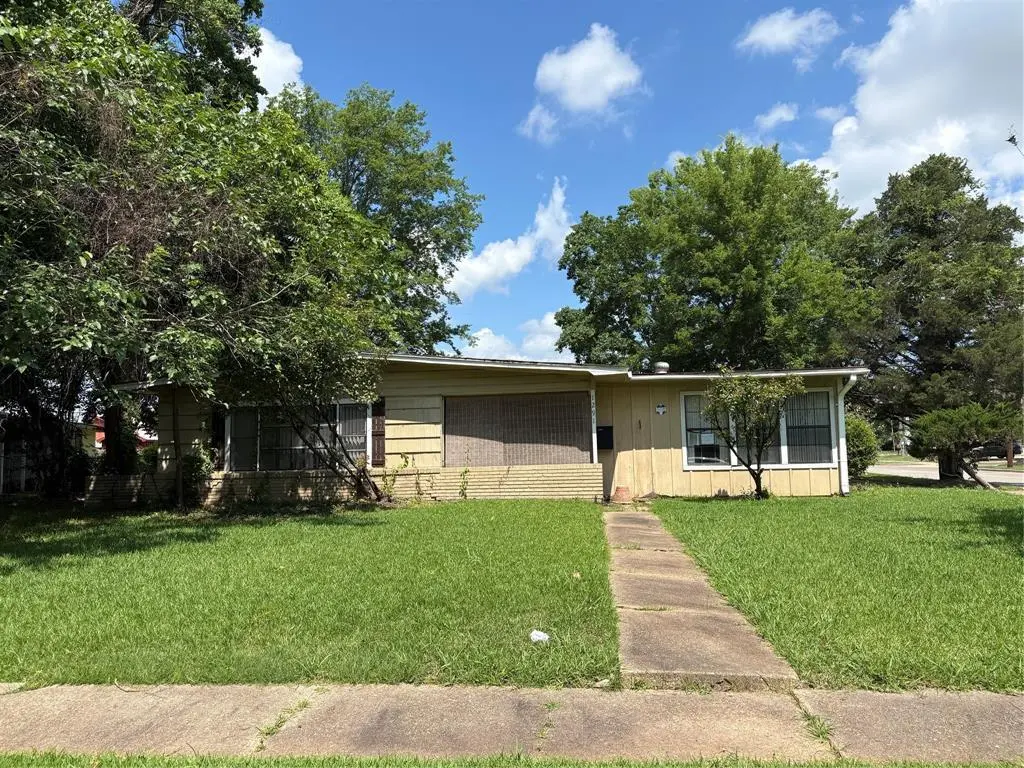
1291 Mark Ave · Bossier City, LA
Flood risk 4/10 · Minor
- FEMA flood zone
- X (unshaded)
- Chance of flooding over 30 yrs
- 0.2%
- Est. flood insurance / yr
- $507 – $1,088
Fire risk 1/10 · Minimal
- Est. fire insurance / yr
- $1,269 – $2,357
Heat risk 7/10 · Major
- Hot days now (above 111°F)
- 7 days/yr
- Hot days in 30 yrs
- 22 days/yr
Wind risk 6/10 · Moderate
- Chance of severe wind over 30 yrs
- 66.0%
Air-quality risk 2/10 · Minimal
- Unhealthy air days now
- 1 days/yr
- Unhealthy air days in 30 yrs
- 2 days/yr
Risk factors via First Street. Map © Google.
Why this score? — see what drove the B+ grade
The composite is a weighted blend of 9 inputs, each scored 0–100. Each bar is that input's sub-score; the figure is the points it added to the 100-point composite (weight × sub-score).
- Cash flow +30.0/30.0
- ARV discount +15.0/15.0
- 1% rule +10.0/10.0
- DSCR +10.0/10.0
- Schools +3.8/10.0
- Livability +3.6/5.0
- Rent growth +3.4/5.0
- Condition / age +2.5/5.0
- Appreciation +0.0/10.0
$61,000
🖨 Deal sheet (PDF) 📄 Offer letter ✓ Due diligence
Listing remarks
Opportunity meets potential in this spacious 3-bedroom, 1-bath home situated on a desirable corner lot. Inside, you’ll find a comfortable layout featuring both a welcoming living room and a separate den, offering flexible spaces for relaxing, entertaining, or everyday living. The utility room provides added convenience and functionality, while the outside storage building offers extra room for tools, equipment, or hobbies. The attached two-car carport adds covered parking and easy access to the home. With its generous layout, multiple living areas, and prime corner location, this property presents a great chance to make it your own and create the space you’ve been looking for. C
Key facts
- Utility room
- Separate den
- Corner lot
Tags
Property features AI
Finance
- Other: County: Bossier; Country: United States; Geocode confidence: High
- Financial info: No second mortgage reported; Loan type listed as 'Treat As Clear'; Property offered as real estate owned
- HOA & community: No association
Exterior
- Parking: Attached carport; Two covered/carport spaces
- Utilities: City water; City sewer; Not in a municipal utility district
- Home design: Single-family residence; One story; Accessible features with grip
- Construction: Built in 1952; Brick and wood construction
- Exterior features: Lot under 0.5 acre (about 0.238 acres); Subdivision: Waller Sub; Directions: GPS
Interior
- Kitchen: Dishwasher
- Bedrooms: Three bedrooms (primary bedroom on main level)
- Flooring: Carpet; Ceramic tile
- Bathrooms: One full bathroom
- Heating & cooling: Central heating; Central air conditioning
- Interior features: High-speed internet available; Two living areas; One dining area; Two total rooms (additional to bedrooms/living areas)
- Laundry & utility: Utility room
Neighborhood map
What this means for you Summary
Snapshot
- This is a 3-bed/1.0-bath single-family listed at $61k.
Deal economics
- At list price, monthly cash flow is $745 ($9k/yr) — positive.
- The deal already cash-flows at list — no discount required.
- Meets the 1% rule at list price ($1k rent vs $61k).
- Recommended offer: $60k (1.5% below list) — sets the bar for market timing.
- Cap rate 21.0% vs local median 4.7% in Bossier City — top-decile yield for the area; either an underpriced asset or a hidden risk that comps aren't pricing in. Stress-test before assuming the spread holds.
Location & tenants
- Location reads 71/100 on livability (#47 in LA) — a middle-class / working-renter tenant base. Strengths: commute A+, cost of living A+, housing A+; Watch: employment D+, crime F, amenities F.
- Bossier Parish (urban): math 40% / reading 47% proficiency, ranked #17 of 98 in LA (top 17%) — families likely to look elsewhere, expect single-tenant / working-renter base with shorter leases.
- Zoned schools: Bossier Elementary School (math 8% / reading 17%, grade F, #550 of 646 statewide, top 88%, 222 students, 93% FRL); Rusheon Middle School (math 7% / reading 13%, grade F, #199 of 218 statewide, top 92%, 600 students, 86% FRL); Bossier High School (math 12% / reading 27%, grade F, #186 of 265 statewide, top 73%, 719 students, 85% FRL) — zoned schools average 88% FRL vs 41% district-wide (47 pts higher); higher-poverty schools than district average — tighter screening recommended.
- Zoned-school proficiency averages 14% at this address vs 44% district-wide (-30 pts) — the specific schools serving this property underperform the Bossier Parish average; the district grade overstates school quality for this exact location.
- Market conditions: Rents rising (+3.6%/yr); 147 active listings in the ZIP; 19 comparable units currently listed for rent nearby; rentals at typical pace (median 23d on market — plan ~3-4 weeks tenant-placement turnaround); 716 units permitted in Bossier Parish in 2024 (0 in 5+ unit buildings).
Forward outlook
- Local home prices are declining (-3.0%/yr); year-one equity from $422 of loan paydown is wiped out by about $2k of value loss. Plan a longer hold.
- Bossier County population projected at +28% by 2050 — long-run rental-demand tailwind backs the buy-and-hold thesis.
- At projected returns (-3.0% appreciation + 3.6% rent growth), your $17k cash investment doubles in ~3 years — after that, you're playing with house money.
Negotiation context
- It's been on market 15 days — a 2% lower offer ($60k) is reasonable based on typical stale-listing flexibility.
Risks & watch-outs
- Watch-outs: built in 1952 — expect roof / HVAC / electrical / plumbing capex.
- Climate carrying-cost: major wind risk, 66% chance of damaging wind over 30y; extreme-heat days projected 7→22/yr by 2055 (HVAC capex compounding) — expect insurance premiums to compound above CPI over the hold.
Questions for the listing agent
- Built in 1952 — when were the roof, HVAC, electrical panel, plumbing, and water heater last replaced?
- Is there a deadline driving the sale (1031 exchange, divorce, estate, relocation)? That informs how much negotiation room exists.
- Schools are B-rated — typically a magnet for longer-tenancy family renters. What's the average tenant stay here, and is there a school-zone premium baked into asking?
- Crime grade is F in this area — have there been break-ins, vandalism, or insurance claims at this property in the last 3 years? What carrier currently insures it and at what premium?
- What's the average days-on-market for RENTAL listings here right now (not sales)? A rising rental-DOM trend means longer vacancies and softer asking-rent achievability than the comps imply.
- What's the recent tenant-quality profile in this submarket — average credit score on applications, eviction rate, late-payment / NSF rate, and stable-employment percentage? A property-management company in the area should have these aggregated.
- How much new for-sale + rental construction is in the pipeline within 1–3 miles? Heavy new supply typically softens prices + rents 12–24 months out; constrained supply supports both.
Investment metrics
- 1% rule
- 2.29% ✓
- Cap rate
- 20.96%
- Cash-on-cash
- 52.37%
- DSCR
- 3.33
- GRM
- 3.6
CMA / ARV
- ARV (on-the-fly)
- $113,525
- Comps found
- 12
Show comp detail 12 sales within ~0.75 mi
| Address | Dist | Beds/Ba | Sqft | Sold | Price | $/sf | Match |
|---|---|---|---|---|---|---|---|
| 1126 Patricia Dr | 0.26mi | 3/1.0 | 1,205 (+1%) | 11mo | $142,000 | $118 | 77 |
| 3208 Jana Pl | 0.22mi | 3/1.0 | 1,295 (+8%) | 10mo | $122,900 | $95 | 67 |
| 3259 Sarah St | 0.30mi | 3/1.5 | 1,130 (-5%) | 11mo | $154,500 | $137 | 66 |
| 2531 Hoyer St | 0.45mi | 3/2.0 | 1,211 (+1%) | 10mo | $39,900 | $33 | 64 |
| 1245 Dudley Ln | 0.48mi | 3/1.0 | 1,096 (-8%) | 8mo | $89,900 | $82 | 57 |
| 1405 Fullilove Dr | 0.33mi | 3/1.5 | 1,331 (+11%) | 10mo | $40,000 | $30 | 55 |
| 2545 Lamar St | 0.33mi | 2/1.0 (-1) | 1,051 (-12%) | 7mo | $99,900 | $95 | 54 |
| 2914 Bobbie St | 0.75mi | 3/1.0 | 1,216 (+2%) | 10mo | $145,000 | $119 | 54 |
| 3001 Jamie Pl | 0.53mi | 3/1.0 | 1,320 (+10%) | 5mo | $165,000 | $125 | 53 |
| 3105 Donald Dr | 0.59mi | 2/1.0 (-1) | 1,250 (+5%) | 8mo | $60,000 | $48 | 53 |
| 1140 Waller Ave | 0.51mi | 2/2.0 (-1) | 1,288 (+8%) | 3mo | $32,000 | $25 | 51 |
| 3001 Oliver St | 0.63mi | 3/1.0 | 1,094 (-8%) | 10mo | $125,000 | $114 | 48 |
Match score weights: distance 35% · size 25% · config 20% · recency 20%. Top-matched comps best support the ARV.
Projected returns pro-forma
-3.0% appreciation · 3.6% rent growth · sell at horizon
- IRR
- 51.0%
- Equity multiple
- 3.25×
- Total profit
- $38,424
- Equity at exit
- $9,095
- IRR
- 56.6%
- Equity multiple
- 6.74×
- Total profit
- $98,043
- Equity at exit
- $5,274
Cash invested: $17,080 (down + closing). Projections, not guarantees.
Landlord ↔ Tenant lean methodology
- Overall (STATE)
- 90 Strongly Landlord-Friendly
- State Louisiana
- 90 Strongly Landlord-Friendly · R+12
- County
- — inherits STATE
- City
- — inherits STATE
ZIP-level market 71112
- Rents YoY
- 3.6%
- Active inventory
- 147
- Price-to-rent
- 3.6×
Monthly cashflow live
- Estimated rent
- $1,396 high interval (Pro) →
- Mortgage (P&I)
- −$320
- Tax from tax record
- −$12 /mo · $147/yr
- Insurance
- −$25
- HOA
- −$0
- Vacancy / Maint / Mgmt
- −$293
- Net cashflow
- $745
Break-even live
Sensitivity live
| Price | -10% $780 | -5% $763 | +0% $745 | +5% $728 | +10% $711 |
|---|---|---|---|---|---|
| Rent | -10% $635 | -5% $690 | +0% $745 | +5% $801 | +10% $856 |
| Rate | -1.0pp $776 | -0.5pp $761 | base $745 | +0.5pp $730 | +1.0pp $714 |
UW: 25.0% down · 7.5% · 30yr · 1.5% tax · 5.0% vac · 8.0% maint · 8.0% mgmt
Financing live
Cash to close
- Down payment
- $15,250
- Closing costs
- $1,830
- Reserves months
- —
- Total cash needed
- —
Loan-product check · same deal, 3 products live
Conventional
25% down · 7.5% · 30yr
- Down + closing
- —
- Monthly P&I
- —
- Monthly cashflow
- —
- DSCR
- —
- Eligible?
- —
Personal DTI + credit; lowest rate.
DSCR
20% down · 8.5% · 30yr
- Down + closing
- —
- Monthly P&I
- —
- Monthly cashflow
- —
- DSCR
- —
- Eligible?
- —
No personal income docs; deal must DSCR.
Hard money
10% down · 12.0% · 12mo
- Down + closing
- —
- Monthly P&I
- —
- Monthly cashflow
- —
- DSCR
- —
- Eligible?
- —
Short-term bridge; refi at stabilization.
Rent comps 19 comps
| Address | Beds | Baths | Sqft | Rent | $/sqft | DOM | Units | Dist |
|---|---|---|---|---|---|---|---|---|
| 3204 McGregor St Bossier City, LA | 3.0 | 1.0 | 1093 | $1,350 | $1.24 | 45d | 1 | 0.08mi |
| 3202 Jana Pl Bossier City, LA | 3.0 | 1.0 | 1258 | $1,250 | $0.99 | 45d | 1 | 0.18mi |
| 1140 Schex Dr Bossier City, LA | 3.0 | 1.0 | 1346 | $1,500 | $1.11 | 23d | 1 | 0.35mi |
| 1148 Dudley Ln Bossier City, LA | 3.0 | 1.0 | 1013 | $925 | $0.91 | 15d | 1 | 0.43mi |
| 1231 Waller Ave Bossier City, LA | 3.0 | 1.0 | 1500 | $1,100 | $0.73 | 45d | 1 | 0.55mi |
| 1416 Williamsburg Dr Bossier City, LA | 2.0 | 2.0 | 960 | $1,200 | $1.25 | 15d | 1 | 0.58mi |
| 1120 Margaret St Bossier City, LA | 2.0 | 1.0 | 950 | $1,200 | $1.26 | 23d | 1 | 0.58mi |
| 1301 Williamsburg Dr Bossier City, LA | 1.0–3.0 | 1.0–2.0 | 1025 | $1,655 | $1.61 | 15d | 28 | 0.62mi |
| 1302 Williamsburg Dr Bossier City, LA | 1.0–3.0 | 1.0–2.0 | 1050 | $1,720 | $1.64 | 23d | 14 | 0.64mi |
| 3115 Oliver St Bossier City, LA | 3.0 | 1.5 | 1067 | $1,400 | $1.31 | 15d | 1 | 0.72mi |
| 3406 Black Lake Cir Bossier City, LA | 3.0 | 1.0 | 1400 | $1,200 | $0.86 | 23d | 1 | 0.75mi |
| 400 John Wesley Blvd Bossier City, LA | 2.0 | 1.5 | 935 | $842 | $0.90 | 15d | 2 | 0.81mi |
| 2248 Loreco St Bossier City, LA | 3.0 | 2.0 | 1073 | $1,400 | $1.30 | 45d | 1 | 0.82mi |
| 2201 Naples St Bossier City, LA | 2.0 | 1.0 | 759 | $775 | $1.02 | 45d | 1 | 0.94mi |
| 305 Orleans St Bossier City, LA | 2.0 | 1.5 | 1021 | $1,000 | $0.98 | 23d | 1 | 0.96mi |
| 205 Royal St Bossier City, LA | 2.0 | 1.5 | 1100 | $1,100 | $1.00 | 45d | 1 | 0.99mi |
| 4056 Beech St Bossier City, LA | 4.0 | 1.0 | 1391 | $1,400 | $1.01 | 23d | 1 | 1.10mi |
| 100 Crossroads Blvd Bossier City, LA | 1.0–2.0 | 1.0–2.0 | 858 | $1,299 | $1.51 | 45d | 1 | 1.33mi |
| 1535 River Parkway Blvd Shreveport, LA | 1.0–3.0 | 1.0–2.0 | 928 | $2,042 | $2.20 | 15d | 10 | 1.46mi |
Listing history 11 events
-
2026-06-13status $61,000 Pending 15 DOM
-
2026-06-10days on market $61,000 Active 15 DOM
-
2026-06-09days on market $61,000 Active 14 DOM
-
2026-06-08days on market $61,000 Active 13 DOM
-
2026-06-07days on market $61,000 Active 12 DOM
-
2026-06-02days on market $61,000 Active 7 DOM
-
2026-06-01days on market $61,000 Active 6 DOM
-
2026-05-31days on market $61,000 Active 5 DOM
-
2026-05-30days on market $61,000 Active 4 DOM
-
2026-05-26$61,000 Active
-
2004-07-30soldstatus
ⓘ Source: listings_history table (triggers on properties + properties_extension) + one-shot
backfill from property_details.listing_events for pre-trigger history.
Tax reassessment forecast LA · Resets to sale price
- Current annual tax
- $147 · $12/mo
- Projected year-2 tax
- $336 · $28/mo
- Expected delta
- +$189/yr (+$16/mo · 128.9%)
ⓘ Screening estimate from a state-policy table — verify with the county assessor before closing.
Climate risk First Street
- Flood 4/10 Moderate FEMA zone X (unshaded) · 20% chance over 30 yrs
- Wildfire 1/10 Low
- Heat 7/10 Severe 7 d/yr ≥111°F today · 22 d/yr by 30 yrs out
- Wind 6/10 Major 66% chance of damaging wind over 30 yrs
- Air quality 2/10 Low 1 unhealthy d/yr today · 2 by 30 yrs out
Nearby sold comps map
Loading sold comps map…
Walkable amenities ~0.75 mi
Loading nearby amenities…
Taxation est. · year 1
- Rental income
- $16,754
- − Mortgage interest
- −$3,417
- − Property taxes
- −$147
- − Insurance
- −$305
- − Repairs & maintenance
- −$1,340
- − Management
- −$1,340
- − Depreciation
- −$1,775
- Taxable income
- $8,430
- Est. tax owed @ 24.0%
- −$2,023
- After-tax cash flow
- $6,922/yr
For passive investors: Depreciation is non-cash, so a rental often shows a tax loss while cash-flowing — sheltering income. Rental losses are passive: they offset passive income freely, and up to $25,000/yr can offset ordinary (W-2) income if you actively participate and your MAGI is under $100k (phasing out to $0 by $150k); unused losses carry forward. On sale, claimed depreciation is recaptured at up to 25%, and gains may owe capital-gains tax (a 1031 exchange can defer both). Figures are a year-1 estimate at your 24.0% rate — not tax advice; consult a CPA.
Schools (NCES district)
- District
- Bossier Parish
- NCES district ID
- 2200270
- Math proficiency
- 40% ▼ -32.00%
- Reading proficiency
- 47% ▼ -28.00%
- Median HH income
- $51,326
- Composite
- 37.5/100
- National rank
- #4402
- State rank
- #17 of 98 in LA
Livability — Bossier City
- Score
- 71/100
- State rank
- #47
- US rank
- #7044
Category grades
Schools grade is shown separately in the Schools card above.
Census & demographics
- Census place
- Bossier City, LA
- County
- Bossier Parish · 98,704 people
- City population
- 91,925
- Metro
- Shreveport-Bossier City, LA
- Population (ZIP)
- 33,587
- Household income
- $61,760
- Rent vs Own
- Severe rent burden
- 1391.0
Population outlook (Bossier County) Hauer SSP2
- Today (2025)
- 143,247 people
- By 2030
- 151,802 · +6.0%
- By 2040
- 168,194 · +17.4%
- By 2050
- 183,533 · +28.1%
- By 2075
- 217,009 · +51.5%
- By 2100
- 230,091 · +60.6%
Race, ethnicity, and origin ACS 2023
- Neighborhood character
- Diverse neighborhood (Simpson 0.57)
- Race & ethnicity
- White 59% Black 24% Hispanic / Latino 12% Two or more races 8% Asian 2%
- Hispanic origin (detail)
- Mexican 9%
- Common ancestry
- Lithuanian 2% Slovak 1% Scottish 1%
- Foreign-born
- 5% · Canada, Vietnam
- Languages at home
- 89% English-only · Spanish 7% Other Indo-European 1% Tagalog/Filipino 1%
Political lean MEDSL · Bossier
- 2024 margin
- Solid R (+43.3) · D 27.7% · R 71.0% · Other 1.3%
- 2008→2024 swing
- +0.3pp no change · 2008: -43.7pp · 2024: -43.3pp
- All cycles
- 2024: R+43.3 2020: R+41.0 2016: R+45.8 2012: R+45.4 2008: R+43.7
Not yet ingested
- Civics
- —
Market trends
- HPI YoY
- ▼ -77.48%
- Current HPI
- 127.9821
- Rent YoY
- ▲ 3.60%
- Metro
- Shreveport-Bossier City, LA
- State GDP YoY
- ▲ 3.29%
- F500 in state
- 10
Industry mix (Fortune 500 HQ in LA)
| Industry | F500 HQs | Revenue |
|---|---|---|
| Telecommunications | 2 | $23B |
|
||
| Utilities | 1 | $12B |
|
||
| Wholesale / Distribution | 1 | $5B |
|
||
| Advertising | 1 | $2B |
|
||
Price history
2 events — show timeline
- 2026-05-26 Listed $61,000 NTREIS
- 2004-07-30 Sold (Public Records) — Public Records
Property tax history
-0.0%/yrLatest (2023): $147 · -1.5% YoY. Source: county tax records.
Cash-flow waterfall
monthlySold comps — $/sqft
last 12 mo · ≤1 miLoading sold comps…