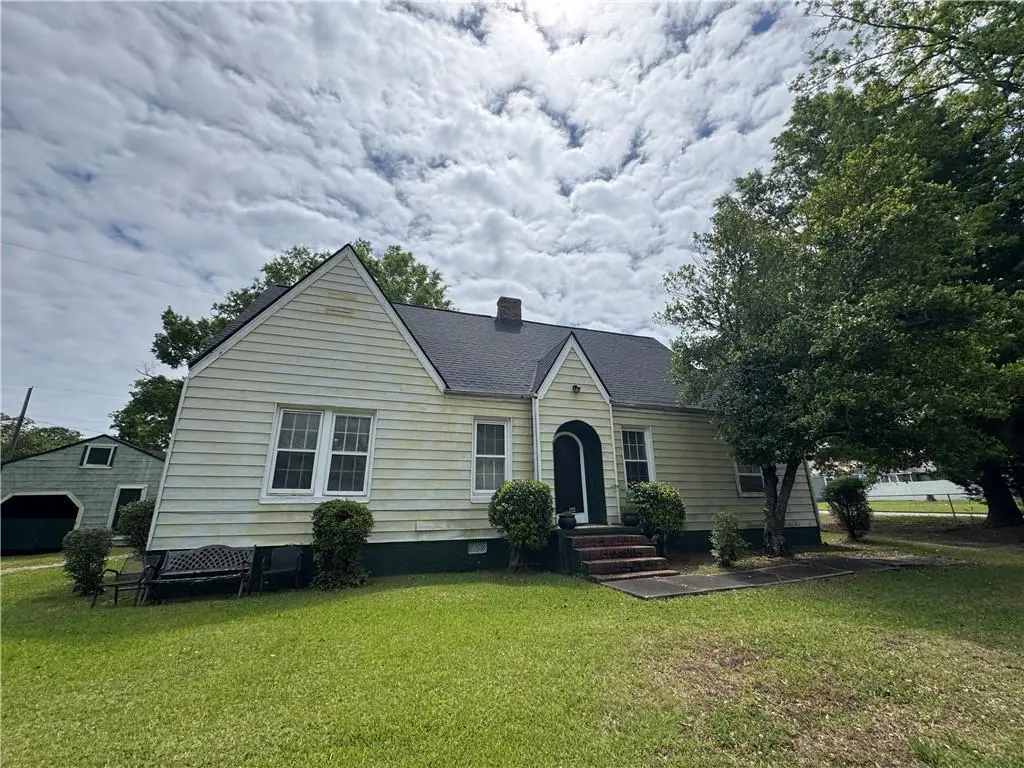
718 N Hill St · Griffin, GA
Flood risk 1/10 · Minimal
- FEMA flood zone
- X (unshaded)
- Chance of flooding over 30 yrs
- 0.0%
- Est. flood insurance / yr
- $507 – $1,088
Fire risk 2/10 · Minimal
- Est. fire insurance / yr
- $963 – $1,789
Heat risk 6/10 · Moderate
- Hot days now (above 105°F)
- 7 days/yr
- Hot days in 30 yrs
- 18 days/yr
Wind risk 6/10 · Moderate
- Chance of severe wind over 30 yrs
- 43.0%
Air-quality risk 4/10 · Minor
- Unhealthy air days now
- 4 days/yr
- Unhealthy air days in 30 yrs
- 5 days/yr
Risk factors via First Street. Map © Google.
Why this score? — see what drove the B- grade
The composite is a weighted blend of 9 inputs, each scored 0–100. Each bar is that input's sub-score; the figure is the points it added to the 100-point composite (weight × sub-score).
- Cash flow +30.0/30.0
- DSCR +10.0/10.0
- 1% rule +8.7/10.0
- ARV discount +7.5/15.0
- Rent growth +3.3/5.0
- Livability +2.7/5.0
- Condition / age +2.5/5.0
- Schools +1.4/10.0
- Appreciation +0.0/10.0
$99,000
🖨 Deal sheet (PDF) 📄 Offer letter ✓ Due diligence
Listing remarks MLS
Investor Alert! High-Potential Flip or Rental in Griffin. Don't miss this spacious 1940s classic situated on a prime corner lot. Featuring a massive 2,119-square-foot footprint, this home includes 4 large bedrooms, an additional nursery/office space, 2 bathrooms, and a valuable detached garage. Located just minutes from downtown Griffin and local amenities, this property offers incredible bones and a substantial layout for a creative renovation. Priced to move quickly-perfect for building immediate equity in a strong rental and resale market.
Key facts
- Prime corner lot
- Creative renovation
- Substantial layout
Tags
Property features AI
Exterior
- Parking: Detached garage with 1 garage space
- Utilities: Public water; Public sewer; Cable available; Electricity available; Other utilities
- Home design: Two levels; Resale property
- Construction: Brick and HardiPlank-style exterior; Shingle roof; Brick/mortar foundation; Built with conventional construction materials
- Exterior features: Rear porch
Interior
- Kitchen: No specific kitchen features listed
- Bedrooms: One bedroom on the main level; Three bedrooms on the upper level; Bedroom features: Other
- Flooring: Carpet; Laminate; Wood
- Bathrooms: Two full bathrooms; One full bathroom on the main level; One full bathroom on the upper level; Master bathroom features: Other
- Heating & cooling: Window unit(s) for cooling; Other heating; Other electric
- Interior features: One fireplace located in the family room; No shared/common walls; Den, Dining Room, Family Room, Kitchen; Other interior features
- Laundry & utility: Laundry features: Other
Neighborhood map
What this means for you Summary
Snapshot
- This is a 3-bed/2.0-bath single-family listed at $99k.
Deal economics
- At list price, monthly cash flow is $455 ($5k/yr) — positive.
- The deal already cash-flows at list — no discount required.
- Meets the 1% rule at list price ($1k rent vs $99k).
- Recommended offer: $98k (1.5% below list) — sets the bar for market timing.
- Cap rate 11.8% vs local median 4.3% in Griffin — top-decile yield for the area; either an underpriced asset or a hidden risk that comps aren't pricing in. Stress-test before assuming the spread holds.
Location & tenants
- Location reads 54/100 on livability (#529 in GA) — a working-class tenant base; expect higher turnover. Strengths: cost of living A+, housing A+; Watch: crime F, amenities F, commute F.
- Griffin-Spalding County (suburban): math 13% / reading 19% proficiency, ranked #151 of 174 in GA (top 87%) — low school quality limits family demand, transient renter base, plan for 1-2y turnover; 68% free/reduced lunch — lower-income household profile, screen leases tightly.
- Zoned schools: Moore Elementary School (math 2% / reading 2%, grade F, #1,204 of 1,228 statewide, top 100%, 386 students, 98% FRL); Kennedy Road Middle School (math 11% / reading 20%, grade F, #392 of 470 statewide, top 84%, 477 students, 98% FRL); Spalding High School (math 11% / reading 25%, grade F, #258 of 424 statewide, top 62%, 1,252 students, 67% FRL) — zoned schools average 88% FRL vs 68% district-wide (20 pts higher); higher-poverty schools than district average — tighter screening recommended.
- Market conditions: Rents rising (+3.3%/yr); 440 active listings in the ZIP; 6 comparable units currently listed for rent nearby; rentals at typical pace (median 21d on market — plan ~3-4 weeks tenant-placement turnaround); 342 units permitted in Spalding County in 2024 (0 in 5+ unit buildings).
Forward outlook
- Local home prices are declining (-3.0%/yr); year-one equity from $684 of loan paydown is wiped out by about $3k of value loss. Plan a longer hold.
- Spalding County population projected at -15% by 2050 — secular population decline; favor cash flow + early exit over multi-decade hold.
- At projected returns (-3.0% appreciation + 3.3% rent growth), your $28k cash investment doubles in ~7 years — after that, you're playing with house money.
Negotiation context
- It's been on market 30 days — a 2% lower offer ($98k) is reasonable based on typical stale-listing flexibility.
- 2 sale attempts; this cycle's ask has dropped $21k (18%) from the opening price — seller is motivated, your offer sets the floor, not the list.
- Current owner paid $40k; list at $99k implies a 144% gain — meaningful room to come down on a strong offer.
Risks & watch-outs
- Watch-outs: built in 1940 — expect roof / HVAC / electrical / plumbing capex.
- Climate carrying-cost: major wind risk, 43% chance of damaging wind over 30y; extreme-heat days projected 7→18/yr by 2055 (HVAC capex compounding) — expect insurance premiums to compound above CPI over the hold.
Questions for the listing agent
- Built in 1940 — when were the roof, HVAC, electrical panel, plumbing, and water heater last replaced?
- Is there a deadline driving the sale (1031 exchange, divorce, estate, relocation)? That informs how much negotiation room exists.
- Schools are F-rated, which usually means shorter tenancies and higher turnover. Who's the typical renter profile here, and what's been the actual vacancy rate?
- Crime grade is F in this area — have there been break-ins, vandalism, or insurance claims at this property in the last 3 years? What carrier currently insures it and at what premium?
- What's the average days-on-market for RENTAL listings here right now (not sales)? A rising rental-DOM trend means longer vacancies and softer asking-rent achievability than the comps imply.
- What's the recent tenant-quality profile in this submarket — average credit score on applications, eviction rate, late-payment / NSF rate, and stable-employment percentage? A property-management company in the area should have these aggregated.
- How much new for-sale + rental construction is in the pipeline within 1–3 miles? Heavy new supply typically softens prices + rents 12–24 months out; constrained supply supports both.
Investment metrics
- 1% rule
- 1.37% ✓
- Cap rate
- 11.81%
- Cash-on-cash
- 19.69%
- DSCR
- 1.88
- GRM
- 6.1
CMA / ARV
- ARV (on-the-fly)
- $256,399
- Comps found
- 5
Show comp detail 5 sales within ~0.75 mi
| Address | Dist | Beds/Ba | Sqft | Sold | Price | $/sf | Match |
|---|---|---|---|---|---|---|---|
| 117 W Lexington Ave | 0.25mi | 4/1.5 (+1) | 2,145 (+1%) | 23mo | $260,000 | $121 | 60 |
| 125 W Lexington Ave | 0.29mi | 4/3.0 (+1) | 2,334 (+10%) | 5mo | $243,000 | $104 | 57 |
| 520 E Quilly St | 0.60mi | 3/2.5 | 2,100 (-1%) | 20mo | $270,000 | $129 | 52 |
| 526 E Quilly St | 0.61mi | 3/2.5 | 2,100 (-1%) | 20mo | $280,000 | $133 | 52 |
| 208 W Chappell St | 0.56mi | 4/2.0 (+1) | 1,936 (-9%) | 16mo | $162,000 | $84 | 41 |
Match score weights: distance 35% · size 25% · config 20% · recency 20%. Top-matched comps best support the ARV.
Projected returns pro-forma
-3.0% appreciation · 3.34% rent growth · sell at horizon
- IRR
- 12.1%
- Equity multiple
- 1.48×
- Total profit
- $13,369
- Equity at exit
- $14,761
- IRR
- 21.3%
- Equity multiple
- 2.83×
- Total profit
- $50,783
- Equity at exit
- $8,560
Cash invested: $27,720 (down + closing). Projections, not guarantees.
Landlord ↔ Tenant lean methodology
- Overall (STATE)
- 90 Strongly Landlord-Friendly
- State Georgia
- 90 Strongly Landlord-Friendly · R+3
- County
- — inherits STATE
- City
- — inherits STATE
ZIP-level market 30223
- Rents YoY
- 3.3%
- Active inventory
- 440
- Price-to-rent
- 6.1×
Monthly cashflow live
- Estimated rent
- $1,358 high interval (Pro) →
- Mortgage (P&I)
- −$519
- Tax from tax record
- −$57 /mo · $687/yr
- Insurance
- −$41
- HOA
- −$0
- Vacancy / Maint / Mgmt
- −$285
- Net cashflow
- $455
Break-even live
Sensitivity live
| Price | -10% $511 | -5% $483 | +0% $455 | +5% $427 | +10% $399 |
|---|---|---|---|---|---|
| Rent | -10% $348 | -5% $401 | +0% $455 | +5% $508 | +10% $562 |
| Rate | -1.0pp $505 | -0.5pp $480 | base $455 | +0.5pp $429 | +1.0pp $403 |
UW: 25.0% down · 7.5% · 30yr · 1.5% tax · 5.0% vac · 8.0% maint · 8.0% mgmt
Financing live
Cash to close
- Down payment
- $24,750
- Closing costs
- $2,970
- Reserves months
- —
- Total cash needed
- —
Loan-product check · same deal, 3 products live
Conventional
25% down · 7.5% · 30yr
- Down + closing
- —
- Monthly P&I
- —
- Monthly cashflow
- —
- DSCR
- —
- Eligible?
- —
Personal DTI + credit; lowest rate.
DSCR
20% down · 8.5% · 30yr
- Down + closing
- —
- Monthly P&I
- —
- Monthly cashflow
- —
- DSCR
- —
- Eligible?
- —
No personal income docs; deal must DSCR.
Hard money
10% down · 12.0% · 12mo
- Down + closing
- —
- Monthly P&I
- —
- Monthly cashflow
- —
- DSCR
- —
- Eligible?
- —
Short-term bridge; refi at stabilization.
Rent comps 6 comps
| Address | Beds | Baths | Sqft | Rent | $/sqft | DOM | Units | Dist |
|---|---|---|---|---|---|---|---|---|
| 117 Realty St Griffin, GA | 3.0 | 1.0 | 1928 | $999 | $0.52 | 26d | 1 | 0.06mi |
| 126 W Lexington Ave Griffin, GA | 3.0 | 2.5 | 2146 | $1,596 | $0.74 | 7d | 1 | 0.23mi |
| 502 W Broadway St Griffin, GA | 1.0–2.0 | 1.0–2.0 | 1133 | $1,745 | $1.54 | 0d | 17 | 0.64mi |
| 205 W Broadway St Griffin, GA | 4.0 | 2.0 | 1884 | $1,650 | $0.88 | 20d | 1 | 0.65mi |
| 615 N 17th St Griffin, GA | 3.0 | 2.0 | 1504 | $1,300 | $0.86 | 21d | 1 | 0.99mi |
| 217 S 11 St Unit A Griffin, GA | 3.0 | 1.0 | 1763 | $1,150 | $0.65 | 0d | 1 | 1.03mi |
Listing history 16 events
-
2026-06-21days on market $99,000 Active 30 DOM
-
2026-06-18days on market $99,000 Active 27 DOM
-
2026-06-17days on market $99,000 Active 26 DOM
-
2026-06-16days on market $99,000 Active 25 DOM
-
2026-06-15days on market $99,000 Active 24 DOM
-
2026-06-13pricedays on market $99,000 Active 22 DOM
-
2026-06-09days on market $120,000 Active 18 DOM
-
2026-06-08days on market $120,000 Active 17 DOM
-
2026-06-07days on market $120,000 Active 16 DOM
-
2026-06-04days on market $120,000 Active 13 DOM
-
2026-06-03days on market $120,000 Active 12 DOM
-
2026-06-02days on market $120,000 Active 11 DOM
-
2026-06-01days on market $120,000 Active 10 DOM
-
2026-05-31days on market $120,000 Active 9 DOM
-
2026-05-22$120,000 Active
Show marketing remark (548 chars)
Investor Alert! High-Potential Flip or Rental in Griffin. Don't miss this spacious 1940s classic situated on a prime corner lot. Featuring a massive 2,119-square-foot footprint, this home includes 4 large bedrooms, an additional nursery/office space, 2 bathrooms, and a valuable detached garage. Located just minutes from downtown Griffin and local amenities, this property offers incredible bones and a substantial layout for a creative renovation. Priced to move quickly-perfect for building immediate equity in a strong rental and resale market.
-
1994-09-16soldstatus $40,500
ⓘ Source: listings_history table (triggers on properties + properties_extension) + one-shot
backfill from property_details.listing_events for pre-trigger history.
Tax reassessment forecast GA · Resets to sale price
- Current annual tax
- $687 · $57/mo
- Projected year-2 tax
- $911 · $76/mo
- Expected delta
- +$223/yr (+$19/mo · 32.5%)
ⓘ Screening estimate from a state-policy table — verify with the county assessor before closing.
Climate risk First Street
- Flood 1/10 Low FEMA zone X (unshaded) · 0% chance over 30 yrs
- Wildfire 2/10 Low
- Heat 6/10 Major 7 d/yr ≥105°F today · 18 d/yr by 30 yrs out
- Wind 6/10 Major 43% chance of damaging wind over 30 yrs
- Air quality 4/10 Moderate 4 unhealthy d/yr today · 5 by 30 yrs out
Nearby sold comps map
Loading sold comps map…
Walkable amenities ~0.75 mi
Loading nearby amenities…
Taxation est. · year 1
- Rental income
- $16,291
- − Mortgage interest
- −$5,546
- − Property taxes
- −$687
- − Insurance
- −$495
- − Repairs & maintenance
- −$1,303
- − Management
- −$1,303
- − Depreciation
- −$2,880
- Taxable income
- $4,077
- Est. tax owed @ 24.0%
- −$978
- After-tax cash flow
- $4,479/yr
For passive investors: Depreciation is non-cash, so a rental often shows a tax loss while cash-flowing — sheltering income. Rental losses are passive: they offset passive income freely, and up to $25,000/yr can offset ordinary (W-2) income if you actively participate and your MAGI is under $100k (phasing out to $0 by $150k); unused losses carry forward. On sale, claimed depreciation is recaptured at up to 25%, and gains may owe capital-gains tax (a 1031 exchange can defer both). Figures are a year-1 estimate at your 24.0% rate — not tax advice; consult a CPA.
Schools (NCES district)
- District
- Griffin-Spalding County
- NCES district ID
- 1302520
- Math proficiency
- 13% ▼ -13.00%
- Reading proficiency
- 19% ▼ -12.00%
- Median HH income
- $40,895
- Composite
- 13.71/100
- National rank
- #9496
- State rank
- #151 of 174 in GA
Livability — Griffin
- Score
- 54/100
- State rank
- #529
- US rank
- #23746
Category grades
Schools grade is shown separately in the Schools card above.
Census & demographics
- Census place
- Griffin, GA
- County
- Spalding County · 66,676 people
- City population
- 28,414
- Metro
- Atlanta-Sandy Springs-Alpharetta, GA
- Population (ZIP)
- 38,262
- Household income
- $59,054
- Rent vs Own
- Severe rent burden
- 1297.0
Population outlook (Spalding County) Hauer SSP2
- Today (2025)
- 63,015 people
- By 2030
- 61,689 · -2.1%
- By 2040
- 57,932 · -8.1%
- By 2050
- 53,474 · -15.1%
- By 2075
- 43,228 · -31.4%
- By 2100
- 32,290 · -48.8%
Race, ethnicity, and origin ACS 2023
- Neighborhood character
- Diverse neighborhood (Simpson 0.59)
- Race & ethnicity
- White 50% Black 38% Hispanic / Latino 7% Two or more races 5% Asian 1%
- Hispanic origin (detail)
- Mexican 5%
- Common ancestry
- Slovak 1% Serbian 1%
- Foreign-born
- 4% · Canada, South Korea
- Languages at home
- 92% English-only · Spanish 6% Korean 1%
Political lean MEDSL · Spalding
- 2024 margin
- R (+16.7) · D 41.4% · R 58.1%
- 2008→2024 swing
- +2.1pp toward D · 2008: -18.8pp · 2024: -16.7pp
- All cycles
- 2024: R+16.7 2020: R+20.8 2016: R+24.2 2012: R+20.0 2008: R+18.8
Not yet ingested
- Civics
- —
Market trends
- HPI YoY
- ▼ -142.92%
- Current HPI
- 225.7933
- Rent YoY
- ▲ 3.34%
- Metro
- Atlanta-Sandy Springs-Alpharetta, GA
- State GDP YoY
- ▲ 2.66%
- F500 in state
- 28
Industry mix (Fortune 500 HQ in GA)
| Industry | F500 HQs | Revenue |
|---|---|---|
| Paper / Packaging | 2 | $29B |
|
||
| Retail | 1 | $160B |
|
||
| Transportation / Logistics | 1 | $91B |
|
||
| Airlines | 1 | $62B |
|
||
| Consumer Goods | 1 | $47B |
|
||
| Utilities | 1 | $25B |
|
||
Price history
+144.4% since first listed5 events — show timeline
- 2026-06-10 Price Changed $99,000 GAMLS
- 2026-06-10 Price Changed $99,000 FMLS
- 2026-05-22 Listed $120,000 FMLS
- 2026-05-22 Listed $120,000 GAMLS
- 1994-09-16 Sold (Public Records) $40,500 Public Records
Property tax history
-2.7%/yrLatest (2025): $687 · -2.3% YoY. Source: county tax records.
Cash-flow waterfall
monthlySold comps — $/sqft
last 12 mo · ≤1 miLoading sold comps…