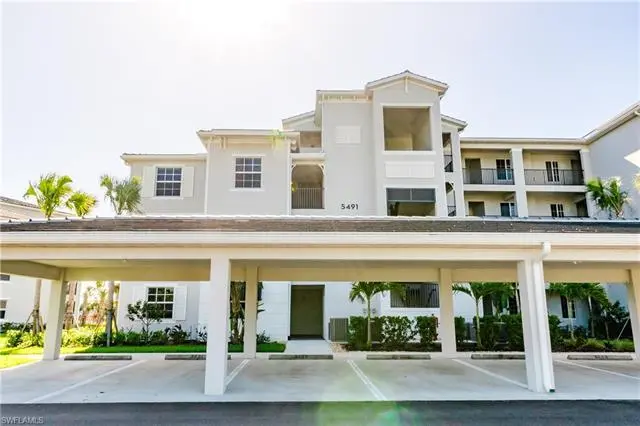
5491 Double Eagle Cir #3728 · Ave Maria, FL
Flood risk 1/10 · Minimal
- FEMA flood zone
- AH
- Chance of flooding over 30 yrs
- 0.0%
- Est. flood insurance / yr
- $1,142 – $2,507
Fire risk 5/10 · Moderate
- Est. fire insurance / yr
- $947 – $1,759
Heat risk 9/10 · Severe
- Hot days now (above 111°F)
- 7 days/yr
- Hot days in 30 yrs
- 27 days/yr
Wind risk 10/10 · Severe
- Chance of severe wind over 30 yrs
- 99.0%
Air-quality risk 2/10 · Minimal
- Unhealthy air days now
- 0 days/yr
- Unhealthy air days in 30 yrs
- 1 days/yr
Risk factors via First Street. Map © Google.
Why this score? — see what drove the C+ grade
The composite is a weighted blend of 9 inputs, each scored 0–100. Each bar is that input's sub-score; the figure is the points it added to the 100-point composite (weight × sub-score).
- ARV discount +15.0/15.0
- Cash flow +14.8/30.0
- 1% rule +9.2/10.0
- Schools +5.0/10.0
- DSCR +4.5/10.0
- Appreciation +4.5/10.0
- Condition / age +4.0/5.0
- Rent growth +3.2/5.0
- Livability +2.5/5.0
$214,947
🖨 Deal sheet (PDF) 📄 Offer letter ✓ Due diligence
Listing remarks
Welcome to this beautifully designed Carolina model featuring 3 bedrooms and 2 bathrooms, located on the second floor in the highly sought-after The National Golf & Country Club. This light-filled residence offers the perfect blend of comfort, style, and resort-style living. Featuring an open-concept floor plan, this home boasts spacious living and dining areas, a modern kitchen with quality finishes, and a private screened lanai—perfect for relaxing and enjoying serene views. The split-bedroom layout provides privacy for both owners and guests, while the primary suite offers generous closet space and a well-appointed bathroom. Enjoy the convenience of low-maintenance living alo
Key facts
- Split-bedroom layout
- Fitness center
- Championship golf
Tags
Neighborhood map
What this means for you Summary
Snapshot
- This is a 3-bed/2.0-bath townhouse listed at $215k. Condition is rated good.
Deal economics
- At list price, monthly cash flow is $-94 ($-1k/yr) — negative.
- To cash-flow at today's rent, offer at most $201k (6.3% below list).
- Meets the 1% rule at list price ($3k rent vs $215k).
- Recommended offer: $201k (6.3% below list) — sets the bar for cash-flow.
Location & tenants
- Location reads: area grade C — affects rentability + tenant quality, not the cash-flow math above.
- Collier (suburban): math 60% / reading 56% proficiency, ranked #16 of 73 in FL (top 22%) — acceptable for families but not a draw, mixed tenant base, ~2y average lease.
- Zoned schools: Estates Elementary School (math 70% / reading 67%, grade B+, #409 of 2,144 statewide, top 20%, 862 students, 53% FRL); Corkscrew Middle School (math 68% / reading 59%, grade B+, #109 of 571 statewide, top 19%, 958 students, 43% FRL); Palmetto Ridge High School (math 43% / reading 51%, grade D-, #207 of 667 statewide, top 32%, 2,347 students, 38% FRL).
- Market conditions: Rents rising (+3.0%/yr); 453 active listings in the ZIP; 40 comparable units currently listed for rent nearby; rentals at typical pace (median 26d on market — plan ~3-4 weeks tenant-placement turnaround); 3,520 units permitted in Collier County in 2024 (959 in 5+ unit buildings).
- At $3,044/mo this rent would consume 59% of the median local household income ($62k/yr) (locally 1093% of renters already pay >50% of income on rent) — very limited rent-growth headroom before tenants either downsize or default.
Forward outlook
- Local home prices are declining (-1.1%/yr); year-one equity from $1k of loan paydown is wiped out by about $2k of value loss. Plan a longer hold.
- Collier County population projected at +30% by 2050 — long-run rental-demand tailwind backs the buy-and-hold thesis.
Negotiation context
- It's been on market 36 days — a 3% lower offer ($208k) is reasonable based on typical stale-listing flexibility.
Risks & watch-outs
- Watch-outs: flood insurance adds $152/mo; HOA is 28% of rent.
- Climate carrying-cost: in FEMA flood zone AH (mandatory federal flood insurance); severe wind risk, 99% chance of damaging wind over 30y; moderate wildfire risk; extreme-heat days projected 7→27/yr by 2055 (HVAC capex compounding) — expect insurance premiums to compound above CPI over the hold.
Questions for the listing agent
- What do current leases actually rent for vs. the listed asking? Can we see a recent rent roll and the last 12 months of T-12 income?
- It's been on market 36 days. Have you received any prior offers? Is the seller open to a 6% concession, seller financing, or rate buy-down credit?
- What's the actual annual flood-insurance premium (NFIP or private), and is the property in a SFHA with mandatory coverage?
- What does the HOA fee cover, when was the last increase, and are there any pending special assessments or reserve-fund shortfalls?
- Is there a deadline driving the sale (1031 exchange, divorce, estate, relocation)? That informs how much negotiation room exists.
- What's the average days-on-market for RENTAL listings here right now (not sales)? A rising rental-DOM trend means longer vacancies and softer asking-rent achievability than the comps imply.
- What's the recent tenant-quality profile in this submarket — average credit score on applications, eviction rate, late-payment / NSF rate, and stable-employment percentage? A property-management company in the area should have these aggregated.
- How much new for-sale + rental construction is in the pipeline within 1–3 miles? Heavy new supply typically softens prices + rents 12–24 months out; constrained supply supports both.
Investment metrics
- 1% rule
- 1.42% ✓
- Cap rate
- 6.62%
- Cash-on-cash
- 1.16%
- DSCR
- 1.05
- GRM
- 5.9
CMA / ARV
- ARV (on-the-fly)
- $342,163
- Comps found
- 1
Show comp detail 1 sale within ~0.75 mi
| Address | Dist | Beds/Ba | Sqft | Sold | Price | $/sf | Match |
|---|---|---|---|---|---|---|---|
| 5555 Double Eagle Cir #3935 | 0.14mi | 2/2.0 (-1) | 1,120 (-14%) | 1mo | $295,000 | $263 | 64 |
Match score weights: distance 35% · size 25% · config 20% · recency 20%. Top-matched comps best support the ARV.
Projected returns pro-forma
-1.05% appreciation · 2.95% rent growth · sell at horizon
- IRR
- -8.5%
- Equity multiple
- 0.63×
- Total profit
- $-22,107
- Equity at exit
- $51,389
- IRR
- -1.4%
- Equity multiple
- 0.87×
- Total profit
- $-7,822
- Equity at exit
- $53,539
Cash invested: $60,185 (down + closing). Projections, not guarantees.
Landlord ↔ Tenant lean methodology
- Overall (STATE)
- 87 Strongly Landlord-Friendly
- State Florida
- 87 Strongly Landlord-Friendly · R+3
- County
- — inherits STATE
- City
- — inherits STATE
ZIP-level market 34142
- Home prices YoY
- -0.5%
- Rents YoY
- 3.0%
- Active inventory
- 453
- Price-to-rent
- 5.9×
Monthly cashflow live
- Estimated rent
- $3,044 high interval (Pro) →
- Mortgage (P&I)
- −$1,127
- Tax est. 1.5%
- −$269 /mo · $3,224/yr
- Insurance
- −$90
- Flood insurance flood zone
- −$152 /mo · $1,824/yr
- HOA
- −$861
- Vacancy / Maint / Mgmt
- −$639
- Net cashflow
- $-94
Break-even live
Sensitivity live
| Price | -10% $55 | -5% $-19 | +0% $-94 | +5% $-168 | +10% $-242 |
|---|---|---|---|---|---|
| Rent | -10% $-334 | -5% $-214 | +0% $-94 | +5% $26 | +10% $147 |
| Rate | -1.0pp $15 | -0.5pp $-39 | base $-94 | +0.5pp $-149 | +1.0pp $-206 |
UW: 25.0% down · 7.5% · 30yr · 1.5% tax · 5.0% vac · 8.0% maint · 8.0% mgmt
Financing live
Cash to close
- Down payment
- $53,737
- Closing costs
- $6,448
- Reserves months
- —
- Total cash needed
- —
Loan-product check · same deal, 3 products live
Conventional
25% down · 7.5% · 30yr
- Down + closing
- —
- Monthly P&I
- —
- Monthly cashflow
- —
- DSCR
- —
- Eligible?
- —
Personal DTI + credit; lowest rate.
DSCR
20% down · 8.5% · 30yr
- Down + closing
- —
- Monthly P&I
- —
- Monthly cashflow
- —
- DSCR
- —
- Eligible?
- —
No personal income docs; deal must DSCR.
Hard money
10% down · 12.0% · 12mo
- Down + closing
- —
- Monthly P&I
- —
- Monthly cashflow
- —
- DSCR
- —
- Eligible?
- —
Short-term bridge; refi at stabilization.
Rent comps 40 comps
| Address | Beds | Baths | Sqft | Rent | $/sqft | DOM | Units | Dist |
|---|---|---|---|---|---|---|---|---|
| 5491 Double Eagle Cir #3728 Ave Maria, FL | 3.0 | 2.0 | 1301 | $2,195 | $1.69 | 16d | 1 | 0.03mi |
| 5479 Double Eagle Cir #3626 Ave Maria, FL | 2.0 | 2.0 | 1154 | $2,200 | $1.91 | 15d | 1 | 0.07mi |
| 5527 Double Eagle Cir Unit 3815 Ave Maria, FL | 2.0 | 2.0 | 1120 | $5,795 | $5.17 | 25d | 1 | 0.08mi |
| 5527 Double Eagle Cir Unit 3838 Ave Maria, FL | 3.0 | 2.0 | 1301 | $2,295 | $1.76 | 25d | 1 | 0.08mi |
| 5454 Double Eagle Cir #3325 Ave Maria, FL | 2.0 | 2.0 | 1355 | $2,495 | $1.84 | 25d | 1 | 0.11mi |
| 5555 Double Eagle Cir #3913 Ave Maria, FL | 2.0 | 2.0 | 1154 | $2,100 | $1.82 | 25d | 1 | 0.13mi |
| 5555 Double Eagle Cir #3914 Ave Maria, FL | 2.0 | 2.0 | 1120 | $5,795 | $5.17 | 25d | 1 | 0.13mi |
| 5555 Double Eagle Cir Unit 3916 Ave Maria, FL | 2.0 | 2.0 | 1154 | $5,950 | $5.16 | 25d | 1 | 0.13mi |
| 5555 Double Eagle Cir #3936 Ave Maria, FL | 2.0 | 2.0 | 1154 | $2,100 | $1.82 | 16d | 1 | 0.13mi |
| 5555 Double Eagle Cir #3918 Ave Maria, FL | 3.0 | 2.0 | 1301 | $5,995 | $4.61 | 25d | 1 | 0.13mi |
| 5478 Double Eagle Cir #3521 Ave Maria, FL | 2.0 | 2.0 | 1569 | $4,995 | $3.18 | 25d | 1 | 0.13mi |
| 5466 Double Eagle Cir #3425 Ave Maria, FL | 2.0 | 2.0 | 1355 | $5,995 | $4.42 | 25d | 1 | 0.17mi |
| 5427 Double Eagle Cir #2822 Ave Maria, FL | 2.0 | 2.0 | 1355 | $5,795 | $4.28 | 25d | 1 | 0.18mi |
| 5445 Double Eagle Cir Ave Maria, FL | 2.0 | 2.0 | 1355 | $2,995 | $2.21 | 25d | 1 | 0.18mi |
| 5427 Double Eagle Cir #2825 Ave Maria, FL | 2.0 | 2.0 | 1355 | $6,295 | $4.65 | 25d | 1 | 0.18mi |
| 5427 Double Eagle Cir #2815 Ave Maria, FL | 2.0 | 2.0 | 1400 | $2,700 | $1.93 | 25d | 1 | 0.18mi |
| 5427 Double Eagle Cir #2826 Ave Maria, FL | 2.0 | 2.0 | 1569 | $6,495 | $4.14 | 25d | 1 | 0.18mi |
| 5478 Double Eagle Cir #3515 Ave Maria, FL | 2.0 | 2.0 | 1355 | $2,395 | $1.77 | 25d | 1 | 0.18mi |
| 5445 Double Eagle Cir #3026 Ave Maria, FL | 2.0 | 2.0 | 1569 | $2,350 | $1.50 | 23d | 1 | 0.19mi |
| 5445 Double Eagle Cir #3013 Ave Maria, FL | 2.0 | 2.0 | 1366 | $2,595 | $1.90 | 23d | 1 | 0.19mi |
| 5583 Double Eagle Cir Ave Maria, FL | 2.0 | 2.0 | 1239 | $2,495 | $2.01 | 25d | 1 | 0.19mi |
| 5583 Double Eagle Cir #4137 Ave Maria, FL | 2.0 | 2.0 | 1154 | $5,795 | $5.02 | 23d | 1 | 0.21mi |
| 5583 Double Eagle Cir Unit 4143 Ave Maria, FL | 2.0 | 2.0 | 1120 | $5,795 | $5.17 | 25d | 1 | 0.21mi |
| 5583 Double Eagle Cir #4135 Ave Maria, FL | 2.0 | 2.0 | 1120 | $2,195 | $1.96 | 25d | 1 | 0.21mi |
| 5583 Double Eagle Cir Unit 4118 Ave Maria, FL | 3.0 | 2.0 | 1301 | $4,700 | $3.61 | 25d | 1 | 0.21mi |
| 5433 Double Eagle Cir Ave Maria, FL | 2.0 | 2.0 | 1366 | $3,295 | $2.41 | 25d | 1 | 0.22mi |
| 5376 Fancourt Links Way Ave Maria, FL | 2.0 | 2.5 | 1850 | $6,850 | $3.70 | 23d | 1 | 0.23mi |
| 5433 Double Eagle Cir #2915 Ave Maria, FL | 2.0 | 2.0 | 1366 | $6,295 | $4.61 | 23d | 1 | 0.23mi |
| 5427 Double Eagle Cir #2812 Ave Maria, FL | 2.0 | 2.0 | 1355 | $2,395 | $1.77 | 16d | 1 | 0.24mi |
| 5427 Double Eagle Cir Ave Maria, FL | 2.0 | 2.0 | 1355 | $2,995 | $2.21 | 25d | 1 | 0.24mi |
| 5629 Double Eagle Cir Ave Maria, FL | 2.0 | 2.0 | 1120 | $5,495 | $4.91 | 25d | 1 | 0.25mi |
| 5522 Hampton Links Ct Ave Maria, FL | 2.0 | 2.5 | 1850 | $3,995 | $2.16 | 25d | 1 | 0.26mi |
| 5651 Double Eagle Cir Ave Maria, FL | 2.0 | 2.0 | 1154 | $2,495 | $2.16 | 25d | 1 | 0.27mi |
| 5651 Double Eagle Cir #4318 Ave Maria, FL | 3.0 | 2.0 | 1301 | $2,200 | $1.69 | 23d | 1 | 0.29mi |
| 5651 Double Eagle Cir Unit 1545996P Ave Maria, FL | 2.0 | 2.0 | 1280 | $2,581 | $2.02 | 16d | 1 | 0.29mi |
| 5651 Double Eagle Cir #4323 Ave Maria, FL | 2.0 | 2.0 | 1154 | $5,795 | $5.02 | 23d | 1 | 0.29mi |
| 5428 Double Eagle Cir #2517 Ave Maria, FL | 2.0 | 2.0 | 1355 | $2,695 | $1.99 | 25d | 1 | 0.30mi |
| 5715 Double Eagle Cir Unit 4416 1 Ave Maria, FL | 2.0 | 2.0 | 1154 | $2,300 | $1.99 | 25d | 1 | 0.30mi |
| 5715 Double Eagle Cir Unit 4432AVE Ave Maria, FL | 2.0 | 2.0 | 1283 | $2,495 | $1.94 | 25d | 1 | 0.30mi |
| 5835 Double Eagle Cir Unit 4742 Ave Maria, FL | 2.0 | 2.0 | 1154 | $5,795 | $5.02 | 25d | 1 | 0.31mi |
HOA detail
- Monthly dues
- $861 · $10,332/yr
Listing history 3 events
-
2026-04-22status Pending
-
2026-04-16price $214,947
-
2026-03-17$263,947 Active
ⓘ Source: listings_history table (triggers on properties + properties_extension) + one-shot
backfill from property_details.listing_events for pre-trigger history.
Climate risk First Street
- Flood 1/10 Low FEMA zone AH · 0% chance over 30 yrs
- Wildfire 5/10 Major
- Heat 9/10 Extreme 7 d/yr ≥111°F today · 27 d/yr by 30 yrs out
- Wind 10/10 Extreme 99% chance of damaging wind over 30 yrs
- Air quality 2/10 Low 0 unhealthy d/yr today · 1 by 30 yrs out
Nearby sold comps map
Loading sold comps map…
Walkable amenities ~0.75 mi
Loading nearby amenities…
Taxation est. · year 1
- Rental income
- $36,528
- − Mortgage interest
- −$12,040
- − Property taxes
- −$3,224
- − Insurance
- −$2,899
- − Repairs & maintenance
- −$2,922
- − Management
- −$2,922
- − HOA
- −$10,332
- − Depreciation
- −$6,253
- Taxable loss
- −$4,065
- Est. tax savings @ 24.0%
- +$976
- After-tax cash flow
- $-149/yr
For passive investors: Depreciation is non-cash, so a rental often shows a tax loss while cash-flowing — sheltering income. Rental losses are passive: they offset passive income freely, and up to $25,000/yr can offset ordinary (W-2) income if you actively participate and your MAGI is under $100k (phasing out to $0 by $150k); unused losses carry forward. On sale, claimed depreciation is recaptured at up to 25%, and gains may owe capital-gains tax (a 1031 exchange can defer both). Figures are a year-1 estimate at your 24.0% rate — not tax advice; consult a CPA.
Condition & rehab AI · 12 photos
This beautifully designed Carolina model is in excellent condition with a modern kitchen and spacious bathrooms. The property is located in a highly sought-after community with resort-style living and low-maintenance living.
Value-add opportunities
- Both Painting the exterior and interior walls — Enhances curb appeal and interior aesthetics.
- Both Landscaping improvements — Enhances curb appeal and adds value to the property.
Renovation cost estimate screening
Value-add ROI direction
- Both Painting the exterior and interior walls — Enhances curb appeal and interior aesthetics. ↑
- Both Landscaping improvements — Enhances curb appeal and adds value to the property. ↑
ⓘ Cost ranges are severity-bucket heuristics (US national rule-of-thumb). Get contractor quotes + a written scope before underwriting a rehab budget.
Schools (NCES district)
- District
- Collier
- NCES district ID
- 1200330
- Math proficiency
- 60% ▼ -4.00%
- Reading proficiency
- 56% ▼ -2.00%
- Median HH income
- $58,275
- Composite
- 50.23/100
- National rank
- #1892
- State rank
- #16 of 73 in FL
Livability — Ave Maria
No livability data for this city. (Only ~50 U.S. cities are tracked.)
Census & demographics
- Census place
- Ave Maria, FL
- County
- Collier County · 396,295 people
- Metro
- Naples-Marco Island, FL
- Population (ZIP)
- 35,149
- Household income
- $62,333
- Rent vs Own
- Severe rent burden
- 1093.0
Population outlook (Collier County) Hauer SSP2
- Today (2025)
- 420,858 people
- By 2030
- 450,054 · +6.9%
- By 2040
- 502,232 · +19.3%
- By 2050
- 544,932 · +29.5%
- By 2075
- 627,203 · +49.0%
- By 2100
- 659,015 · +56.6%
Race, ethnicity, and origin ACS 2023
- Neighborhood character
- Majority Hispanic (63%)
- Race & ethnicity
- Hispanic / Latino 63% Two or more races 39% Black 19% White 16% Native American 7%
- Hispanic origin (detail)
- Mexican 43% Puerto Rican 3% Cuban 2% Dominican 1%
- Common ancestry
- Hispanic 8% Slovak 1% Serbian 1%
- Foreign-born
- 32% · Canada, Jamaica
- Languages at home
- 34% English-only · Spanish 53% French/Haitian/Cajun 12%
Political lean MEDSL · Collier
- 2024 margin
- Solid R (+33.1) · D 33.1% · R 66.2%
- 2008→2024 swing
- -10.6pp toward R · 2008: -22.5pp · 2024: -33.1pp
- All cycles
- 2024: R+33.1 2020: R+24.7 2016: R+26.0 2012: R+30.1 2008: R+22.5
Not yet ingested
- Civics
- —
Market trends
- HPI YoY
- ▼ -1.05%
- Current HPI
- 226.9105
- Rent YoY
- ▲ 2.95%
- Metro
- Naples-Marco Island, FL
- State GDP YoY
- ▲ 3.28%
- F500 in state
- 36
Industry mix (Fortune 500 HQ in FL)
| Industry | F500 HQs | Revenue |
|---|---|---|
| Industrial Technology | 2 | $29B |
|
||
| Insurance | 2 | $17B |
|
||
| Retail | 1 | $60B |
|
||
| Technology Distribution | 1 | $58B |
|
||
| Homebuilding | 1 | $35B |
|
||
| Technology Manufacturing | 1 | $35B |
|
||
Price history
-18.6% since first listed3 events — show timeline
- 2026-04-22 Pending — NAPLESMLS
- 2026-04-16 Price Changed $214,947 NAPLESMLS
- 2026-03-17 Listed $263,947 NAPLESMLS
Cash-flow waterfall
monthlySold comps — $/sqft
last 12 mo · ≤1 miLoading sold comps…