 Multi-family
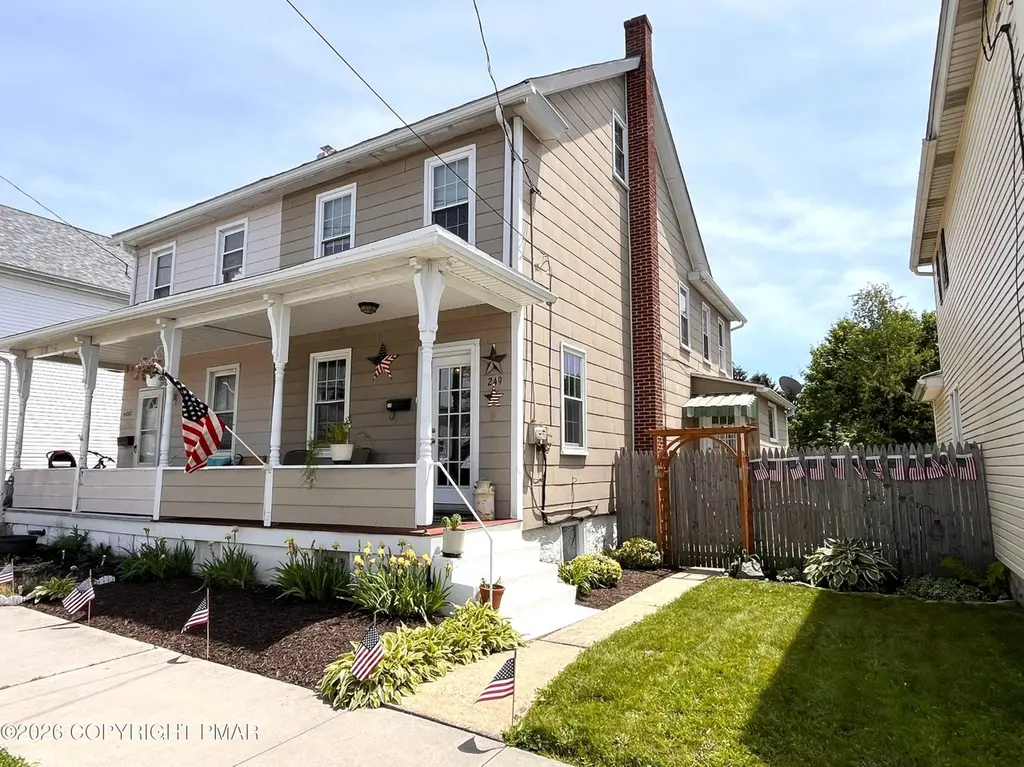
249 W White St · Summit Hill, PA
Flood risk 1/10 · Minimal
- FEMA flood zone
- X (unshaded)
- Chance of flooding over 30 yrs
- 0.0%
- Est. flood insurance / yr
- $507 – $1,088
Fire risk 3/10 · Minor
- Est. fire insurance / yr
- $511 – $949
Heat risk 3/10 · Minor
- Hot days now (above 94°F)
- 7 days/yr
- Hot days in 30 yrs
- 15 days/yr
Wind risk 4/10 · Minor
- Chance of severe wind over 30 yrs
- 9.0%
Air-quality risk 2/10 · Minimal
- Unhealthy air days now
- 1 days/yr
- Unhealthy air days in 30 yrs
- 3 days/yr
Risk factors via First Street. Map © Google.
Why this score? — see what drove the B- grade
The composite is a weighted blend of 9 inputs, each scored 0–100. Each bar is that input's sub-score; the figure is the points it added to the 100-point composite (weight × sub-score).
- Cash flow +30.0/30.0
- 1% rule +10.0/10.0
- DSCR +10.0/10.0
- ARV discount +7.5/15.0
- Livability +3.4/5.0
- Rent growth +2.5/5.0
- Condition / age +2.5/5.0
- Schools +2.0/10.0
- Appreciation +0.0/10.0
$149,900
🖨 Deal sheet (PDF) 📄 Offer letter ✓ Due diligence
Multi-family units
County records classify this as Multi-Family (2-4 Unit). Listing-text estimate: 1 unit. estimate disagrees with records
Listing remarks MLS
Summit Hill 4BD Twin. Nice size rooms. Big back yard. Some rooms freshly painted. Some additional TLC needed. Good investment or starter home. Being sold 'AS IS'
Key facts
- Main living area
- Formal dining room
- Private back yard
Tags
Property features AI
Exterior
- Parking: Garage (1.5 spaces); Carport (1 space); On-street parking
- Utilities: Public water; Public sewer
- Home design: Residential single family residence
- Construction: Asbestos construction material; Asphalt and fiberglass roof
- Exterior features: Private yard; Patio; Porch; Paved road access; Publicly maintained road; City street frontage; Residential zoning
Interior
- Kitchen: Electric oven; Electric range; Refrigerator; Microwave
- Flooring: Carpet; Vinyl
- Bathrooms: 1 full bathroom; 1 half bathroom
- Heating & cooling: Hot water heating; Oil heating; Ceiling fan(s) for cooling
- Interior features: Unfurnished; 7 total rooms
- Laundry & utility: Washer; Dryer
Neighborhood map
What this means for you Summary
Snapshot
- This is a 3-bed/1.0-bath multifamily listed at $150k.
Deal economics
- At list price, monthly cash flow is $3k ($33k/yr) — positive.
- The deal already cash-flows at list — no discount required.
- Meets the 1% rule at list price ($5k rent vs $150k).
Location & tenants
- Location reads 67/100 on livability (#953 in PA) — a middle-class / working-renter tenant base. Strengths: crime A+, cost of living A+; Watch: employment C-, amenities F, commute F.
- Panther Valley SD (rural): math 14% / reading 35% proficiency, ranked #477 of 539 in PA (top 88%) — low school quality limits family demand, transient renter base, plan for 1-2y turnover.
- Zoned schools: Panther Valley El Sch (math 27% / reading 42%, grade F, #1,049 of 1,518 statewide, top 71%, 622 students, 100% FRL); Panther Valley Intermediate Sch (math 11% / reading 31%, grade F, #432 of 512 statewide, top 85%, 417 students, 100% FRL); Panther Valley Jshs (math 13% / reading 36%, grade F, #376 of 437 statewide, top 86%, 771 students, 100% FRL) — zoned schools average 100% FRL vs 52% district-wide (48 pts higher); higher-poverty schools than district average — tighter screening recommended.
- Market conditions: 12 active listings in the ZIP; 15 comparable units currently listed for rent nearby; rentals at typical pace (median 26d on market — plan ~3-4 weeks tenant-placement turnaround); 40% of comp listings sitting > 30 days — soft ceiling on asking rent; 180 units permitted in Carbon County in 2024 (10 in 5+ unit buildings).
Forward outlook
- Local home prices are declining (-3.0%/yr); year-one equity from $1k of loan paydown is wiped out by about $4k of value loss. Plan a longer hold.
- Carbon County population projected at -18% by 2050 — secular population decline; favor cash flow + early exit over multi-decade hold.
- At projected returns (-3.0% appreciation + 3.0% rent growth), your $42k cash investment doubles in ~2 years — after that, you're playing with house money.
Negotiation context
- Only 2 days on market — expect competitive offers; lowballing is unlikely to land.
- 3 sale attempts since 22y ago with the ask held roughly flat each time — persistent listings suggest the price (not the market) is what's stuck; bring a comps-based counter.
- Current owner paid $38k; list at $150k implies a 294% gain — meaningful room to come down on a strong offer.
Risks & watch-outs
- Watch-outs: built in 1881 — expect roof / HVAC / electrical / plumbing capex.
Questions for the listing agent
- Built in 1881 — when were the roof, HVAC, electrical panel, plumbing, and water heater last replaced?
- Is there a deadline driving the sale (1031 exchange, divorce, estate, relocation)? That informs how much negotiation room exists.
- Schools are D-rated, which usually means shorter tenancies and higher turnover. Who's the typical renter profile here, and what's been the actual vacancy rate?
- What's the average days-on-market for RENTAL listings here right now (not sales)? A rising rental-DOM trend means longer vacancies and softer asking-rent achievability than the comps imply.
- What's the recent tenant-quality profile in this submarket — average credit score on applications, eviction rate, late-payment / NSF rate, and stable-employment percentage? A property-management company in the area should have these aggregated.
- How much new apartment / multifamily construction is in the pipeline within 1–3 miles? Heavy new supply (>2% of stock underway) typically softens rents 12–24 months out; light construction supports rent growth.
Investment metrics
- 1% rule
- 3.16% ✓
- Cap rate
- 28.57%
- Cash-on-cash
- 79.56%
- DSCR
- 4.54
- GRM
- 2.6
CMA / ARV
No comps found within radius.
Projected returns pro-forma
-3.0% appreciation · 3.0% rent growth · sell at horizon
- IRR
- 79.7%
- Equity multiple
- 4.64×
- Total profit
- $152,969
- Equity at exit
- $22,351
- IRR
- 83.2%
- Equity multiple
- 9.61×
- Total profit
- $361,523
- Equity at exit
- $12,961
Cash invested: $41,972 (down + closing). Projections, not guarantees.
Landlord ↔ Tenant lean methodology
- Overall (STATE)
- 62 Landlord-Friendly
- State Pennsylvania
- 62 Landlord-Friendly · EVEN
- County
- — inherits STATE
- City
- — inherits STATE
ZIP-level market 18250
- Home prices YoY
- -7.1%
- Active inventory
- 12
- Price-to-rent
- 10.5×
Monthly cashflow live
- Estimated rent
- $4,738 medium interval (Pro) →
- Mortgage (P&I)
- −$786
- Tax from tax record
- −$112 /mo · $1,341/yr
- Insurance
- −$62
- HOA
- −$0
- Vacancy / Maint / Mgmt
- −$995
- Net cashflow
- $2,783
Break-even live
Sensitivity live
| Price | -10% $2,868 | -5% $2,825 | +0% $2,783 | +5% $2,740 | +10% $2,698 |
|---|---|---|---|---|---|
| Rent | -10% $2,408 | -5% $2,596 | +0% $2,783 | +5% $2,970 | +10% $3,157 |
| Rate | -1.0pp $2,858 | -0.5pp $2,821 | base $2,783 | +0.5pp $2,744 | +1.0pp $2,704 |
4-unit breakdown (identical units grouped — click to expand)
| Units | Beds | Baths | Est. rent |
|---|---|---|---|
| 4× units | 4 | 1.5 | $4,736 |
| #1 | 4 | 1.5 | $1,184 |
| #2 | 4 | 1.5 | $1,184 |
| #3 | 4 | 1.5 | $1,184 |
| #4 | 4 | 1.5 | $1,184 |
| Total (4 units) | $4,738 | ||
UW: 25.0% down · 7.5% · 30yr · 1.5% tax · 5.0% vac · 8.0% maint · 8.0% mgmt
Financing live
Cash to close
- Down payment
- $37,475
- Closing costs
- $4,497
- Reserves months
- —
- Total cash needed
- —
Loan-product check · same deal, 3 products live
Conventional
25% down · 7.5% · 30yr
- Down + closing
- —
- Monthly P&I
- —
- Monthly cashflow
- —
- DSCR
- —
- Eligible?
- —
Personal DTI + credit; lowest rate.
DSCR
20% down · 8.5% · 30yr
- Down + closing
- —
- Monthly P&I
- —
- Monthly cashflow
- —
- DSCR
- —
- Eligible?
- —
No personal income docs; deal must DSCR.
Hard money
10% down · 12.0% · 12mo
- Down + closing
- —
- Monthly P&I
- —
- Monthly cashflow
- —
- DSCR
- —
- Eligible?
- —
Short-term bridge; refi at stabilization.
Rent comps 15 comps
| Address | Beds | Baths | Sqft | Rent | $/sqft | DOM | Units | Dist |
|---|---|---|---|---|---|---|---|---|
| 214 N Oak St Summit Hill, PA | 3.0 | 1.0 | 940 | $1,250 | $1.33 | 4d | 1 | 0.34mi |
| 214 N Oak St Unit 2 Summit Hill, PA | 3.0 | 1.0 | 940 | $1,250 | $1.33 | 45d | 1 | 0.34mi |
| 214 N Oak St Unit 2 Summit Hill, PA | 3.0 | 1.0 | 940 | $1,200 | $1.28 | 4d | 1 | 0.34mi |
| 214 N Oak St Unit 2 Summit Hill, PA | 3.0 | 1.0 | 940 | $1,250 | $1.33 | 21d | 1 | 0.34mi |
| 317 E Bertsch St Unit 1 Lansford, PA | 2.0 | 1.0 | 1650 | $1,400 | $0.85 | 45d | 1 | 0.54mi |
| 323 E Bertsch St Unit A-1 Lansford, PA | 2.0 | 1.0 | 1250 | $1,450 | $1.16 | 45d | 1 | 0.54mi |
| 546 E Kline Ave Lansford, PA | 3.0 | 1.0 | 1000 | $900 | $0.90 | 4d | 1 | 0.56mi |
| 10 Leisenring St Lansford, PA | 3.0 | 1.0 | 1422 | $1,100 | $0.77 | 45d | 1 | 0.65mi |
| 149 W Ridge St Unit 2b Lansford, PA | 2.0 | 1.0 | 875 | $1,325 | $1.51 | 25d | 1 | 0.77mi |
| 149 W Ridge St Unit 1A Lansford, PA | 2.0 | 1.0 | 930 | $1,350 | $1.45 | 25d | 1 | 0.77mi |
| 149 W Ridge St Unit 3A Lansford, PA | 3.0 | 1.0 | 1550 | $1,650 | $1.06 | 45d | 1 | 0.77mi |
| 149 W Ridge St Unit 1B Lansford, PA | 3.0 | 1.0 | 1654 | $1,500 | $0.91 | 21d | 1 | 0.77mi |
| 215 E High St Coaldale, PA | 3.0 | 1.0 | 1000 | $1,000 | $1.00 | 23d | 1 | 1.39mi |
| 151 E High St Coaldale, PA | 3.0 | 1.0 | 1312 | $1,200 | $0.91 | 45d | 1 | 1.43mi |
| 126 E High St Coaldale, PA | 4.0 | 1.5 | 1000 | $1,200 | $1.20 | 16d | 1 | 1.46mi |
Listing history 2 events
-
2026-06-07remarks 683-char remark
-
2026-06-07$149,900 Pending 2 DOM
ⓘ Source: listings_history table (triggers on properties + properties_extension) + one-shot
backfill from property_details.listing_events for pre-trigger history.
Tax reassessment forecast PA · Partial reset (capped growth)
- Current annual tax
- $1,341 · $112/mo
- Projected year-2 tax
- $1,855 · $155/mo
- Expected delta
- +$514/yr (+$43/mo · 38.3%)
ⓘ Screening estimate from a state-policy table — verify with the county assessor before closing.
Climate risk First Street
- Flood 1/10 Low FEMA zone X (unshaded) · 0% chance over 30 yrs
- Wildfire 3/10 Moderate
- Heat 3/10 Moderate 7 d/yr ≥94°F today · 15 d/yr by 30 yrs out
- Wind 4/10 Moderate 9% chance of damaging wind over 30 yrs
- Air quality 2/10 Low 1 unhealthy d/yr today · 3 by 30 yrs out
Nearby sold comps map
Loading sold comps map…
Walkable amenities ~0.75 mi
Loading nearby amenities…
Taxation est. · year 1
- Rental income
- $56,856
- − Mortgage interest
- −$8,397
- − Property taxes
- −$1,341
- − Insurance
- −$750
- − Repairs & maintenance
- −$4,548
- − Management
- −$4,548
- − Depreciation
- −$4,361
- Taxable income
- $32,911
- Est. tax owed @ 24.0%
- −$7,899
- After-tax cash flow
- $25,494/yr
For passive investors: Depreciation is non-cash, so a rental often shows a tax loss while cash-flowing — sheltering income. Rental losses are passive: they offset passive income freely, and up to $25,000/yr can offset ordinary (W-2) income if you actively participate and your MAGI is under $100k (phasing out to $0 by $150k); unused losses carry forward. On sale, claimed depreciation is recaptured at up to 25%, and gains may owe capital-gains tax (a 1031 exchange can defer both). Figures are a year-1 estimate at your 24.0% rate — not tax advice; consult a CPA.
Schools (NCES district)
- District
- Panther Valley SD
- NCES district ID
- 4218450
- Math proficiency
- 14% ▼ -7.00%
- Reading proficiency
- 35% ▼ -14.00%
- Median HH income
- $36,914
- Composite
- 20.31/100
- National rank
- #8613
- State rank
- #477 of 539 in PA
Livability — Summit Hill
- Score
- 67/100
- State rank
- #953
- US rank
- #10454
Category grades
Schools grade is shown separately in the Schools card above.
Census & demographics
- Census place
- Summit Hill, PA
- City population
- 3,128
- Population (ZIP)
- 3,128
Population outlook (Carbon County) Hauer SSP2
- Today (2025)
- 61,643 people
- By 2030
- 59,840 · -2.9%
- By 2040
- 55,413 · -10.1%
- By 2050
- 50,843 · -17.5%
- By 2075
- 43,326 · -29.7%
- By 2100
- 37,126 · -39.8%
Race, ethnicity, and origin ACS 2023
- Neighborhood character
- Predominantly White (86%)
- Race & ethnicity
- White 86% Two or more races 12% Hispanic / Latino 9%
- Hispanic origin (detail)
- Puerto Rican 6%
- Common ancestry
- Romanian 5% Iranian 3% Scotch-Irish 3%
- Foreign-born
- 0%
- Languages at home
- 96% English-only · German/W. Germanic 2% Spanish 1% Russian/Polish/Slavic 1%
Political lean MEDSL · Carbon
- 2024 margin
- Solid R (+34.8) · D 32.2% · R 67.0%
- 2008→2024 swing
- -36.7pp toward R · 2008: 1.9pp · 2024: -34.8pp
- All cycles
- 2024: R+34.8 2020: R+32.0 2016: R+34.1 2012: R+6.9 2008: D+1.9
Not yet ingested
- Civics
- —
Market trends
- HPI YoY
- ▼ -14.90%
- Current HPI
- 193.8372
- Rent YoY
- —
- Metro
- —
- State GDP YoY
- ▲ 1.68%
- F500 in state
- 34
Industry mix (Fortune 500 HQ in PA)
| Industry | F500 HQs | Revenue |
|---|---|---|
| Healthcare | 2 | $309B |
|
||
| Insurance | 2 | $27B |
|
||
| Telecommunications / Media | 1 | $124B |
|
||
| Industrial Distribution | 1 | $22B |
|
||
| Financial Services | 1 | $20B |
|
||
| Chemicals / Materials | 1 | $18B |
|
||
Price history
+285.3% since first listed7 events — show timeline
- 2026-06-07 Pending — PMAR
- 2026-06-05 Listed $149,900 PMAR
- 2022-04-18 Listing Removed — GLVRMLS
- 2008-08-15 Sold (Public Records) $38,000 Public Records
- 2008-08-15 Sold (MLS) $38,000 GLVRMLS
- 2008-03-28 Listed $45,000 GLVRMLS
- 2004-07-19 Listed $38,900 GLVRMLS
Property tax history
+2.2%/yrLatest (2026): $1,341 · +3.7% YoY. Source: county tax records.
Cash-flow waterfall
monthlySold comps — $/sqft
last 12 mo · ≤1 miLoading sold comps…