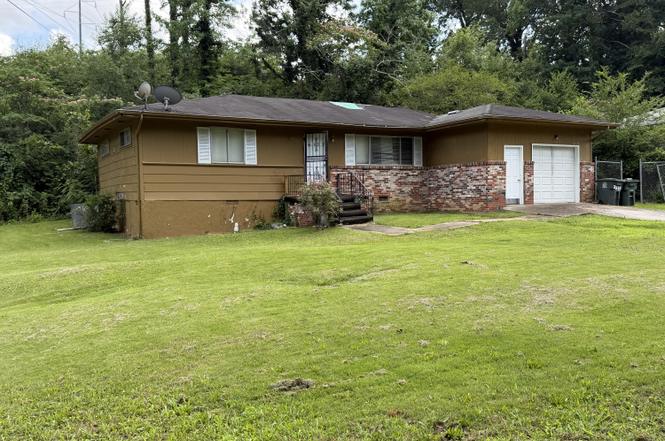
3838 Juandale Dr · Chattanooga, TN
Flood risk 10/10 · Severe
- FEMA flood zone
- X (shaded)
- Chance of flooding over 30 yrs
- 0.99%
- Est. flood insurance / yr
- $507 – $1,088
Fire risk 3/10 · Minor
- Est. fire insurance / yr
- $949 – $1,763
Heat risk 6/10 · Moderate
- Hot days now (above 105°F)
- 7 days/yr
- Hot days in 30 yrs
- 19 days/yr
Wind risk 4/10 · Minor
- Chance of severe wind over 30 yrs
- 10.0%
Air-quality risk 3/10 · Minor
- Unhealthy air days now
- 2 days/yr
- Unhealthy air days in 30 yrs
- 2 days/yr
Risk factors via First Street. Map © Google.
Why this score? — see what drove the B- grade
The composite is a weighted blend of 9 inputs, each scored 0–100. Each bar is that input's sub-score; the figure is the points it added to the 100-point composite (weight × sub-score).
- Cash flow +30.0/30.0
- DSCR +10.0/10.0
- 1% rule +8.9/10.0
- ARV discount +7.5/15.0
- Livability +3.9/5.0
- Rent growth +3.8/5.0
- Schools +2.7/10.0
- Condition / age +2.5/5.0
- Appreciation +0.0/10.0
$104,900
🖨 Deal sheet 📄 Offer letter ✓ Due diligence
Listing remarks
This 2-bedroom, 1.5-bath home, plus a flex room, offers approximately 1,440 sq ft of potential. The property is sold strictly AS-IS. No repairs will be made by the seller. The home requires a full rehab and is priced accordingly. Bring your vision and tools!
Key facts
- 0.36 acre lot
- Garage
- Built 1960
Property features AI
Finance
- Other: Lot approximately 0.36 acres (dimensions approx. 107 x 152)
- Financial info: No investor or detailed financial information provided
- HOA & community: No community amenities (None listed)
Exterior
- Parking: Attached garage (1 car); Driveway; Off-street parking; Garage faces front
- Security: No security details provided
- Utilities: Public water; Public sewer (sewer connected)
- Home design: Single-family residence; One level
- Construction: Built with other/unspecified construction materials; Block foundation
- Exterior features: Other exterior features (not specified); Shingle roof
Interior
- Kitchen: Eat-in kitchen
- Bedrooms: Total of 5 rooms (configuration not specified)
- Flooring: No flooring details provided
- Bathrooms: 1 full bathroom; 1 half bathroom
- Heating & cooling: Central heating; Central electric air conditioning
- Interior features: Eat-in kitchen; Crawl space basement
- Laundry & utility: No specific laundry details provided
Neighborhood map
What this means for you Summary
Snapshot
- This is a 2-bed/1.5-bath single-family listed at $105k.
Deal economics
- At list price, monthly cash flow is $438 ($5k/yr) — positive.
- The deal already cash-flows at list — no discount required.
- Meets the 1% rule at list price ($1k rent vs $105k).
- Cap rate 12.1% vs local median 3.4% in Chattanooga — top-decile yield for the area; either an underpriced asset or a hidden risk that comps aren't pricing in. Stress-test before assuming the spread holds.
Location & tenants
- Location reads 78/100 on livability (#3 in TN, #2,582 nationally) — a middle-class / working-renter tenant base. Strengths: amenities A+, commute A+, cost of living A+; Watch: employment D+, crime F.
- Hamilton County (urban): math 31% / reading 31% proficiency, ranked #42 of 139 in TN (top 30%) — families likely to look elsewhere, expect single-tenant / working-renter base with shorter leases.
- Zoned schools: East Brainerd Elementary (math 39% / reading 35%, grade F, #272 of 952 statewide, top 31%, 1,215 students, 0% FRL); Dalewood Middle School (math 7% / reading 7%, grade F, #278 of 333 statewide, top 85%, 258 students, 0% FRL); Brainerd High School (math 2% / reading 12%, grade F, #294 of 332 statewide, top 91%, 635 students, 0% FRL) — zoned schools average 0% FRL vs 52% district-wide (52 pts lower); this property's tenant base skews higher-income than the district average.
- Zoned-school proficiency averages 17% at this address vs 31% district-wide (-14 pts) — the specific schools serving this property underperform the Hamilton County average; the district grade overstates school quality for this exact location.
- Market conditions: Rents rising fast (+5.1%/yr); 127 active listings in the ZIP; 15 comparable units currently listed for rent nearby; rentals at typical pace (median 24d on market — plan ~3-4 weeks tenant-placement turnaround); lower-income renter base — watch delinquency; 2,133 units permitted in Hamilton County in 2024 (405 in 5+ unit buildings).
Forward outlook
- Local home prices are declining (-3.0%/yr); year-one equity from $725 of loan paydown is wiped out by about $3k of value loss. Plan a longer hold.
- Hamilton County population projected at +23% by 2050 — long-run rental-demand tailwind backs the buy-and-hold thesis.
- At projected returns (-3.0% appreciation + 5.1% rent growth), your $29k cash investment doubles in ~6 years — after that, you're playing with house money.
Negotiation context
- Only 3 days on market — expect competitive offers; lowballing is unlikely to land.
- 2 sale attempts since 25y ago with the ask held roughly flat each time — persistent listings suggest the price (not the market) is what's stuck; bring a comps-based counter.
- Current owner paid $80k; 31% above their basis — modest negotiation headroom, anchor on the comps not their cost.
Risks & watch-outs
- Watch-outs: flood insurance adds $66/mo.
- Climate carrying-cost: severe flood risk; extreme-heat days projected 7→19/yr by 2055 (HVAC capex compounding) — expect insurance premiums to compound above CPI over the hold.
Questions for the listing agent
- Built in 1960 — when were the roof, HVAC, electrical panel, plumbing, and water heater last replaced?
- What's the actual annual flood-insurance premium (NFIP or private), and is the property in a SFHA with mandatory coverage?
- Is there a deadline driving the sale (1031 exchange, divorce, estate, relocation)? That informs how much negotiation room exists.
- Schools are F-rated, which usually means shorter tenancies and higher turnover. Who's the typical renter profile here, and what's been the actual vacancy rate?
- Crime grade is F in this area — have there been break-ins, vandalism, or insurance claims at this property in the last 3 years? What carrier currently insures it and at what premium?
- What's the average days-on-market for RENTAL listings here right now (not sales)? A rising rental-DOM trend means longer vacancies and softer asking-rent achievability than the comps imply.
- What's the recent tenant-quality profile in this submarket — average credit score on applications, eviction rate, late-payment / NSF rate, and stable-employment percentage? A property-management company in the area should have these aggregated.
- How much new for-sale + rental construction is in the pipeline within 1–3 miles? Heavy new supply typically softens prices + rents 12–24 months out; constrained supply supports both.
Investment metrics
- 1% rule
- 1.39% ✓
- Cap rate
- 12.06%
- Cash-on-cash
- 20.60%
- DSCR
- 1.92
- GRM
- 6.0
CMA / ARV
- ARV (on-the-fly)
- $273,600
- Comps found
- 6
Show comp detail 6 sales within ~0.75 mi
| Address | Dist | Beds/Ba | Sqft | Sold | Price | $/sf | Match |
|---|---|---|---|---|---|---|---|
| 2014 Dogwood Dr #21 | 0.27mi | 3/2.0 (+1) | 1,462 (+2%) | 21mo | $165,000 | $113 | 61 |
| 2209 Tunnel Blvd | 0.59mi | 2/1.0 | 1,484 (+3%) | 12mo | $166,000 | $112 | 55 |
| 2234 Doolittle St | 0.40mi | 3/2.0 (+1) | 1,545 (+7%) | 11mo | $285,000 | $184 | 53 |
| 1659 Jeanaga Trl | 0.46mi | 3/2.0 (+1) | 1,524 (+6%) | 14mo | $290,000 | $190 | 50 |
| 1532 Lillian Ln | 0.68mi | 3/1.0 (+1) | 1,352 (-6%) | 22mo | $259,900 | $192 | 32 |
| 1905 Parkway Dr | 0.54mi | 3/2.5 (+1) | 1,267 (-12%) | 22mo | $250,000 | $197 | 27 |
Match score weights: distance 35% · size 25% · config 20% · recency 20%. Top-matched comps best support the ARV.
Projected returns pro-forma
-3.0% appreciation · 5.13% rent growth · sell at horizon
- IRR
- 11.8%
- Equity multiple
- 1.48×
- Total profit
- $14,071
- Equity at exit
- $15,641
- IRR
- 22.4%
- Equity multiple
- 3.11×
- Total profit
- $61,832
- Equity at exit
- $9,070
Cash invested: $29,372 (down + closing). Projections, not guarantees.
Landlord ↔ Tenant lean methodology
- Overall (STATE)
- 87 Strongly Landlord-Friendly
- State Tennessee
- 87 Strongly Landlord-Friendly · R+13
- County
- — inherits STATE
- City
- — inherits STATE
ZIP-level market 37406
- Home prices YoY
- -23.8%
- Rents YoY
- 5.1%
- Active inventory
- 127
- Price-to-rent
- 6.0×
Monthly cashflow live
- Estimated rent
- $1,453 high interval (Pro) →
- Mortgage (P&I)
- −$550
- Tax from tax record
- −$50 /mo · $599/yr
- Insurance
- −$44
- Flood insurance flood zone
- −$66 /mo · $798/yr
- HOA
- −$0
- Vacancy / Maint / Mgmt
- −$305
- Net cashflow
- $438
Break-even live
UW: 25.0% down · 7.5% · 30yr · 1.5% tax · 5.0% vac · 8.0% maint · 8.0% mgmt
Financing live
Cash to close
- Down payment
- $26,225
- Closing costs
- $3,147
- Reserves months
- —
- Total cash needed
- —
Loan-product check · same deal, 3 products live
Conventional
25% down · 7.5% · 30yr
- Down + closing
- —
- Monthly P&I
- —
- Monthly cashflow
- —
- DSCR
- —
- Eligible?
- —
Personal DTI + credit; lowest rate.
DSCR
20% down · 8.5% · 30yr
- Down + closing
- —
- Monthly P&I
- —
- Monthly cashflow
- —
- DSCR
- —
- Eligible?
- —
No personal income docs; deal must DSCR.
Hard money
10% down · 12.0% · 12mo
- Down + closing
- —
- Monthly P&I
- —
- Monthly cashflow
- —
- DSCR
- —
- Eligible?
- —
Short-term bridge; refi at stabilization.
Rent comps 15 comps
| Address | Beds | Baths | Sqft | Rent | $/sqft | DOM | Units | Dist |
|---|---|---|---|---|---|---|---|---|
| 3715 Rollingwood Dr Chattanooga, TN | 3.0 | 1.5 | 1200 | $1,400 | $1.17 | 23d | 1 | 0.19mi |
| 1635 Dogwood Dr Chattanooga, TN | 3.0 | 1.0 | 1024 | $1,600 | $1.56 | 13d | 1 | 0.55mi |
| 2323 Green Forest Dr Chattanooga, TN | 2.0 | 2.5 | 1404 | $1,750 | $1.25 | 13d | 1 | 0.78mi |
| 1205 Tunnel Blvd Chattanooga, TN | 3.0 | 1.0 | 1044 | $1,350 | $1.29 | 23d | 1 | 1.01mi |
| 907 Sylvan Dr Chattanooga, TN | 3.0 | 2.0 | 1248 | $1,495 | $1.20 | 23d | 1 | 1.03mi |
| 1203 Rockway Dr Unit 2 Chattanooga, TN | 2.0 | 1.0 | 940 | $1,250 | $1.33 | 13d | 1 | 1.13mi |
| 3916 Blanchard St Chattanooga, TN | 3.0 | 2.0 | 1056 | $1,445 | $1.37 | 23d | 1 | 1.20mi |
| 3911 Wilsonia Ave Chattanooga, TN | 3.0 | 1.5 | 1143 | $1,395 | $1.22 | 23d | 1 | 1.22mi |
| 802 Aubrey Ave Unit 1 Chattanooga, TN | 3.0 | 1.5 | 1248 | $1,495 | $1.20 | 13d | 1 | 1.24mi |
| 719 McGowan Ave Chattanooga, TN | 1.0 | 1.0 | 915 | $855 | $0.93 | 13d | 1 | 1.33mi |
| 822 Gillespie Rd Chattanooga, TN | 2.0 | 1.0 | 1000 | $1,550 | $1.55 | 13d | 1 | 1.34mi |
| 2829 New Jersey Ave Chattanooga, TN | 3.0 | 2.0 | 1120 | $1,295 | $1.16 | 13d | 1 | 1.38mi |
| 619 Shannon Ave Chattanooga, TN | 2.0 | 1.0 | 962 | $1,250 | $1.30 | 23d | 1 | 1.45mi |
| 3814 Cherwood Ln Unit B Chattanooga, TN | 2.0 | 1.0 | 1000 | $1,350 | $1.35 | 23d | 1 | 1.47mi |
| 745 Henderson Dr Chattanooga, TN | 3.0 | 2.0 | 1275 | $1,495 | $1.17 | 23d | 1 | 1.49mi |
Listing history 2 events
-
2026-06-14remarks 258-char remark
-
2026-06-14$104,900 Pending 3 DOM
ⓘ Source: listings_history table (triggers on properties + properties_extension) + one-shot
backfill from property_details.listing_events for pre-trigger history.
Tax reassessment forecast TN · Resets to sale price
- Current annual tax
- $599 · $50/mo
- Projected year-2 tax
- $745 · $62/mo
- Expected delta
- +$145/yr (+$12/mo · 24.2%)
ⓘ Screening estimate from a state-policy table — verify with the county assessor before closing.
Climate risk First Street
- Flood 10/10 Extreme FEMA zone X (shaded) · 99% chance over 30 yrs
- Wildfire 3/10 Moderate
- Heat 6/10 Major 7 d/yr ≥105°F today · 19 d/yr by 30 yrs out
- Wind 4/10 Moderate 10% chance of damaging wind over 30 yrs
- Air quality 3/10 Moderate 2 unhealthy d/yr today · 2 by 30 yrs out
Nearby sold comps map
Loading sold comps map…
Walkable amenities ~0.75 mi
Loading nearby amenities…
Taxation est. · year 1
- Rental income
- $17,437
- − Mortgage interest
- −$5,876
- − Property taxes
- −$599
- − Insurance
- −$1,322
- − Repairs & maintenance
- −$1,395
- − Management
- −$1,395
- − Depreciation
- −$3,052
- Taxable income
- $3,798
- Est. tax owed @ 24.0%
- −$911
- After-tax cash flow
- $4,341/yr
For passive investors: Depreciation is non-cash, so a rental often shows a tax loss while cash-flowing — sheltering income. Rental losses are passive: they offset passive income freely, and up to $25,000/yr can offset ordinary (W-2) income if you actively participate and your MAGI is under $100k (phasing out to $0 by $150k); unused losses carry forward. On sale, claimed depreciation is recaptured at up to 25%, and gains may owe capital-gains tax (a 1031 exchange can defer both). Figures are a year-1 estimate at your 24.0% rate — not tax advice; consult a CPA.
Schools (NCES district)
- District
- Hamilton County
- NCES district ID
- 4701590
- Math proficiency
- 31% ▼ -10.00%
- Reading proficiency
- 31% ▼ -3.00%
- Median HH income
- $47,456
- Composite
- 26.8/100
- National rank
- #7122
- State rank
- #42 of 139 in TN
Livability — Chattanooga
- Score
- 78/100
- State rank
- #3
- US rank
- #2582
Category grades
Schools grade is shown separately in the Schools card above.
Census & demographics
- Census place
- Chattanooga, TN
- County
- Hamilton County · 312,777 people
- City population
- 131,999
- Metro
- Chattanooga, TN-GA
- Population (ZIP)
- 13,364
- Household income
- $44,850
- Rent vs Own
- Severe rent burden
- 759.0
Population outlook (Hamilton County) Hauer SSP2
- Today (2025)
- 393,784 people
- By 2030
- 412,983 · +4.9%
- By 2040
- 449,502 · +14.1%
- By 2050
- 484,341 · +23.0%
- By 2075
- 565,746 · +43.7%
- By 2100
- 618,394 · +57.0%
Race, ethnicity, and origin ACS 2023
- Neighborhood character
- Predominantly Black (70%)
- Race & ethnicity
- Black 70% White 21% Hispanic / Latino 6% Two or more races 5%
- Hispanic origin (detail)
- Puerto Rican 1%
- Common ancestry
- Italian 1% Slovak 1%
- Foreign-born
- 5% · Canada
- Languages at home
- 92% English-only · Spanish 6% Other Indo-European 1%
Political lean MEDSL · Hamilton
- 2024 margin
- R (+13.1) · D 42.7% · R 55.7% · Other 1.6%
- 2008→2024 swing
- -1.2pp toward R · 2008: -11.8pp · 2024: -13.1pp
- All cycles
- 2024: R+13.1 2020: R+9.7 2016: R+16.6 2012: R+14.8 2008: R+11.8
Not yet ingested
- Civics
- —
Market trends
- HPI YoY
- ▼ -63.73%
- Current HPI
- 203.5858
- Rent YoY
- ▲ 5.13%
- Metro
- Chattanooga, TN-GA
- State GDP YoY
- ▲ 2.78%
- F500 in state
- 22
Industry mix (Fortune 500 HQ in TN)
| Industry | F500 HQs | Revenue |
|---|---|---|
| Healthcare | 3 | $91B |
|
||
| Retail | 3 | $72B |
|
||
| Transportation / Logistics | 1 | $88B |
|
||
| Paper / Packaging | 1 | $19B |
|
||
| Insurance | 1 | $13B |
|
||
| Energy | 1 | $12B |
|
||
Price history
+123.2% since first listed6 events — show timeline
- 2026-06-13 Pending — GCAR
- 2026-06-10 Listed $104,900 GCAR
- 2010-04-13 Sold (Public Records) $80,000 Public Records
- 2002-06-14 Sold (Public Records) $67,000 Public Records
- 2001-09-11 Listed $64,900 RCAOR
- 1988-06-16 Sold (Public Records) $47,000 Public Records
Property tax history
+0.7%/yrLatest (2025): $599 · -16.1% YoY. Source: county tax records.
Cash-flow waterfall
monthlySold comps — $/sqft
last 12 mo · ≤1 miLoading sold comps…