421 26th St · Huntington, WV
Flood risk 6/10 · Moderate
- FEMA flood zone
- X
- Chance of flooding over 30 yrs
- 0.67%
- Est. flood insurance / yr
- $473 – $860
Fire risk 4/10 · Minor
- Est. fire insurance / yr
- $787 – $1,461
Heat risk 5/10 · Moderate
- Hot days now (above 102°F)
- 7 days/yr
- Hot days in 30 yrs
- 20 days/yr
Wind risk 2/10 · Minimal
- Chance of severe wind over 30 yrs
- 1.0%
Air-quality risk 2/10 · Minimal
- Unhealthy air days now
- 0 days/yr
- Unhealthy air days in 30 yrs
- 1 days/yr
Risk factors via First Street. Map © Google.
Why this score? — see what drove the A- grade
The composite is a weighted blend of 9 inputs, each scored 0–100. Each bar is that input's sub-score; the figure is the points it added to the 100-point composite (weight × sub-score).
- Cash flow +30.0/30.0
- ARV discount +15.0/15.0
- 1% rule +10.0/10.0
- DSCR +10.0/10.0
- Appreciation +7.5/10.0
- Livability +4.0/5.0
- Schools +3.0/10.0
- Rent growth +2.5/5.0
- Condition / age +2.5/5.0
$69,000
🖨 Deal sheet (PDF) 📄 Offer letter ✓ Due diligence
Listing remarks MLS
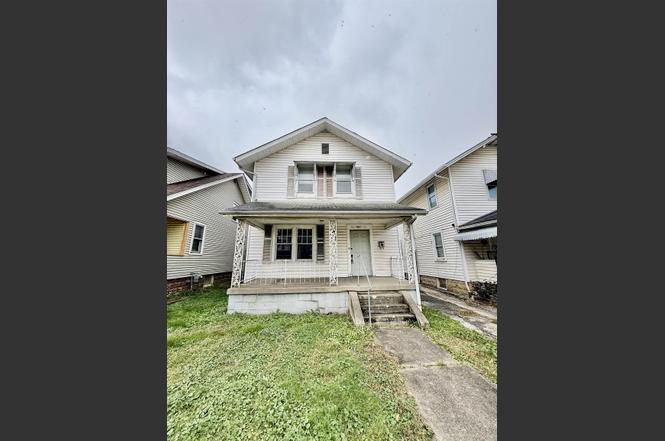
This 2-story home is in a great location behind Hoops Family Field Soccer Complex and minutes from Marshall University! This 3-bed, 2-bath home with one bath on the main floor would be perfect for an investor to add to their portfolio or someone looking to do a little bit of TLC and make it their own.
Key facts
- 3,485 sq ft lot
- Built 1927
- Listed 53 days
Neighborhood map
What this means for you Summary
Snapshot
- This is a 3-bed/1.0-bath single-family listed at $69k.
Deal economics
- At list price, monthly cash flow is $617 ($7k/yr) — positive.
- The deal already cash-flows at list — no discount required.
- Meets the 1% rule at list price ($1k rent vs $69k).
- Recommended offer: $67k (3.0% below list) — sets the bar for market timing.
- Cap rate 17.0% vs local median 6.4% in Huntington — top-decile yield for the area; either an underpriced asset or a hidden risk that comps aren't pricing in. Stress-test before assuming the spread holds.
Location & tenants
- Location reads 79/100 on livability (#16 in WV, #2,045 nationally) — a middle-class / working-renter tenant base. Strengths: amenities A+, commute A+, cost of living A+; Watch: crime F, employment F.
- Cabell County Schools (urban): math 31% / reading 42% proficiency, ranked #13 of 55 in WV (top 24%) — families likely to look elsewhere, expect single-tenant / working-renter base with shorter leases.
- Zoned schools: Highlawn Elementary School (math 27% / reading 22%, grade F, #287 of 377 statewide, top 85%, 325 students, 0% FRL); Huntington East Middle School (math 18% / reading 32%, grade F, #81 of 109 statewide, top 76%, 585 students, 0% FRL); Huntington High School (math 26% / reading 50%, grade F, #31 of 110 statewide, top 28%, 1,704 students, 0% FRL) — zoned schools average 0% FRL vs 47% district-wide (47 pts lower); this property's tenant base skews higher-income than the district average.
- Market conditions: 16 active listings in the ZIP; 2 comparable units currently listed for rent nearby; lower-income renter base — watch delinquency; 61 units permitted in Cabell County in 2024 (5 in 5+ unit buildings).
Forward outlook
- In year one you build about $4k of equity ($477 loan paydown + $3k appreciation (4.9% local appreciation)).
- At projected returns (4.9% appreciation + 3.0% rent growth), your $19k cash investment doubles in ~2 years — after that, you're playing with house money.
- By year 9, paydown + projected appreciation supports a ~$34k cash-out refi (75% LTV) — recoverable capital for the next deal without selling this one.
Negotiation context
- It's been on market 54 days — a 3% lower offer ($67k) is reasonable based on typical stale-listing flexibility.
- 4 sale attempts since 2y ago with the ask held roughly flat each time — persistent listings suggest the price (not the market) is what's stuck; bring a comps-based counter.
- Current owner paid $48k; 44% above their basis — modest negotiation headroom, anchor on the comps not their cost.
Risks & watch-outs
- Watch-outs: built in 1927 — expect roof / HVAC / electrical / plumbing capex.
- Climate carrying-cost: major flood risk; extreme-heat days projected 7→20/yr by 2055 (HVAC capex compounding) — expect insurance premiums to compound above CPI over the hold.
Questions for the listing agent
- It's been on market 54 days. Have you received any prior offers? Is the seller open to a 3% concession, seller financing, or rate buy-down credit?
- Built in 1927 — when were the roof, HVAC, electrical panel, plumbing, and water heater last replaced?
- Is there a deadline driving the sale (1031 exchange, divorce, estate, relocation)? That informs how much negotiation room exists.
- Crime grade is F in this area — have there been break-ins, vandalism, or insurance claims at this property in the last 3 years? What carrier currently insures it and at what premium?
- What's the average days-on-market for RENTAL listings here right now (not sales)? A rising rental-DOM trend means longer vacancies and softer asking-rent achievability than the comps imply.
- What's the recent tenant-quality profile in this submarket — average credit score on applications, eviction rate, late-payment / NSF rate, and stable-employment percentage? A property-management company in the area should have these aggregated.
- How much new for-sale + rental construction is in the pipeline within 1–3 miles? Heavy new supply typically softens prices + rents 12–24 months out; constrained supply supports both.
Investment metrics
- 1% rule
- 2.02% ✓
- Cap rate
- 17.03%
- Cash-on-cash
- 38.34%
- DSCR
- 2.71
- GRM
- 4.1
CMA / ARV
- ARV (on-the-fly)
- $125,760
- Comps found
- 12
Show comp detail 12 sales within ~0.75 mi
| Address | Dist | Beds/Ba | Sqft | Sold | Price | $/sf | Match |
|---|---|---|---|---|---|---|---|
| 2741 4th Ave | 0.32mi | 3/1.0 | 1,300 (-1%) | 2mo | $104,000 | $80 | 82 |
| 2712 Highlawn Ave | 0.24mi | 3/1.0 | 1,426 (+9%) | 2mo | $129,000 | $90 | 72 |
| 2709 4th Ave | 0.23mi | 2/1.0 (-1) | 1,344 (+3%) | 10mo | $126,000 | $94 | 71 |
| 2783 Emmons Ave | 0.63mi | 3/1.0 | 1,304 (-0%) | 1mo | $150,000 | $115 | 69 |
| 2530 Collis Ave | 0.25mi | 3/1.5 | 1,176 (-10%) | 4mo | $100,000 | $85 | 66 |
| 2633 4th Avenue Ave | 0.08mi | 3/1.0 | 1,490 (+14%) | 11mo | $100,000 | $67 | 64 |
| 351 Slater Ct | 0.25mi | 3/1.5 | 1,133 (-14%) | 2mo | $113,900 | $101 | 62 |
| 53 26th St | 0.35mi | 3/1.5 | 1,188 (-9%) | 6mo | $194,900 | $164 | 62 |
| 2856 Overlook Dr | 0.71mi | 3/2.0 | 1,276 (-3%) | 8mo | $141,500 | $111 | 52 |
| 626 Chesapeake St | 0.69mi | 3/2.0 | 1,385 (+6%) | 10mo | $149,000 | $108 | 46 |
| 2957 4th Ave | 0.70mi | 2/1.5 (-1) | 1,248 (-5%) | 9mo | $120,000 | $96 | 45 |
| 916 23rd St | 0.67mi | 3/2.0 | 1,143 (-13%) | 1mo | $106,900 | $94 | 43 |
Match score weights: distance 35% · size 25% · config 20% · recency 20%. Top-matched comps best support the ARV.
Projected returns pro-forma
4.91% appreciation · 3.0% rent growth · sell at horizon
- IRR
- 46.7%
- Equity multiple
- 3.84×
- Total profit
- $54,885
- Equity at exit
- $38,723
- IRR
- 44.6%
- Equity multiple
- 7.84×
- Total profit
- $132,160
- Equity at exit
- $66,520
Cash invested: $19,320 (down + closing). Projections, not guarantees.
Landlord ↔ Tenant lean methodology
- Overall (STATE)
- 83 Strongly Landlord-Friendly
- State West Virginia
- 83 Strongly Landlord-Friendly · R+22
- County
- — inherits STATE
- City
- — inherits STATE
ZIP-level market 25703
- Home prices YoY
- 3.0%
- Active inventory
- 16
- Price-to-rent
- 4.1×
Monthly cashflow live
- Estimated rent
- $1,392 medium interval (Pro) →
- Mortgage (P&I)
- −$362
- Tax from tax record
- −$92 /mo · $1,102/yr
- Insurance
- −$29
- HOA
- −$0
- Vacancy / Maint / Mgmt
- −$292
- Net cashflow
- $617
Break-even live
Sensitivity live
| Price | -10% $656 | -5% $637 | +0% $617 | +5% $598 | +10% $578 |
|---|---|---|---|---|---|
| Rent | -10% $507 | -5% $562 | +0% $617 | +5% $672 | +10% $727 |
| Rate | -1.0pp $652 | -0.5pp $635 | base $617 | +0.5pp $599 | +1.0pp $581 |
UW: 25.0% down · 7.5% · 30yr · 1.5% tax · 5.0% vac · 8.0% maint · 8.0% mgmt
Financing live
Cash to close
- Down payment
- $17,250
- Closing costs
- $2,070
- Reserves months
- —
- Total cash needed
- —
Loan-product check · same deal, 3 products live
Conventional
25% down · 7.5% · 30yr
- Down + closing
- —
- Monthly P&I
- —
- Monthly cashflow
- —
- DSCR
- —
- Eligible?
- —
Personal DTI + credit; lowest rate.
DSCR
20% down · 8.5% · 30yr
- Down + closing
- —
- Monthly P&I
- —
- Monthly cashflow
- —
- DSCR
- —
- Eligible?
- —
No personal income docs; deal must DSCR.
Hard money
10% down · 12.0% · 12mo
- Down + closing
- —
- Monthly P&I
- —
- Monthly cashflow
- —
- DSCR
- —
- Eligible?
- —
Short-term bridge; refi at stabilization.
Rent comps 2 comps
| Address | Beds | Baths | Sqft | Rent | $/sqft | DOM | Units | Dist |
|---|---|---|---|---|---|---|---|---|
| 2489 1st Ave Unit 108 A Huntington, WV | 2.0 | 1.5 | 1600 | $1,495 | $0.93 | 45d | 1 | 0.37mi |
| 1739 6th Ave Huntington, WV | 1.0–2.0 | 1.0 | 825 | $925 | $1.12 | 45d | 1 | 1.01mi |
Listing history 19 events
-
2026-06-21days on market $69,000 Active 54 DOM
-
2026-06-19days on market $69,000 Active 52 DOM
-
2026-06-18days on market $69,000 Active 51 DOM
-
2026-06-17days on market $69,000 Active 50 DOM
-
2026-06-16days on market $69,000 Active 49 DOM
-
2026-06-15days on market $69,000 Active 48 DOM
-
2026-06-14days on market $69,000 Active 46 DOM
-
2026-06-12days on market $69,000 Active 45 DOM
-
2026-06-09days on market $69,000 Active 42 DOM
-
2026-06-09status $69,000 Active 41 DOM
-
2026-04-09status Pending
Show marketing remark (302 chars)
This 2-story home is in a great location behind Hoops Family Field Soccer Complex and minutes from Marshall University! This 3-bed, 2-bath home with one bath on the main floor would be perfect for an investor to add to their portfolio or someone looking to do a little bit of TLC and make it their own.
-
2026-04-09status Pending 302-char remark
Show marketing remark (302 chars)
This 2-story home is in a great location behind Hoops Family Field Soccer Complex and minutes from Marshall University! This 3-bed, 2-bath home with one bath on the main floor would be perfect for an investor to add to their portfolio or someone looking to do a little bit of TLC and make it their own.
-
2026-02-25$69,000 Active
Show marketing remark (302 chars)
This 2-story home is in a great location behind Hoops Family Field Soccer Complex and minutes from Marshall University! This 3-bed, 2-bath home with one bath on the main floor would be perfect for an investor to add to their portfolio or someone looking to do a little bit of TLC and make it their own.
-
2026-02-25$69,000 Active 302-char remark
Show marketing remark (302 chars)
This 2-story home is in a great location behind Hoops Family Field Soccer Complex and minutes from Marshall University! This 3-bed, 2-bath home with one bath on the main floor would be perfect for an investor to add to their portfolio or someone looking to do a little bit of TLC and make it their own.
-
2026-01-21price $69,000
-
2025-11-10$75,000 Active
-
2024-11-01price $96,000
-
2024-09-27$118,000 Active
-
2023-02-02soldstatus $48,000
ⓘ Source: listings_history table (triggers on properties + properties_extension) + one-shot
backfill from property_details.listing_events for pre-trigger history.
Tax reassessment forecast WV · Resets to sale price
- Current annual tax
- $1,102 · $92/mo
- Projected year-2 tax
- $1,102 · $92/mo
- Expected delta
- $0/yr ($0/mo · 0.0%)
ⓘ Screening estimate from a state-policy table — verify with the county assessor before closing.
Climate risk First Street
- Flood 6/10 Major FEMA zone X · 67% chance over 30 yrs
- Wildfire 4/10 Moderate
- Heat 5/10 Major 7 d/yr ≥102°F today · 20 d/yr by 30 yrs out
- Wind 2/10 Low 100% chance of damaging wind over 30 yrs
- Air quality 2/10 Low 0 unhealthy d/yr today · 1 by 30 yrs out
Nearby sold comps map
Loading sold comps map…
Walkable amenities ~0.75 mi
Loading nearby amenities…
Taxation est. · year 1
- Rental income
- $16,704
- − Mortgage interest
- −$3,865
- − Property taxes
- −$1,102
- − Insurance
- −$345
- − Repairs & maintenance
- −$1,336
- − Management
- −$1,336
- − Depreciation
- −$2,007
- Taxable income
- $6,712
- Est. tax owed @ 24.0%
- −$1,611
- After-tax cash flow
- $5,796/yr
For passive investors: Depreciation is non-cash, so a rental often shows a tax loss while cash-flowing — sheltering income. Rental losses are passive: they offset passive income freely, and up to $25,000/yr can offset ordinary (W-2) income if you actively participate and your MAGI is under $100k (phasing out to $0 by $150k); unused losses carry forward. On sale, claimed depreciation is recaptured at up to 25%, and gains may owe capital-gains tax (a 1031 exchange can defer both). Figures are a year-1 estimate at your 24.0% rate — not tax advice; consult a CPA.
Schools (NCES district)
- District
- Cabell County Schools
- NCES district ID
- 5400180
- Math proficiency
- 31% ▼ -7.00%
- Reading proficiency
- 42% ▼ -6.00%
- Median HH income
- $36,426
- Composite
- 30.26/100
- National rank
- #6285
- State rank
- #13 of 55 in WV
Livability — Huntington
- Score
- 79/100
- State rank
- #16
- US rank
- #2045
Category grades
Schools grade is shown separately in the Schools card above.
Census & demographics
- Census place
- Huntington, WV
- County
- Cabell County · 30,893 people
- City population
- 25,795
- Metro
- Huntington-Ashland, WV-KY-OH
- Population (ZIP)
- 4,598
- Household income
- $24,139
- Rent vs Own
- Severe rent burden
- 813.0
Population outlook (Cabell County) Hauer SSP2
- Today (2025)
- 97,574 people
- By 2030
- 98,060 · +0.5%
- By 2040
- 98,817 · +1.3%
- By 2050
- 100,185 · +2.7%
- By 2075
- 105,895 · +8.5%
- By 2100
- 105,948 · +8.6%
Race, ethnicity, and origin ACS 2023
- Neighborhood character
- Predominantly White (82%)
- Race & ethnicity
- White 82% Black 9% Two or more races 6% Asian 2% Hispanic / Latino 1%
- Common ancestry
- Slovak 3% Romanian 1% Lithuanian 1%
- Foreign-born
- 2% · Philippines, Canada, China
- Languages at home
- 98% English-only · Spanish 1%
Political lean MEDSL · Cabell
- 2024 margin
- Strong R (+21.9) · D 38.0% · R 59.9% · Other 2.0%
- 2008→2024 swing
- -11.8pp toward R · 2008: -10.1pp · 2024: -21.9pp
- All cycles
- 2024: R+21.9 2020: R+18.0 2016: R+25.5 2012: R+13.9 2008: R+10.1
Not yet ingested
- Civics
- —
Market trends
- HPI YoY
- ▲ 4.91%
- Current HPI
- 166.7429
- Rent YoY
- —
- Metro
- Huntington-Ashland, WV-KY-OH
- State GDP YoY
- —
- F500 in state
- 0
Price history
+43.8% since first listed9 events — show timeline
- 2026-04-09 Pending — KVBOR
- 2026-04-09 Pending — HBRMLS
- 2026-02-25 Listed $69,000 HBRMLS
- 2026-02-25 Listed $69,000 KVBOR
- 2026-01-21 Price Changed $69,000 KVBOR
- 2025-11-10 Listed $75,000 KVBOR
- 2024-11-01 Price Changed $96,000 KVBOR
- 2024-09-27 Listed $118,000 KVBOR
- 2023-02-02 Sold (Public Records) $48,000 Public Records
Property tax history
+0.7%/yrLatest (2025): $1,102 · +7.6% YoY. Source: county tax records.
Cash-flow waterfall
monthlySold comps — $/sqft
last 12 mo · ≤1 miLoading sold comps…