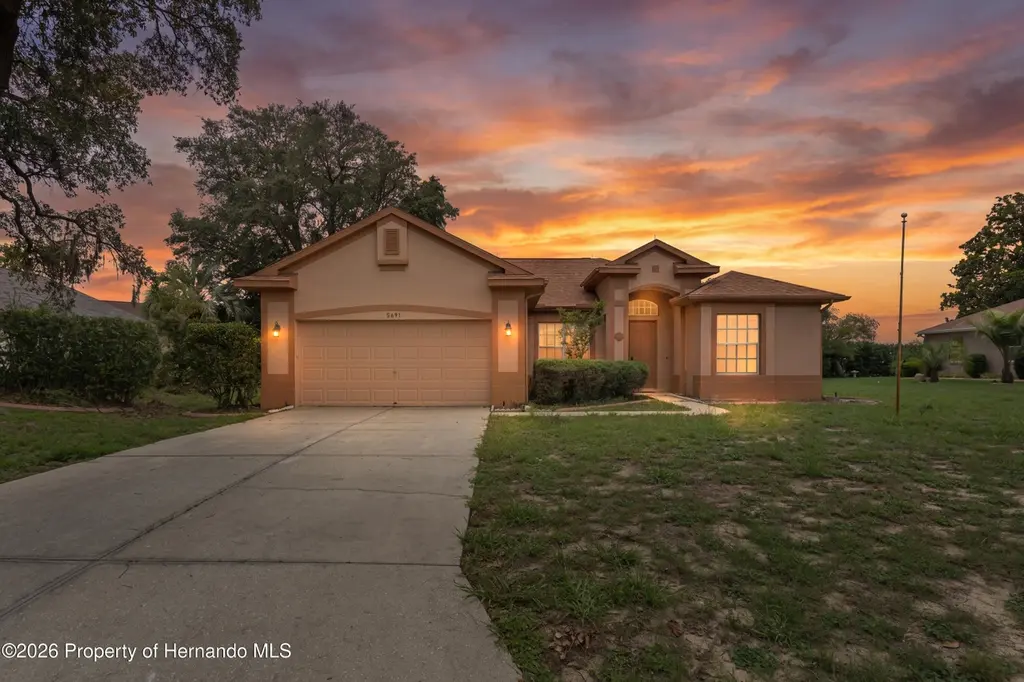
5691 W Hunters Ridge Cir W · Homosassa Springs, FL
Flood risk 1/10 · Minimal
- FEMA flood zone
- X (unshaded)
- Chance of flooding over 30 yrs
- 0.0%
- Est. flood insurance / yr
- $507 – $1,088
Fire risk 6/10 · Moderate
- Est. fire insurance / yr
- $947 – $1,759
Heat risk 9/10 · Severe
- Hot days now (above 108°F)
- 7 days/yr
- Hot days in 30 yrs
- 24 days/yr
Wind risk 9/10 · Severe
- Chance of severe wind over 30 yrs
- 99.0%
Air-quality risk 1/10 · Minimal
- Unhealthy air days now
- 0 days/yr
- Unhealthy air days in 30 yrs
- 0 days/yr
Risk factors via First Street. Map © Google.
Why this score? — see what drove the D+ grade
The composite is a weighted blend of 9 inputs, each scored 0–100. Each bar is that input's sub-score; the figure is the points it added to the 100-point composite (weight × sub-score).
- Cash flow +12.9/30.0
- ARV discount +12.0/15.0
- Schools +4.1/10.0
- DSCR +3.9/10.0
- 1% rule +3.7/10.0
- Livability +3.6/5.0
- Rent growth +2.5/5.0
- Condition / age +2.5/5.0
- Appreciation +0.0/10.0
$299,900
🖨 Deal sheet (PDF) 📄 Offer letter ✓ Due diligence
Listing remarks MLS
BIG & BEAUTIFUL, MOVE-IN READY; BUILT IN 2000 4 BDRM, 3 BATH, 2-CAR GAR, IN GATED COMMUNITY; HIGH CEILING THRU-OUT HOME; LIVING RM, FAMILY RM & FLORIDA/OFFICE ROOM; SPACIOUS KITCHEN & INSIDE LAUNDRY ROOM WITH WASHER & DRYER; FORMAL DINING RM, EAT-IN KITCHEN & BREAKFAST BAR; SPRINKLER SYS & GUTTERS, ROOM FOR A POOL, PRIVATE REAR YARD; CHECK OUT ARBOR & SECRET GARDEN ON SIDE; 3RD BATH AT REAR OF HOUSE IF YOU WISH TO ADD A POOL, NEW A/C IN 2012; WEBSITE = www. heatherridgehoa. info; MOTIVATED SELLERS, MAKE OFFER; OPEN HOUSE 9/10/16 SATURDAY 1-4
Key facts
- In-law suite
- Split floor plan
- Large pantry
Tags
Property features AI
Finance
- Financial info: Tax information not included per instructions
- HOA & community: Homeowners association with annual fee of $465 (approximately $38.75/month); HOA covers grounds maintenance
Exterior
- Parking: Attached 2-car garage
- Security: Security gate
- Utilities: Public water; Public sewer; 220V outlet in garage; Electricity connected; Water connected; Sewer connected; Cable available
- Home design: Single-family residence; Residential property
- Construction: Concrete construction; Shingle roof
- Exterior features: Covered patio
Interior
- Kitchen: Electric cooktop; Electric oven; Microwave; Dishwasher; Garbage disposal; Refrigerator; Pantry
- Bedrooms: Bedroom count not specified
- Flooring: Laminate
- Bathrooms: 3 full bathrooms
- Heating & cooling: Central heating; Central air conditioning
- Interior features: Entrance foyer; Open floorplan; Pantry; Vaulted ceilings; His and hers closets; Walk-in closets; Double vanity
- Laundry & utility: Washer; Dryer
Neighborhood map
What this means for you Summary
Snapshot
- This is a 4-bed/2.0-bath single-family listed at $300k.
Deal economics
- At list price, monthly cash flow is $-21 ($-252/yr) — negative.
- To cash-flow at today's rent, offer at most $296k (1.2% below list).
- To meet the 1% rule (rent ≥ 1% of price), the offer needs to be $261k (12.9% below list).
- Recommended offer: $261k (12.9% below list) — sets the bar for 1% rule.
Location & tenants
- Location reads 71/100 on livability (#391 in FL) — a middle-class / working-renter tenant base. Strengths: cost of living A+, housing A+, health & safety A+; Watch: crime C-, amenities F, commute F.
- Citrus (rural): math 49% / reading 50% proficiency, ranked #44 of 73 in FL (top 60%) — families likely to look elsewhere, expect single-tenant / working-renter base with shorter leases.
- Zoned schools: Rock Crusher Elementary School (math 70% / reading 56%, grade B, #582 of 2,144 statewide, top 28%, 665 students, 68% FRL); Crystal River Middle School (math 49% / reading 47%, grade C-, #286 of 571 statewide, top 50%, 900 students, 64% FRL); Crystal River High School (math 31% / reading 44%, grade F, #336 of 667 statewide, top 51%, 1,249 students, 56% FRL).
- Market conditions: 199 active listings in the ZIP; 2 comparable units currently listed for rent nearby; 2,443 units permitted in Citrus County in 2024 (0 in 5+ unit buildings).
- At $2,611/mo this rent would consume 49% of the median local household income ($63k/yr) (locally 41% of renters already pay >50% of income on rent) — very limited rent-growth headroom before tenants either downsize or default.
Forward outlook
- Local home prices are declining (-3.0%/yr); year-one equity from $2k of loan paydown is wiped out by about $9k of value loss. Plan a longer hold.
- Citrus County population projected to shrink 10% by 2050 — rents likely to lag national; underwrite the cash flow, not the appreciation.
Negotiation context
- It's been on market 17 days — a 2% lower offer ($295k) is reasonable based on typical stale-listing flexibility.
- 3 sale attempts since 24y ago; this cycle's ask has dropped $25k (8%) from the opening price — seller is motivated, your offer sets the floor, not the list.
- Current owner paid $155k; list at $300k implies a 93% gain — meaningful room to come down on a strong offer.
Risks & watch-outs
- Climate carrying-cost: severe wind risk, 99% chance of damaging wind over 30y; major wildfire risk; extreme-heat days projected 7→24/yr by 2055 (HVAC capex compounding) — expect insurance premiums to compound above CPI over the hold.
Questions for the listing agent
- What do current leases actually rent for vs. the listed asking? Can we see a recent rent roll and the last 12 months of T-12 income?
- What does the HOA fee cover, when was the last increase, and are there any pending special assessments or reserve-fund shortfalls?
- Is there a deadline driving the sale (1031 exchange, divorce, estate, relocation)? That informs how much negotiation room exists.
- Schools are F-rated, which usually means shorter tenancies and higher turnover. Who's the typical renter profile here, and what's been the actual vacancy rate?
- The area grade is low — what's the realistic commute time and amenity access for the typical tenant pool here? Any planned neighborhood developments (good or bad) we should know about?
- What's the average days-on-market for RENTAL listings here right now (not sales)? A rising rental-DOM trend means longer vacancies and softer asking-rent achievability than the comps imply.
- What's the recent tenant-quality profile in this submarket — average credit score on applications, eviction rate, late-payment / NSF rate, and stable-employment percentage? A property-management company in the area should have these aggregated.
- How much new for-sale + rental construction is in the pipeline within 1–3 miles? Heavy new supply typically softens prices + rents 12–24 months out; constrained supply supports both.
Investment metrics
- 1% rule
- 0.87% ✗
- Cap rate
- 6.21%
- Cash-on-cash
- -0.30%
- DSCR
- 0.99
- GRM
- 9.6
CMA / ARV
- ARV (on-the-fly)
- $333,248
- Comps found
- 12
Show comp detail 12 sales within ~0.75 mi
| Address | Dist | Beds/Ba | Sqft | Sold | Price | $/sf | Match |
|---|---|---|---|---|---|---|---|
| 5617 W Hunters Ridge Cir | 0.14mi | 3/2.0 (-1) | 2,025 (-0%) | 2mo | $287,500 | $142 | 86 |
| 5613 W Crossmoor Pl | 0.14mi | 4/3.0 | 2,077 (+2%) | 10mo | $335,000 | $161 | 77 |
| 158 N Skyflower Pt | 0.27mi | 4/2.0 | 2,046 (+1%) | 10mo | $335,000 | $164 | 77 |
| 199 N Crystal Meadow Path | 0.45mi | 4/3.0 | 2,039 (+0%) | 2mo | $405,000 | $199 | 73 |
| 65 N Leafland Pt | 0.23mi | 3/2.0 (-1) | 2,317 (+14%) | 2mo | $300,000 | $129 | 59 |
| 5420 W Heather Ridge Path | 0.30mi | 3/2.0 (-1) | 2,316 (+14%) | 2mo | $270,000 | $117 | 56 |
| 6090 W Woodside Cir | 0.60mi | 3/2.0 (-1) | 2,151 (+6%) | 2mo | $430,000 | $200 | 56 |
| 176 N Crystal Meadow Path | 0.42mi | 3/3.0 (-1) | 1,905 (-6%) | 8mo | $415,000 | $218 | 54 |
| 489 N Turkey Pine Loop | 0.63mi | 3/2.0 (-1) | 1,839 (-10%) | 11mo | $295,000 | $160 | 40 |
| 110 S Rock Crusher Rd | 0.63mi | 3/2.0 (-1) | 1,839 (-10%) | 12mo | $322,000 | $175 | 40 |
| 322 N Turkey Pine Loop | 0.59mi | 3/2.0 (-1) | 1,761 (-13%) | 8mo | $255,000 | $145 | 39 |
| 5811 W Meadowpark Ln | 0.72mi | 3/2.0 (-1) | 1,805 (-11%) | 8mo | $310,000 | $172 | 36 |
Match score weights: distance 35% · size 25% · config 20% · recency 20%. Top-matched comps best support the ARV.
Projected returns pro-forma
-3.0% appreciation · 3.0% rent growth · sell at horizon
- IRR
- -16.8%
- Equity multiple
- 0.41×
- Total profit
- $-49,887
- Equity at exit
- $44,716
- IRR
- -8.6%
- Equity multiple
- 0.46×
- Total profit
- $-44,973
- Equity at exit
- $25,930
Cash invested: $83,972 (down + closing). Projections, not guarantees.
Landlord ↔ Tenant lean methodology
- Overall (STATE)
- 87 Strongly Landlord-Friendly
- State Florida
- 87 Strongly Landlord-Friendly · R+3
- County
- — inherits STATE
- City
- — inherits STATE
ZIP-level market 34461
- Home prices YoY
- -10.2%
- Active inventory
- 199
- Price-to-rent
- 9.6×
Monthly cashflow live
- Estimated rent
- $2,611 medium interval (Pro) →
- Mortgage (P&I)
- −$1,573
- Tax from tax record
- −$347 /mo · $4,168/yr
- Insurance
- −$125
- HOA
- −$39
- Vacancy / Maint / Mgmt
- −$548
- Net cashflow
- $-21
Break-even live
Sensitivity live
| Price | -10% $149 | -5% $64 | +0% $-21 | +5% $-106 | +10% $-191 |
|---|---|---|---|---|---|
| Rent | -10% $-227 | -5% $-124 | +0% $-21 | +5% $82 | +10% $185 |
| Rate | -1.0pp $130 | -0.5pp $55 | base $-21 | +0.5pp $-99 | +1.0pp $-178 |
UW: 25.0% down · 7.5% · 30yr · 1.5% tax · 5.0% vac · 8.0% maint · 8.0% mgmt
Financing live
Cash to close
- Down payment
- $74,975
- Closing costs
- $8,997
- Reserves months
- —
- Total cash needed
- —
Loan-product check · same deal, 3 products live
Conventional
25% down · 7.5% · 30yr
- Down + closing
- —
- Monthly P&I
- —
- Monthly cashflow
- —
- DSCR
- —
- Eligible?
- —
Personal DTI + credit; lowest rate.
DSCR
20% down · 8.5% · 30yr
- Down + closing
- —
- Monthly P&I
- —
- Monthly cashflow
- —
- DSCR
- —
- Eligible?
- —
No personal income docs; deal must DSCR.
Hard money
10% down · 12.0% · 12mo
- Down + closing
- —
- Monthly P&I
- —
- Monthly cashflow
- —
- DSCR
- —
- Eligible?
- —
Short-term bridge; refi at stabilization.
Rent comps 2 comps
| Address | Beds | Baths | Sqft | Rent | $/sqft | DOM | Units | Dist |
|---|---|---|---|---|---|---|---|---|
| 1165 N Commerce Ter Lecanto, FL | 3.0 | 2.5 | 1697 | $1,800 | $1.06 | 23d | 1 | 1.17mi |
| 6384 W Flanders Ln Crystal River, FL | 3.0 | 2.0 | 1800 | $2,250 | $1.25 | 23d | 1 | 1.17mi |
HOA detail
- Monthly dues
- $39 · $468/yr
- Likely covers
- poolsecurity
Listing history 15 events
-
2026-06-21days on market $299,900 Active 17 DOM
-
2026-06-19days on market $299,900 Active 15 DOM
-
2026-06-18status $299,900 Active 14 DOM
-
2026-06-18status $299,900 Pending 14 DOM
-
2026-06-17days on market $299,900 Active 14 DOM
-
2026-06-16days on market $299,900 Active 13 DOM
-
2026-06-15days on market $299,900 Active 12 DOM
-
2026-06-14days on market $299,900 Active 10 DOM
-
2026-06-13days on market $299,900 Active 9 DOM
-
2026-06-10days on market $299,900 Active 7 DOM
-
2026-06-09pricedays on market $299,900 Active 6 DOM
-
2026-06-08days on market $324,900 Active 5 DOM
-
2026-06-07days on market $324,900 Active 4 DOM
-
2026-06-03remarks 699-char remark
-
2026-06-03$324,900 Active 1 DOM
ⓘ Source: listings_history table (triggers on properties + properties_extension) + one-shot
backfill from property_details.listing_events for pre-trigger history.
Tax reassessment forecast FL · Resets to sale price
- Current annual tax
- $4,168 · $347/mo
- Projected year-2 tax
- $4,168 · $347/mo
- Expected delta
- $0/yr ($0/mo · 0.0%)
ⓘ Screening estimate from a state-policy table — verify with the county assessor before closing.
Climate risk First Street
- Flood 1/10 Low FEMA zone X (unshaded) · 0% chance over 30 yrs
- Wildfire 6/10 Major
- Heat 9/10 Extreme 7 d/yr ≥108°F today · 24 d/yr by 30 yrs out
- Wind 9/10 Extreme 99% chance of damaging wind over 30 yrs
- Air quality 1/10 Low 0 unhealthy d/yr today · 0 by 30 yrs out
Nearby sold comps map
Loading sold comps map…
Walkable amenities ~0.75 mi
Loading nearby amenities…
Taxation est. · year 1
- Rental income
- $31,337
- − Mortgage interest
- −$16,799
- − Property taxes
- −$4,168
- − Insurance
- −$1,500
- − Repairs & maintenance
- −$2,507
- − Management
- −$2,507
- − HOA
- −$468
- − Depreciation
- −$8,724
- Taxable loss
- −$5,336
- Est. tax savings @ 24.0%
- +$1,281
- After-tax cash flow
- $1,029/yr
For passive investors: Depreciation is non-cash, so a rental often shows a tax loss while cash-flowing — sheltering income. Rental losses are passive: they offset passive income freely, and up to $25,000/yr can offset ordinary (W-2) income if you actively participate and your MAGI is under $100k (phasing out to $0 by $150k); unused losses carry forward. On sale, claimed depreciation is recaptured at up to 25%, and gains may owe capital-gains tax (a 1031 exchange can defer both). Figures are a year-1 estimate at your 24.0% rate — not tax advice; consult a CPA.
Schools (NCES district)
- District
- Citrus
- NCES district ID
- 1200270
- Math proficiency
- 49% ▼ -10.00%
- Reading proficiency
- 50% ▼ -6.00%
- Median HH income
- $38,618
- Composite
- 41.28/100
- National rank
- #3519
- State rank
- #44 of 73 in FL
Livability — Homosassa Springs
- Score
- 71/100
- State rank
- #391
- US rank
- #6877
Category grades
Schools grade is shown separately in the Schools card above.
Census & demographics
- County
- Citrus County · 111,314 people
- Metro
- Homosassa Springs, FL
- Population (ZIP)
- 13,377
- Household income
- $63,418
- Rent vs Own
- Severe rent burden
- 41.0
Population outlook (Citrus County) Hauer SSP2
- Today (2025)
- 138,622 people
- By 2030
- 136,886 · -1.3%
- By 2040
- 132,009 · -4.8%
- By 2050
- 125,196 · -9.7%
- By 2075
- 108,570 · -21.7%
- By 2100
- 84,454 · -39.1%
Race, ethnicity, and origin ACS 2023
- Neighborhood character
- Predominantly White (87%)
- Race & ethnicity
- White 87% Hispanic / Latino 8% Two or more races 7% Black 2%
- Hispanic origin (detail)
- Puerto Rican 3%
- Common ancestry
- Romanian 3% Lithuanian 3% Slovak 3%
- Foreign-born
- 8% · Canada, Jamaica
- Languages at home
- 95% English-only · Spanish 3%
Political lean MEDSL · Citrus
- 2024 margin
- Solid R (+45.9) · D 26.8% · R 72.6%
- 2008→2024 swing
- -29.8pp toward R · 2008: -16.1pp · 2024: -45.9pp
- All cycles
- 2024: R+45.9 2020: R+41.0 2016: R+39.7 2012: R+21.9 2008: R+16.1
Not yet ingested
- Civics
- —
Market trends
- HPI YoY
- ▼ -29.48%
- Current HPI
- 258.0866
- Rent YoY
- —
- Metro
- Homosassa Springs, FL
- State GDP YoY
- ▲ 3.28%
- F500 in state
- 36
Industry mix (Fortune 500 HQ in FL)
| Industry | F500 HQs | Revenue |
|---|---|---|
| Industrial Technology | 2 | $29B |
|
||
| Insurance | 2 | $17B |
|
||
| Retail | 1 | $60B |
|
||
| Technology Distribution | 1 | $58B |
|
||
| Homebuilding | 1 | $35B |
|
||
| Technology Manufacturing | 1 | $35B |
|
||
Price history
+91.2% since first listed7 events — show timeline
- 2026-06-03 Listed $324,900 HCAR
- 2016-09-30 Sold (Public Records) $155,000 Public Records
- 2016-09-30 Sold (MLS) $155,000 RACC
- 2016-05-03 Listed $163,500 RACC
- 2003-01-27 Sold (Public Records) $162,000 Public Records
- 2003-01-20 Sold (MLS) $162,000 RACC
- 2002-07-01 Listed $169,900 RACC
Property tax history
+11.8%/yrLatest (2025): $4,168 · +4.6% YoY. Source: county tax records.
Cash-flow waterfall
monthlySold comps — $/sqft
last 12 mo · ≤1 miLoading sold comps…