 Duplex
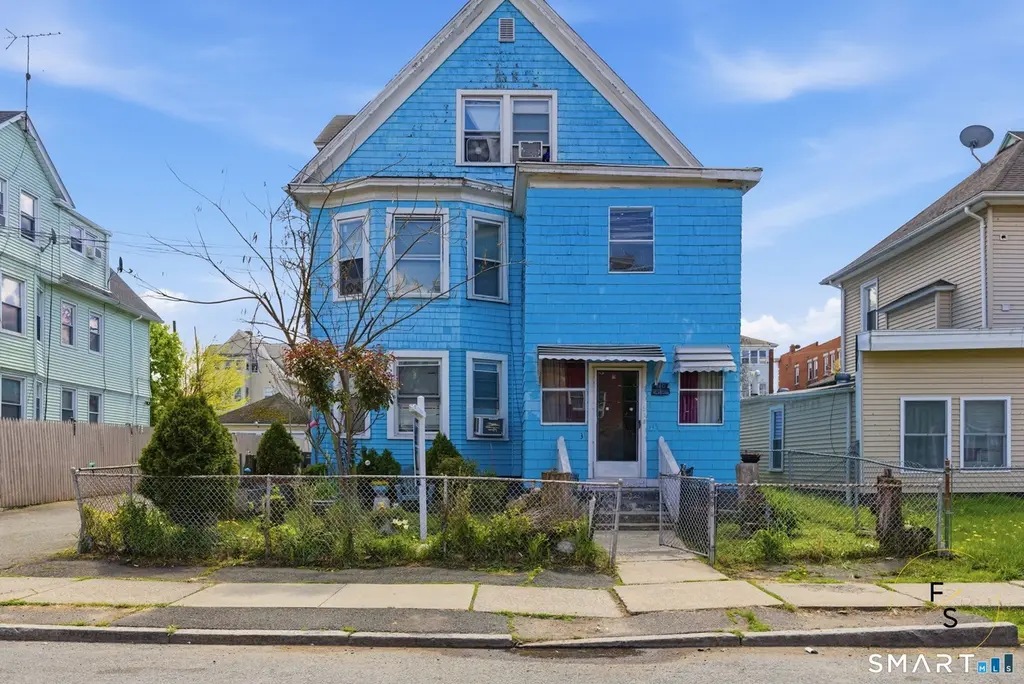
31-33 Standish St · Hartford, CT
Flood risk 6/10 · Moderate
- FEMA flood zone
- X (unshaded)
- Chance of flooding over 30 yrs
- 0.73%
- Est. flood insurance / yr
- $473 – $860
Fire risk 1/10 · Minimal
- Est. fire insurance / yr
- $829 – $1,539
Heat risk 5/10 · Moderate
- Hot days now (above 97°F)
- 7 days/yr
- Hot days in 30 yrs
- 16 days/yr
Wind risk 6/10 · Moderate
- Chance of severe wind over 30 yrs
- 27.0%
Air-quality risk 3/10 · Minor
- Unhealthy air days now
- 3 days/yr
- Unhealthy air days in 30 yrs
- 4 days/yr
Risk factors via First Street. Map © Google.
Why this score? — see what drove the B- grade
The composite is a weighted blend of 9 inputs, each scored 0–100. Each bar is that input's sub-score; the figure is the points it added to the 100-point composite (weight × sub-score).
- Cash flow +25.7/30.0
- Appreciation +10.0/10.0
- DSCR +8.6/10.0
- ARV discount +7.5/15.0
- 1% rule +6.6/10.0
- Livability +3.8/5.0
- Rent growth +2.9/5.0
- Condition / age +2.5/5.0
- Schools +1.4/10.0
$429,900
🖨 Deal sheet (PDF) 📄 Offer letter ✓ Due diligence
Multi-family units
County records classify this as Multi-Family (2-4 Unit). Listing-text estimate: 2 units. confirmed
Listing remarks MLS
Totally updated 3 fam in south-end with some thermo windows. C/tile in in 1st flr foyer.Encl f/ porches. Open r/porches. 100 Amps c/breakers c/tile in btrms flr& walls. 1St flr has sec. Sys.Laund.On flrs.
Key facts
- Easy access to i-84
- Easy access to i-91
- 6,534 sq ft lot
Tags
Property features AI
Finance
- Other: Additional documents and supplements available (3)
- Financial info: Assessed value available
Exterior
- Utilities: Public water connected; Public sewer connected
- Home design: Multi-family property (3-family)
- Construction: Shingle roof; Concrete foundation; Other construction
- Exterior features: Level lot; Other exterior siding
Interior
- Bedrooms: 9 bedrooms
- Bathrooms: 3 full bathrooms
- Heating & cooling: Radiator heat; Electric heat fuel; Natural gas domestic hot water
- Interior features: 15 total rooms; Full, unfinished basement
Neighborhood map
What this means for you Summary
Snapshot
- This is a 2 × 4-bed/?-bath units multifamily listed at $430k.
Deal economics
- At list price, monthly cash flow is $1k ($12k/yr) — positive. Per door: $518/mo.
- The deal already cash-flows at list — no discount required.
- Meets the 1% rule at list price ($5k rent vs $430k).
Location & tenants
- Location reads 76/100 on livability (#58 in CT, #3,553 nationally) — a middle-class / working-renter tenant base. Strengths: amenities A+, commute A+, health & safety A+; Watch: crime F, employment F.
- Hartford School District (urban): math 13% / reading 21% proficiency, ranked #150 of 153 in CT (top 98%) — low school quality limits family demand, transient renter base, plan for 1-2y turnover; 84% free/reduced lunch — lower-income household profile, screen leases tightly.
- Zoned schools: Dwight-Bellizzi Dual Language Academy (math 4% / reading 9%, grade F, #541 of 553 statewide, top 98%, 626 students, 82% FRL); Betances Stem Magnet School (math 19% / reading 35%, grade F, #149 of 175 statewide, top 86%, 210 students, 77% FRL); Bulkeley High School (math 5% / reading 15%, grade F, #185 of 194 statewide, top 96%, 548 students, 87% FRL) — zoned schools at 82% FRL track the district average.
- Market conditions: Rents rising (+1.5%/yr); 58 active listings in the ZIP; 1,867 units permitted in Capitol Planning Region in 2024 (1,399 in 5+ unit buildings).
- At $5,005/mo this rent would consume 115% of the median local household income ($52k/yr) (locally 1897% of renters already pay >50% of income on rent) — very limited rent-growth headroom before tenants either downsize or default.
Forward outlook
- In year one you build about $46k of equity ($3k loan paydown + $43k appreciation (10.0% local appreciation)).
- At projected returns (10.0% appreciation + 1.5% rent growth), your $120k cash investment doubles in ~2 years — after that, you're playing with house money.
- By year 2, paydown + projected appreciation supports a ~$74k cash-out refi (75% LTV) — recoverable capital for the next deal without selling this one.
Negotiation context
- Only 4 days on market — expect competitive offers; lowballing is unlikely to land.
- 4 sale attempts since 25y ago with the ask held roughly flat each time — persistent listings suggest the price (not the market) is what's stuck; bring a comps-based counter.
- Current owner paid $136k; list at $430k implies a 216% gain — meaningful room to come down on a strong offer.
Risks & watch-outs
- Watch-outs: built in 1910 — expect roof / HVAC / electrical / plumbing capex.
- Climate carrying-cost: major flood risk; major wind risk, 27% chance of damaging wind over 30y; extreme-heat days projected 7→16/yr by 2055 (HVAC capex compounding) — expect insurance premiums to compound above CPI over the hold.
Questions for the listing agent
- Can we see the unit-by-unit rent roll, current vacancy, and any below-market leases? What's the average tenancy length?
- What capital expenditures (roof, boiler, parking lot, exteriors) have been made in the last 5 years, and what's planned in the next 2?
- Built in 1910 — when were the roof, HVAC, electrical panel, plumbing, and water heater last replaced?
- Is there a deadline driving the sale (1031 exchange, divorce, estate, relocation)? That informs how much negotiation room exists.
- Schools are D-rated, which usually means shorter tenancies and higher turnover. Who's the typical renter profile here, and what's been the actual vacancy rate?
- Crime grade is F in this area — have there been break-ins, vandalism, or insurance claims at this property in the last 3 years? What carrier currently insures it and at what premium?
- What's the average days-on-market for RENTAL listings here right now (not sales)? A rising rental-DOM trend means longer vacancies and softer asking-rent achievability than the comps imply.
- What's the recent tenant-quality profile in this submarket — average credit score on applications, eviction rate, late-payment / NSF rate, and stable-employment percentage? A property-management company in the area should have these aggregated.
- How much new apartment / multifamily construction is in the pipeline within 1–3 miles? Heavy new supply (>2% of stock underway) typically softens rents 12–24 months out; light construction supports rent growth.
Investment metrics
- 1% rule
- 1.16% ✓
- Cap rate
- 9.18%
- Cash-on-cash
- 10.32%
- DSCR
- 1.46
- GRM
- 7.2
CMA / ARV
No comps found within radius.
Projected returns pro-forma
10.0% appreciation · 1.47% rent growth · sell at horizon
- IRR
- 31.2%
- Equity multiple
- 3.43×
- Total profit
- $292,517
- Equity at exit
- $387,288
- IRR
- 26.5%
- Equity multiple
- 7.61×
- Total profit
- $795,197
- Equity at exit
- $835,201
Cash invested: $120,372 (down + closing). Projections, not guarantees.
Landlord ↔ Tenant lean methodology
- Overall (STATE)
- 27 Tenant-Leaning
- State Connecticut
- 27 Tenant-Leaning · D+7
- County
- — inherits STATE
- City
- — inherits STATE
ZIP-level market 06114
- Home prices YoY
- 4.7%
- Rents YoY
- 1.5%
- Active inventory
- 58
- Price-to-rent
- 14.3×
Monthly cashflow live
- Estimated rent
- $5,005 medium interval (Pro) →
- Mortgage (P&I)
- −$2,254
- Tax from tax record
- −$485 /mo · $5,823/yr
- Insurance
- −$179
- HOA
- −$0
- Vacancy / Maint / Mgmt
- −$1,051
- Net cashflow
- $1,035
Break-even live
Sensitivity live
| Price | -10% $1,278 | -5% $1,157 | +0% $1,035 | +5% $913 | +10% $792 |
|---|---|---|---|---|---|
| Rent | -10% $640 | -5% $837 | +0% $1,035 | +5% $1,233 | +10% $1,431 |
| Rate | -1.0pp $1,252 | -0.5pp $1,144 | base $1,035 | +0.5pp $924 | +1.0pp $810 |
2-unit breakdown (identical units grouped — click to expand)
| Units | Beds | Baths | Est. rent |
|---|---|---|---|
| 2× units | 4 | — | $5,006 |
| #1 | 4 | — | $2,503 |
| #2 | 4 | — | $2,503 |
| Total (2 units) | $5,005 | ||
UW: 25.0% down · 7.5% · 30yr · 1.5% tax · 5.0% vac · 8.0% maint · 8.0% mgmt
Financing live
Cash to close
- Down payment
- $107,475
- Closing costs
- $12,897
- Reserves months
- —
- Total cash needed
- —
Loan-product check · same deal, 3 products live
Conventional
25% down · 7.5% · 30yr
- Down + closing
- —
- Monthly P&I
- —
- Monthly cashflow
- —
- DSCR
- —
- Eligible?
- —
Personal DTI + credit; lowest rate.
DSCR
20% down · 8.5% · 30yr
- Down + closing
- —
- Monthly P&I
- —
- Monthly cashflow
- —
- DSCR
- —
- Eligible?
- —
No personal income docs; deal must DSCR.
Hard money
10% down · 12.0% · 12mo
- Down + closing
- —
- Monthly P&I
- —
- Monthly cashflow
- —
- DSCR
- —
- Eligible?
- —
Short-term bridge; refi at stabilization.
Tax reassessment forecast CT · Partial reset (capped growth)
- Current annual tax
- $5,823 · $485/mo
- Projected year-2 tax
- $7,511 · $626/mo
- Expected delta
- +$1,688/yr (+$141/mo · 29.0%)
ⓘ Screening estimate from a state-policy table — verify with the county assessor before closing.
Climate risk First Street
- Flood 6/10 Major FEMA zone X (unshaded) · 73% chance over 30 yrs
- Wildfire 1/10 Low
- Heat 5/10 Major 7 d/yr ≥97°F today · 16 d/yr by 30 yrs out
- Wind 6/10 Major 27% chance of damaging wind over 30 yrs
- Air quality 3/10 Moderate 3 unhealthy d/yr today · 4 by 30 yrs out
Nearby sold comps map
Loading sold comps map…
Walkable amenities ~0.75 mi
Loading nearby amenities…
Taxation est. · year 1
- Rental income
- $60,060
- − Mortgage interest
- −$24,081
- − Property taxes
- −$5,823
- − Insurance
- −$2,150
- − Repairs & maintenance
- −$4,805
- − Management
- −$4,805
- − Depreciation
- −$12,506
- Taxable income
- $5,891
- Est. tax owed @ 24.0%
- −$1,414
- After-tax cash flow
- $11,008/yr
For passive investors: Depreciation is non-cash, so a rental often shows a tax loss while cash-flowing — sheltering income. Rental losses are passive: they offset passive income freely, and up to $25,000/yr can offset ordinary (W-2) income if you actively participate and your MAGI is under $100k (phasing out to $0 by $150k); unused losses carry forward. On sale, claimed depreciation is recaptured at up to 25%, and gains may owe capital-gains tax (a 1031 exchange can defer both). Figures are a year-1 estimate at your 24.0% rate — not tax advice; consult a CPA.
Schools (NCES district)
- District
- Hartford School District
- NCES district ID
- 0901920
- Math proficiency
- 13% ▼ -5.00%
- Reading proficiency
- 21% ▼ -6.00%
- Median HH income
- $30,521
- Composite
- 13.54/100
- National rank
- #9514
- State rank
- #150 of 153 in CT
Livability — Hartford
- Score
- 76/100
- State rank
- #58
- US rank
- #3553
Category grades
Schools grade is shown separately in the Schools card above.
Census & demographics
- Census place
- Hartford, CT
- County
- Hartford County · 754,208 people
- City population
- 121,162
- Metro
- Hartford-East Hartford-Middletown, CT
- Population (ZIP)
- 26,458
- Household income
- $52,110
- Rent vs Own
- Severe rent burden
- 1897.0
Population outlook (Capitol County) Hauer SSP2
- By 2040
- 1,063,519
Race, ethnicity, and origin ACS 2023
- Neighborhood character
- Diverse neighborhood (Simpson 0.57)
- Race & ethnicity
- Hispanic / Latino 60% White 19% Black 19% Two or more races 10% Native American 1%
- Hispanic origin (detail)
- Mexican 4% Puerto Rican 36% Dominican 6%
- Common ancestry
- American 6% Romanian 1% Lithuanian 1%
- Foreign-born
- 31% · Canada, Jamaica
- Languages at home
- 36% English-only · Spanish 49% Russian/Polish/Slavic 8% Other Indo-European 4%
Political lean MEDSL · Capitol
- 2024 margin
- Strong D (+21.9) · D 60.1% · R 38.2% · Other 1.7%
- All cycles
- 2024: D+21.9
Not yet ingested
- Civics
- —
Market trends
- HPI YoY
- ▲ 16.02%
- Current HPI
- 356.5892
- Rent YoY
- ▲ 1.47%
- Metro
- Hartford-East Hartford-Middletown, CT
- State GDP YoY
- ▲ 1.06%
- F500 in state
- 38
Industry mix (Fortune 500 HQ in CT)
| Industry | F500 HQs | Revenue |
|---|---|---|
| Industrial Machinery | 4 | $38B |
|
||
| Insurance | 3 | $71B |
|
||
| Financial Services | 2 | $25B |
|
||
| Transportation / Logistics | 2 | $18B |
|
||
| Healthcare | 1 | $247B |
|
||
| Telecommunications | 1 | $55B |
|
||
Price history
+186.8% since first listed10 events — show timeline
- 2026-05-29 Pending — Smart MLS
- 2026-05-27 Relisted — Smart MLS
- 2026-05-06 Listing Removed — Smart MLS
- 2026-05-04 Listed $429,900 Smart MLS
- 2010-06-02 Listing Removed — Smart MLS
- 2010-01-26 Listed $265,000 Smart MLS
- 2001-09-20 Sold (Public Records) $136,000 Public Records
- 2001-09-20 Sold (Public Records) $136,000 Public Records
- 2001-09-14 Sold (MLS) $136,000 Smart MLS
- 2001-03-29 Listed $149,900 Smart MLS
Property tax history
+2.6%/yrLatest (2025): $5,823 · +0.0% YoY. Source: county tax records.
Cash-flow waterfall
monthlySold comps — $/sqft
last 12 mo · ≤1 miLoading sold comps…