405 Sunset Rd N · Grove City, FL
Flood risk 7/10 · Major
- FEMA flood zone
- X (shaded)
- Chance of flooding over 30 yrs
- 0.94%
- Est. flood insurance / yr
- $507 – $1,088
Fire risk 3/10 · Minor
- Est. fire insurance / yr
- $947 – $1,759
Heat risk 10/10 · Severe
- Hot days now (above 107°F)
- 7 days/yr
- Hot days in 30 yrs
- 28 days/yr
Wind risk 10/10 · Severe
- Chance of severe wind over 30 yrs
- 99.0%
Air-quality risk 2/10 · Minimal
- Unhealthy air days now
- 1 days/yr
- Unhealthy air days in 30 yrs
- 1 days/yr
Risk factors via First Street. Map © Google.
Why this score? — see what drove the F grade
The composite is a weighted blend of 9 inputs, each scored 0–100. Each bar is that input's sub-score; the figure is the points it added to the 100-point composite (weight × sub-score).
- ARV discount +7.5/15.0
- Appreciation +5.6/10.0
- Cash flow +5.1/30.0
- Schools +4.6/10.0
- Livability +3.2/5.0
- Condition / age +2.5/5.0
- Rent growth +2.4/5.0
- 1% rule +0.9/10.0
- DSCR +0.0/10.0
$380,000
🖨 Deal sheet 📄 Offer letter ✓ Due diligence
Listing remarks MLS
ROTONDA HEIGHTS - An excellent price for a Deed Restricted lot in Rotonda Heights, with excellent access to Englewood beaches, boating, marinas, restaurants, 5 golf courses, low $110 annual fees, I-75 and US 41 (Tamiami Tr).
Key facts
- Tiled walk-in shower
- New construction
- Walk-in closet
Tags
Property features AI
Finance
- Other: Lot about 0.17 acre (approx. 697 m²); Asphalt road access
- HOA & community: HOA required; annual fee $127 (about $10.58/month); Pets allowed
Exterior
- Parking: Attached 2-car garage
- Utilities: Public water; Public sewer; Cable available; Electricity connected; Sewer connected
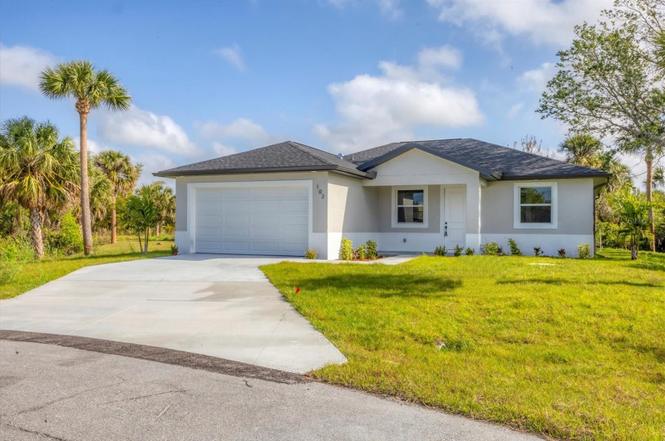
- Home design: Single-family residence; Residential property; Completed condition; One story; North-facing entry
- Construction: Block and stucco construction; Shingle roof; Slab foundation; New construction
- Exterior features: Rear porch; Private mailbox; Sliding doors; Irrigation equipment
Interior
- Kitchen: Dishwasher; Microwave; Range; Refrigerator
- Bedrooms: 3 bedrooms
- Flooring: Ceramic tile
- Bathrooms: 2 full bathrooms
- Heating & cooling: Electric heating; Central air conditioning
- Interior features: Coffered ceilings; High ceilings; Open living room / dining room; Tray ceilings; Walk-in closets
- Laundry & utility: Laundry inside
Neighborhood map
What this means for you Summary
Snapshot
- This is a 3-bed/2.0-bath land listed at $380k.
Deal economics
- At list price, monthly cash flow is $-938 ($-11k/yr) — negative.
- To cash-flow at today's rent, offer at most $244k (35.7% below list).
- To meet the 1% rule (rent ≥ 1% of price), the offer needs to be $223k (41.2% below list).
- Recommended offer: $223k (41.2% below list) — sets the bar for 1% rule.
- Cap rate 3.5% vs local median 2.8% in Grove City — meaningfully above typical; check what's discounted (condition, days-on-market, listing class) to confirm the premium yield is real.
Location & tenants
- Location reads 63/100 on livability (#713 in FL) — a middle-class / working-renter tenant base. Strengths: crime A+, cost of living A+, housing A+; Watch: employment C-, amenities F, commute F.
- Charlotte (suburban): math 54% / reading 54% proficiency, ranked #22 of 73 in FL (top 30%) — acceptable for families but not a draw, mixed tenant base, ~2y average lease.
- Zoned schools: Vineland Elementary School (math 74% / reading 67%, grade A-, #333 of 2,144 statewide, top 16%, 579 students, 45% FRL); Lemon Bay High School (math 50% / reading 56%, grade C-, #148 of 667 statewide, top 23%, 1,360 students, 28% FRL) — zoned schools average 37% FRL vs 54% district-wide (17 pts lower); this property's tenant base skews higher-income than the district average.
- Market conditions: Rents soft (-0.2%/yr); 863 active listings in the ZIP; 27 comparable units currently listed for rent nearby; rentals at typical pace (median 21d on market — plan ~3-4 weeks tenant-placement turnaround); solid renter incomes; 4,585 units permitted in Charlotte County in 2024 (703 in 5+ unit buildings).
Forward outlook
- In year one you build about $7k of equity ($3k loan paydown + $5k appreciation (1.2% local appreciation)).
- Charlotte County population projected at +24% by 2050 — long-run rental-demand tailwind backs the buy-and-hold thesis.
- By year 5, paydown + projected appreciation supports a ~$34k cash-out refi (75% LTV) — recoverable capital for the next deal without selling this one.
Negotiation context
- It's been on market 360 days — a 12% lower offer ($334k) is reasonable based on typical stale-listing flexibility.
- 9 sale attempts since 21y ago; this cycle's ask is 17173% above the opening price — seller raised mid-cycle; expect resistance to lowballs.
- Current owner paid $24k; list at $380k implies a 1483% gain — meaningful room to come down on a strong offer.
Risks & watch-outs
- Watch-outs: flood insurance adds $66/mo.
- Climate carrying-cost: major flood risk; severe wind risk, 99% chance of damaging wind over 30y; extreme-heat days projected 7→28/yr by 2055 (HVAC capex compounding) — expect insurance premiums to compound above CPI over the hold.
Questions for the listing agent
- What do current leases actually rent for vs. the listed asking? Can we see a recent rent roll and the last 12 months of T-12 income?
- It's been on market 360 days. Have you received any prior offers? Is the seller open to a 41% concession, seller financing, or rate buy-down credit?
- What's the actual annual flood-insurance premium (NFIP or private), and is the property in a SFHA with mandatory coverage?
- What does the HOA fee cover, when was the last increase, and are there any pending special assessments or reserve-fund shortfalls?
- Why hasn't it sold? Are there any deal-killer items the seller is aware of (foundation, flood, title, zoning, code violations)?
- Is there a deadline driving the sale (1031 exchange, divorce, estate, relocation)? That informs how much negotiation room exists.
- Schools are F-rated, which usually means shorter tenancies and higher turnover. Who's the typical renter profile here, and what's been the actual vacancy rate?
- The area grade is low — what's the realistic commute time and amenity access for the typical tenant pool here? Any planned neighborhood developments (good or bad) we should know about?
- What's the average days-on-market for RENTAL listings here right now (not sales)? A rising rental-DOM trend means longer vacancies and softer asking-rent achievability than the comps imply.
- What's the recent tenant-quality profile in this submarket — average credit score on applications, eviction rate, late-payment / NSF rate, and stable-employment percentage? A property-management company in the area should have these aggregated.
- How much new for-sale + rental construction is in the pipeline within 1–3 miles? Heavy new supply typically softens prices + rents 12–24 months out; constrained supply supports both.
Investment metrics
- 1% rule
- 0.59% ✗
- Cap rate
- 3.54%
- Cash-on-cash
- -9.83%
- DSCR
- 0.56
- GRM
- 14.2
CMA / ARV
No comps found within radius.
Projected returns pro-forma
1.25% appreciation · 0.0% rent growth · sell at horizon
- IRR
- -10.1%
- Equity multiple
- 0.49×
- Total profit
- $-54,435
- Equity at exit
- $134,694
- IRR
- -5.6%
- Equity multiple
- 0.32×
- Total profit
- $-72,133
- Equity at exit
- $182,901
Cash invested: $106,400 (down + closing). Projections, not guarantees.
Landlord ↔ Tenant lean methodology
- Overall (STATE)
- 87 Strongly Landlord-Friendly
- State Florida
- 87 Strongly Landlord-Friendly · R+3
- County
- — inherits STATE
- City
- — inherits STATE
ZIP-level market 33947
- Home prices YoY
- 0.4%
- Rents YoY
- -0.2%
- Active inventory
- 863
- Price-to-rent
- 14.2×
Monthly cashflow live
- Estimated rent
- $2,234 high interval (Pro) →
- Mortgage (P&I)
- −$1,993
- Tax est. 1.5%
- −$475 /mo · $5,700/yr
- Insurance
- −$158
- Flood insurance flood zone
- −$66 /mo · $798/yr
- HOA
- −$10
- Vacancy / Maint / Mgmt
- −$469
- Net cashflow
- $-938
Break-even live
UW: 25.0% down · 7.5% · 30yr · 1.5% tax · 5.0% vac · 8.0% maint · 8.0% mgmt
Financing live
Cash to close
- Down payment
- $95,000
- Closing costs
- $11,400
- Reserves months
- —
- Total cash needed
- —
Loan-product check · same deal, 3 products live
Conventional
25% down · 7.5% · 30yr
- Down + closing
- —
- Monthly P&I
- —
- Monthly cashflow
- —
- DSCR
- —
- Eligible?
- —
Personal DTI + credit; lowest rate.
DSCR
20% down · 8.5% · 30yr
- Down + closing
- —
- Monthly P&I
- —
- Monthly cashflow
- —
- DSCR
- —
- Eligible?
- —
No personal income docs; deal must DSCR.
Hard money
10% down · 12.0% · 12mo
- Down + closing
- —
- Monthly P&I
- —
- Monthly cashflow
- —
- DSCR
- —
- Eligible?
- —
Short-term bridge; refi at stabilization.
Rent comps 27 comps
| Address | Beds | Baths | Sqft | Rent | $/sqft | DOM | Units | Dist |
|---|---|---|---|---|---|---|---|---|
| 7344 Brookhaven Ter Englewood, FL | 3.0 | 2.0 | 1594 | $2,095 | $1.31 | 21d | 1 | 0.53mi |
| 502 Sunset Rd N Rotonda West, FL | 3.0 | 2.0 | 1636 | $2,100 | $1.28 | 21d | 1 | 0.56mi |
| 8363 Sago Ct Englewood, FL | 2.0 | 2.0 | 1360 | $1,950 | $1.43 | 21d | 1 | 0.60mi |
| 309 Boundary Blvd Unit B Rotonda West, FL | 2.0 | 2.0 | 960 | $1,450 | $1.51 | 21d | 1 | 0.88mi |
| 289 Boundary Blvd Unit 202 Rotonda West, FL | 3.0 | 2.0 | 1168 | $1,645 | $1.41 | 21d | 1 | 0.97mi |
| 6688 San Casa Dr Englewood, FL | 2.0 | 2.0 | 1143 | $1,600 | $1.40 | 21d | 1 | 1.02mi |
| 285 Mark Twain Ln Rotonda West, FL | 3.0 | 2.0 | 1759 | $1,750 | $0.99 | 21d | 1 | 1.03mi |
| 278 Boundary Blvd Unit B Rotonda West, FL | 2.0 | 2.0 | 1138 | $1,625 | $1.43 | 21d | 1 | 1.03mi |
| 9372 San Bernandino Ave Englewood, FL | 2.0 | 2.0 | 1020 | $4,666 | $4.57 | 21d | 1 | 1.07mi |
| 8644 Saint Kitts Cir Englewood, FL | 3.0 | 3.0 | 1849 | $2,095 | $1.13 | 21d | 1 | 1.08mi |
| 6699 San Casa Dr Englewood, FL | 2.0 | 2.0 | 1028 | $1,900 | $1.85 | 21d | 1 | 1.12mi |
| 8613 Seasalt Loop Englewood, FL | 3.0 | 2.0 | 1422 | $3,650 | $2.57 | 21d | 1 | 1.21mi |
| 8716 Saint Kitts Cir Englewood, FL | 3.0 | 2.0 | 1417 | $2,500 | $1.76 | 21d | 1 | 1.21mi |
| 8146 Saint Kitts Cir Englewood, FL | 3.0 | 2.0 | 1635 | $2,400 | $1.47 | 21d | 1 | 1.22mi |
| 8722 Saint Kitts Cir Englewood, FL | 3.0 | 2.0 | 1417 | $2,100 | $1.48 | 21d | 1 | 1.22mi |
| 8787 Saint Kitts Cir Englewood, FL | 3.0 | 2.0 | 1422 | $2,300 | $1.62 | 13d | 1 | 1.27mi |
| 9264 Anita Ave Unit A Englewood, FL | 2.0 | 2.0 | 1008 | $1,400 | $1.39 | 21d | 1 | 1.27mi |
| 9312 Anita Ave Unit B Englewood, FL | 2.0 | 1.0 | 972 | $1,600 | $1.65 | 21d | 1 | 1.28mi |
| 9322 Anita Ave Englewood, FL | 2.0 | 2.0 | 1133 | $1,495 | $1.32 | 21d | 1 | 1.28mi |
| 2643 Lear Rd Englewood, FL | 2.0 | 2.0 | 1206 | $5,800 | $4.81 | 21d | 1 | 1.30mi |
| 4341 Placida Rd #5 Englewood, FL | 2.0 | 2.0 | 1071 | $1,350 | $1.26 | 21d | 1 | 1.33mi |
| 4341 Placida Rd #6 Englewood, FL | 2.0 | 2.0 | 1071 | $1,450 | $1.35 | 21d | 1 | 1.33mi |
| 9416 Anita Ave Englewood, FL | 3.0 | 2.0 | 1162 | $1,750 | $1.51 | 13d | 1 | 1.34mi |
| 226 Boundary Blvd Rotonda West, FL | 2.0 | 2.0 | 1200 | $1,495 | $1.25 | 13d | 1 | 1.36mi |
| 36 Bunker Cir Rotonda West, FL | 2.0 | 2.0 | 1533 | $3,999 | $2.61 | 21d | 1 | 1.42mi |
| 9271 Tacoma Ave Unit B Englewood, FL | 2.0 | 2.0 | 1206 | $1,650 | $1.37 | 21d | 1 | 1.46mi |
| 65 Fairway Rd Rotonda West, FL | 3.0 | 2.0 | 1865 | $2,700 | $1.45 | 21d | 1 | 1.47mi |
HOA detail
- Monthly dues
- $10 · $120/yr
Listing history 39 events
-
2026-06-18days on market $380,000 Active 360 DOM
-
2026-06-17days on market $380,000 Active 359 DOM
-
2026-06-16days on market $380,000 Active 358 DOM
-
2026-06-15days on market $380,000 Active 357 DOM
-
2026-06-14days on market $380,000 Active 355 DOM
-
2026-06-13days on market $380,000 Active 354 DOM
-
2026-06-10days on market $380,000 Active 352 DOM
-
2026-06-09days on market $380,000 Active 351 DOM
-
2026-06-08days on market $380,000 Active 350 DOM
-
2026-06-05days on market $380,000 Active 346 DOM
-
2026-06-02days on market $380,000 Active 344 DOM
-
2026-06-01days on market $380,000 Active 343 DOM
-
2026-05-31days on market $380,000 Active 342 DOM
-
2026-05-30days on market $380,000 Active 341 DOM
-
2026-02-03price $380,000
-
2026-01-03price $393,000
-
2025-12-18price $2,050
-
2025-08-20price $399,000
-
2025-08-14price $2,095
-
2025-07-27$2,200
-
2025-06-23$415,000 Active
-
2025-06-23historical
-
2025-04-03$425,000 Active
-
2024-01-10soldstatus $24,000
-
2023-12-27soldstatus $19,500
-
2023-12-18soldstatus $19,500 Closed 225-char remark
Show marketing remark (225 chars)
ROTONDA HEIGHTS - An excellent price for a Deed Restricted lot in Rotonda Heights, with excellent access to Englewood beaches, boating, marinas, restaurants, 5 golf courses, low $110 annual fees, I-75 and US 41 (Tamiami Tr).
-
2023-10-19status Pending 225-char remark
Show marketing remark (225 chars)
ROTONDA HEIGHTS - An excellent price for a Deed Restricted lot in Rotonda Heights, with excellent access to Englewood beaches, boating, marinas, restaurants, 5 golf courses, low $110 annual fees, I-75 and US 41 (Tamiami Tr).
-
2023-10-17$21,000 Active 225-char remark
Show marketing remark (225 chars)
ROTONDA HEIGHTS - An excellent price for a Deed Restricted lot in Rotonda Heights, with excellent access to Englewood beaches, boating, marinas, restaurants, 5 golf courses, low $110 annual fees, I-75 and US 41 (Tamiami Tr).
-
2023-07-31historical
-
2023-02-01$24,000 Active
-
2020-06-30historical
-
2020-01-02status Active
-
2019-12-28historical
-
2018-06-15$11,500 Active
-
2006-11-03$55,000
-
2005-03-23soldstatus $35,000
-
2005-03-21soldstatus $35,000
-
2005-01-31$35,500
-
2003-05-09soldstatus $5,300
ⓘ Source: listings_history table (triggers on properties + properties_extension) + one-shot
backfill from property_details.listing_events for pre-trigger history.
Climate risk First Street
- Flood 7/10 Severe FEMA zone X (shaded) · 94% chance over 30 yrs
- Wildfire 3/10 Moderate
- Heat 10/10 Extreme 7 d/yr ≥107°F today · 28 d/yr by 30 yrs out
- Wind 10/10 Extreme 99% chance of damaging wind over 30 yrs
- Air quality 2/10 Low 1 unhealthy d/yr today · 1 by 30 yrs out
Nearby sold comps map
Loading sold comps map…
Walkable amenities ~0.75 mi
Loading nearby amenities…
Taxation est. · year 1
- Rental income
- $26,802
- − Mortgage interest
- −$21,286
- − Property taxes
- −$5,700
- − Insurance
- −$2,698
- − Repairs & maintenance
- −$2,144
- − Management
- −$2,144
- − HOA
- −$120
- − Depreciation
- −$11,055
- Taxable loss
- −$18,344
- Est. tax savings @ 24.0%
- +$4,403
- After-tax cash flow
- $-6,854/yr
For passive investors: Depreciation is non-cash, so a rental often shows a tax loss while cash-flowing — sheltering income. Rental losses are passive: they offset passive income freely, and up to $25,000/yr can offset ordinary (W-2) income if you actively participate and your MAGI is under $100k (phasing out to $0 by $150k); unused losses carry forward. On sale, claimed depreciation is recaptured at up to 25%, and gains may owe capital-gains tax (a 1031 exchange can defer both). Figures are a year-1 estimate at your 24.0% rate — not tax advice; consult a CPA.
Schools (NCES district)
- District
- Charlotte
- NCES district ID
- 1200240
- Math proficiency
- 54% ▼ -6.00%
- Reading proficiency
- 54% ▼ -1.00%
- Median HH income
- $44,864
- Composite
- 45.62/100
- National rank
- #2586
- State rank
- #22 of 73 in FL
Livability — Grove City
- Score
- 63/100
- State rank
- #713
- US rank
- #15171
Category grades
Schools grade is shown separately in the Schools card above.
Census & demographics
- County
- Charlotte County · 196,994 people
- City population
- 10,490
- Metro
- Punta Gorda, FL
- Population (ZIP)
- 10,447
- Household income
- $80,091
- Rent vs Own
- Severe rent burden
- 91.0
Population outlook (Charlotte County) Hauer SSP2
- Today (2025)
- 198,646 people
- By 2030
- 210,507 · +6.0%
- By 2040
- 230,857 · +16.2%
- By 2050
- 247,148 · +24.4%
- By 2075
- 281,777 · +41.8%
- By 2100
- 293,609 · +47.8%
Race, ethnicity, and origin ACS 2023
- Neighborhood character
- Predominantly White (96%)
- Race & ethnicity
- White 96% Hispanic / Latino 2% Two or more races 2%
- Common ancestry
- Romanian 5% Lithuanian 4% Slovak 4%
- Foreign-born
- 8% · Canada, Vietnam
- Languages at home
- 93% English-only · Russian/Polish/Slavic 3% Spanish 2% German/W. Germanic 1%
Political lean MEDSL · Charlotte
- 2024 margin
- Solid R (+34.0) · D 32.7% · R 66.7%
- 2008→2024 swing
- -26.7pp toward R · 2008: -7.2pp · 2024: -34.0pp
- All cycles
- 2024: R+34.0 2020: R+26.6 2016: R+27.8 2012: R+14.3 2008: R+7.2
Not yet ingested
- Civics
- —
Market trends
- HPI YoY
- ▲ 1.25%
- Current HPI
- 311.3231
- Rent YoY
- ▼ -0.22%
- Metro
- Punta Gorda, FL
- State GDP YoY
- ▲ 3.28%
- F500 in state
- 36
Industry mix (Fortune 500 HQ in FL)
| Industry | F500 HQs | Revenue |
|---|---|---|
| Industrial Technology | 2 | $29B |
|
||
| Insurance | 2 | $17B |
|
||
| Retail | 1 | $60B |
|
||
| Technology Distribution | 1 | $58B |
|
||
| Homebuilding | 1 | $35B |
|
||
| Technology Manufacturing | 1 | $35B |
|
||
Price history
+7069.8% since first listed25 events — show timeline
- 2026-02-03 Price Changed $380,000 Stellar MLS as Distributed by MLS Grid
- 2026-01-03 Price Changed $393,000 Stellar MLS as Distributed by MLS Grid
- 2025-12-18 Price Changed $2,050 STELLARMLS
- 2025-08-20 Price Changed $399,000 Stellar MLS as Distributed by MLS Grid
- 2025-08-14 Price Changed $2,095 STELLARMLS
- 2025-07-27 Listed for Rent $2,200 STELLARMLS
- 2025-06-23 Listing Removed — Stellar MLS as Distributed by MLS Grid
- 2025-06-23 Listed $415,000 Stellar MLS as Distributed by MLS Grid
- 2025-04-03 Listed $425,000 Stellar MLS as Distributed by MLS Grid
- 2024-01-10 Sold (Public Records) $24,000 Public Records
- 2023-12-27 Sold (Public Records) $19,500 Public Records
- 2023-12-18 Sold (MLS) $19,500 Stellar MLS as Distributed by MLS Grid
- 2023-10-19 Pending — Stellar MLS as Distributed by MLS Grid
- 2023-10-17 Listed $21,000 Stellar MLS as Distributed by MLS Grid
- 2023-07-31 Listing Removed — Stellar MLS as Distributed by MLS Grid
- 2023-02-01 Listed $24,000 Stellar MLS as Distributed by MLS Grid
- 2020-06-30 Listing Removed — Stellar MLS as Distributed by MLS Grid
- 2020-01-02 Relisted — Stellar MLS as Distributed by MLS Grid
- 2019-12-28 Listing Removed — Stellar MLS as Distributed by MLS Grid
- 2018-06-15 Listed $11,500 Stellar MLS as Distributed by MLS Grid
- 2006-11-03 Listed $55,000 Stellar MLS as Distributed by MLS Grid
- 2005-03-23 Sold (Public Records) $35,000 Public Records
- 2005-03-21 Sold (MLS) $35,000 Stellar MLS as Distributed by MLS Grid
- 2005-01-31 Listed $35,500 Stellar MLS as Distributed by MLS Grid
- 2003-05-09 Sold (Public Records) $5,300 Public Records
Property tax history
+9.0%/yrLatest (2025): $544 · +1.6% YoY. Source: county tax records.
Cash-flow waterfall
monthlySold comps — $/sqft
last 12 mo · ≤1 miLoading sold comps…