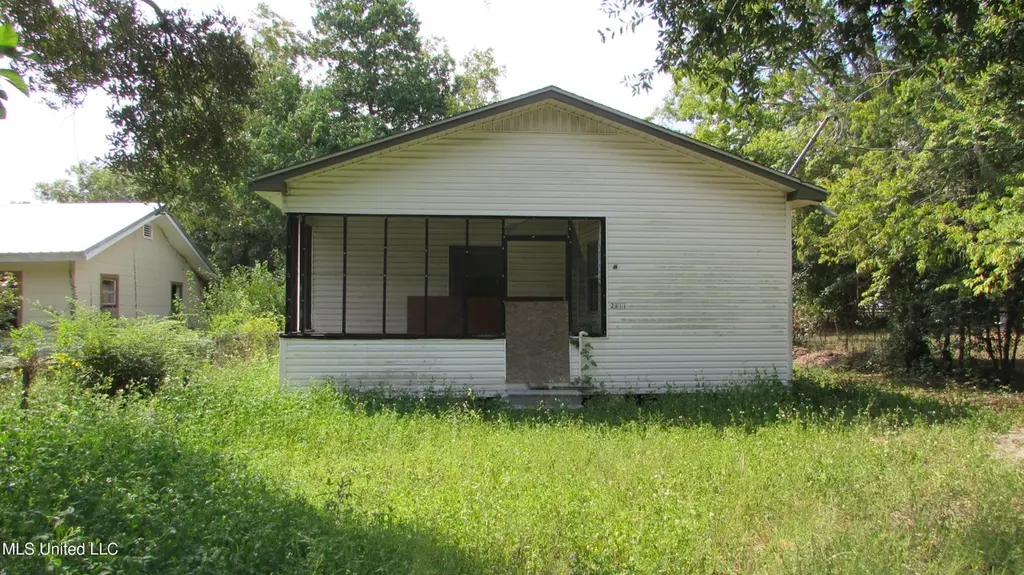
2811 Gulf Ave · Gulfport, MS
Flood risk 1/10 · Minimal
- FEMA flood zone
- X (unshaded)
- Chance of flooding over 30 yrs
- 0.0%
- Est. flood insurance / yr
- $507 – $1,088
Fire risk 3/10 · Minor
- Est. fire insurance / yr
- $1,241 – $2,305
Heat risk 10/10 · Severe
- Hot days now (above 106°F)
- 7 days/yr
- Hot days in 30 yrs
- 23 days/yr
Wind risk 9/10 · Severe
- Chance of severe wind over 30 yrs
- 99.0%
Air-quality risk 1/10 · Minimal
- Unhealthy air days now
- 0 days/yr
- Unhealthy air days in 30 yrs
- 0 days/yr
Risk factors via First Street. Map © Google.
Why this score? — see what drove the B+ grade
The composite is a weighted blend of 9 inputs, each scored 0–100. Each bar is that input's sub-score; the figure is the points it added to the 100-point composite (weight × sub-score).
- Cash flow +30.0/30.0
- ARV discount +15.0/15.0
- 1% rule +10.0/10.0
- DSCR +10.0/10.0
- Rent growth +5.0/5.0
- Livability +3.7/5.0
- Schools +3.4/10.0
- Condition / age +2.5/5.0
- Appreciation +0.0/10.0
$72,000
🖨 Deal sheet (PDF) 📄 Offer letter ✓ Due diligence
Listing remarks MLS
Would be a great investment property but needs TLC. Has good roof. 2801 Gulf also available for sale pkg price for both is $130K. Part of a 28 home pkg.
Key facts
- 6,969 sq ft lot
- Parking
- Built 1940
Neighborhood map
What this means for you Summary
Snapshot
- This is a 2-bed/1.0-bath single-family listed at $72k.
Deal economics
- At list price, monthly cash flow is $449 ($5k/yr) — positive.
- The deal already cash-flows at list — no discount required.
- Meets the 1% rule at list price ($1k rent vs $72k).
- Recommended offer: $63k (12.0% below list) — sets the bar for market timing.
Location & tenants
- Location reads 73/100 on livability (#15 in MS) — a middle-class / working-renter tenant base. Strengths: cost of living A+, housing A+, health & safety A+; Watch: amenities F, commute F, employment F.
- Gulfport School District (urban): math 41% / reading 42% proficiency, ranked #37 of 130 in MS (top 28%) — families likely to look elsewhere, expect single-tenant / working-renter base with shorter leases; 67% free/reduced lunch — lower-income household profile, screen leases tightly.
- Zoned schools: Central Elem (math 19% / reading 31%, grade F, #217 of 375 statewide, top 58%, 480 students, 100% FRL); Gulfport Central Middle School (math 20% / reading 23%, grade F, #109 of 179 statewide, top 62%, 585 students, 100% FRL); Gulfport High School (math 42% / reading 36%, grade F, #54 of 197 statewide, top 28%, 1,728 students, 100% FRL) — zoned schools average 100% FRL vs 67% district-wide (33 pts higher); higher-poverty schools than district average — tighter screening recommended.
- Zoned-school proficiency averages 28% at this address vs 42% district-wide (-13 pts) — the specific schools serving this property underperform the Gulfport School District average; the district grade overstates school quality for this exact location.
- Market conditions: Rents rising fast (+10.5%/yr); 254 active listings in the ZIP; 21 comparable units currently listed for rent nearby; rentals lingering (median 46d on market — plan ~5-8 weeks vacancy on turnover, expect pricing pressure); 57% of comp listings sitting > 30 days — soft ceiling on asking rent; lower-income renter base — watch delinquency; 2,194 units permitted in Harrison County in 2024 (0 in 5+ unit buildings).
Forward outlook
- Local home prices are declining (-3.0%/yr); year-one equity from $498 of loan paydown is wiped out by about $2k of value loss. Plan a longer hold.
- Harrison County population projected at +27% by 2050 — long-run rental-demand tailwind backs the buy-and-hold thesis.
- At projected returns (-3.0% appreciation + 8.0% rent growth), your $20k cash investment doubles in ~4 years — after that, you're playing with house money.
Negotiation context
- It's been on market 279 days — a 12% lower offer ($63k) is reasonable based on typical stale-listing flexibility.
- 3 sale attempts since 13y ago; this cycle's ask has dropped $40k (36%) from the opening price — seller is motivated, your offer sets the floor, not the list.
- Current owner paid $18k; list at $72k implies a 289% gain — meaningful room to come down on a strong offer.
Risks & watch-outs
- Watch-outs: built in 1940 — expect roof / HVAC / electrical / plumbing capex.
- Climate carrying-cost: severe wind risk, 99% chance of damaging wind over 30y; extreme-heat days projected 7→23/yr by 2055 (HVAC capex compounding) — expect insurance premiums to compound above CPI over the hold.
Questions for the listing agent
- It's been on market 279 days. Have you received any prior offers? Is the seller open to a 12% concession, seller financing, or rate buy-down credit?
- Built in 1940 — when were the roof, HVAC, electrical panel, plumbing, and water heater last replaced?
- Why hasn't it sold? Are there any deal-killer items the seller is aware of (foundation, flood, title, zoning, code violations)?
- Is there a deadline driving the sale (1031 exchange, divorce, estate, relocation)? That informs how much negotiation room exists.
- Schools are D-rated, which usually means shorter tenancies and higher turnover. Who's the typical renter profile here, and what's been the actual vacancy rate?
- What's the average days-on-market for RENTAL listings here right now (not sales)? A rising rental-DOM trend means longer vacancies and softer asking-rent achievability than the comps imply.
- What's the recent tenant-quality profile in this submarket — average credit score on applications, eviction rate, late-payment / NSF rate, and stable-employment percentage? A property-management company in the area should have these aggregated.
- How much new for-sale + rental construction is in the pipeline within 1–3 miles? Heavy new supply typically softens prices + rents 12–24 months out; constrained supply supports both.
Investment metrics
- 1% rule
- 1.59% ✓
- Cap rate
- 13.78%
- Cash-on-cash
- 26.72%
- DSCR
- 2.19
- GRM
- 5.2
CMA / ARV
- ARV (median comp)
- $115,658
- List price
- $72,000
- Delta
- -37.75%
- Verdict
- UNDERPRICED
- Comps
- 20 within 1.0 mi
Show comp detail 12 sales within ~0.75 mi
| Address | Dist | Beds/Ba | Sqft | Sold | Price | $/sf | Match |
|---|---|---|---|---|---|---|---|
| 807 27th St | 0.10mi | 2/1.0 | 1,028 (-7%) | 4mo | $102,000 | $99 | 80 |
| 2305 Roberts Ave | 0.41mi | 3/2.0 (+1) | 1,110 (0%) | 3mo | $129,990 | $117 | 69 |
| 2509 6th Ave | 0.34mi | 3/1.5 (+1) | 1,100 (-1%) | 8mo | $145,500 | $132 | 69 |
| 714 Tennessee St | 0.15mi | 3/2.0 (+1) | 1,187 (+7%) | 5mo | $129,900 | $109 | 68 |
| 1021 27th St | 0.34mi | 2/1.0 | 1,000 (-10%) | 4mo | $142,500 | $143 | 64 |
| 1305 29th St | 0.71mi | 3/1.0 (+1) | 1,118 (+1%) | 6mo | $136,000 | $122 | 56 |
| 2515 East Ave | 0.41mi | 2/1.0 | 972 (-12%) | 7mo | $98,500 | $101 | 54 |
| 623 23rd St | 0.47mi | 3/2.0 (+1) | 1,200 (+8%) | 2mo | $169,999 | $142 | 54 |
| 2705 Kelly Ave | 0.44mi | 3/2.0 (+1) | 1,000 (-10%) | 3mo | $125,000 | $125 | 52 |
| 1233 25th St | 0.65mi | 3/1.5 (+1) | 1,144 (+3%) | 7mo | $98,000 | $86 | 52 |
| 2205 Oak Ave | 0.75mi | 3/1.0 (+1) | 1,144 (+3%) | 8mo | $139,900 | $122 | 49 |
| 2905 Audubon Dr | 0.62mi | 3/1.0 (+1) | 949 (-14%) | 1mo | $84,000 | $89 | 41 |
Match score weights: distance 35% · size 25% · config 20% · recency 20%. Top-matched comps best support the ARV.
Projected returns pro-forma
-3.0% appreciation · 8.0% rent growth · sell at horizon
- IRR
- 25.9%
- Equity multiple
- 2.14×
- Total profit
- $22,974
- Equity at exit
- $10,735
- IRR
- 36.4%
- Equity multiple
- 5.18×
- Total profit
- $84,355
- Equity at exit
- $6,225
Cash invested: $20,160 (down + closing). Projections, not guarantees.
Landlord ↔ Tenant lean methodology
- Overall (STATE)
- 90 Strongly Landlord-Friendly
- State Mississippi
- 90 Strongly Landlord-Friendly · R+11
- County
- — inherits STATE
- City
- — inherits STATE
ZIP-level market 39501
- Home prices YoY
- -34.5%
- Rents YoY
- 10.5%
- Active inventory
- 254
- Price-to-rent
- 5.2×
Monthly cashflow live
- Estimated rent
- $1,146 high interval (Pro) →
- Mortgage (P&I)
- −$378
- Tax from tax record
- −$49 /mo · $586/yr
- Insurance
- −$30
- HOA
- −$0
- Vacancy / Maint / Mgmt
- −$241
- Net cashflow
- $449
Break-even live
Sensitivity live
| Price | -10% $490 | -5% $469 | +0% $449 | +5% $429 | +10% $408 |
|---|---|---|---|---|---|
| Rent | -10% $358 | -5% $404 | +0% $449 | +5% $494 | +10% $539 |
| Rate | -1.0pp $485 | -0.5pp $467 | base $449 | +0.5pp $430 | +1.0pp $411 |
UW: 25.0% down · 7.5% · 30yr · 1.5% tax · 5.0% vac · 8.0% maint · 8.0% mgmt
Financing live
Cash to close
- Down payment
- $18,000
- Closing costs
- $2,160
- Reserves months
- —
- Total cash needed
- —
Loan-product check · same deal, 3 products live
Conventional
25% down · 7.5% · 30yr
- Down + closing
- —
- Monthly P&I
- —
- Monthly cashflow
- —
- DSCR
- —
- Eligible?
- —
Personal DTI + credit; lowest rate.
DSCR
20% down · 8.5% · 30yr
- Down + closing
- —
- Monthly P&I
- —
- Monthly cashflow
- —
- DSCR
- —
- Eligible?
- —
No personal income docs; deal must DSCR.
Hard money
10% down · 12.0% · 12mo
- Down + closing
- —
- Monthly P&I
- —
- Monthly cashflow
- —
- DSCR
- —
- Eligible?
- —
Short-term bridge; refi at stabilization.
Rent comps 21 comps
| Address | Beds | Baths | Sqft | Rent | $/sqft | DOM | Units | Dist |
|---|---|---|---|---|---|---|---|---|
| 2823 6th Ave Unit A Gulfport, MS | 3.0 | 2.0 | 1100 | $1,100 | $1.00 | 23d | 1 | 0.17mi |
| 2706 6th Ave Gulfport, MS | 3.0 | 2.0 | 1217 | $1,300 | $1.07 | 23d | 1 | 0.19mi |
| 832 24th St Gulfport, MS | 2.0 | 1.0 | 800 | $950 | $1.19 | 45d | 1 | 0.36mi |
| 2313 5th Ave Gulfport, MS | 2.0 | 1.0 | 750 | $1,000 | $1.33 | 45d | 1 | 0.37mi |
| 2311 5th Ave Gulfport, MS | 3.0 | 1.5 | 1100 | $1,300 | $1.18 | 45d | 1 | 0.38mi |
| 2233 5th Ave Gulfport, MS | 3.0 | 1.0 | 1215 | $1,300 | $1.07 | 45d | 1 | 0.43mi |
| 1224 29th St Gulfport, MS | 2.0 | 2.0 | 1050 | $1,155 | $1.10 | 15d | 1 | 0.54mi |
| 941 22nd St Gulfport, MS | 3.0 | 2.0 | 1450 | $1,600 | $1.10 | 15d | 1 | 0.58mi |
| 124 30th 1/2 St Gulfport, MS | 2.0 | 1.5 | 1007 | $1,100 | $1.09 | 45d | 1 | 0.68mi |
| 3209 F Ave Gulfport, MS | 2.0 | 1.0 | 1000 | $850 | $0.85 | 45d | 1 | 0.71mi |
| 3333 12th Ave Gulfport, MS | 2.0 | 2.0 | 1000 | $899 | $0.90 | 45d | 1 | 0.80mi |
| 3333 12th Ave Unit 6 Gulfport, MS | 2.0 | 2.5 | 1000 | $899 | $0.90 | 45d | 1 | 0.80mi |
| 1400 28th St Gulfport, MS | 2.0–3.0 | 2.0 | 1101 | $943 | $0.86 | 15d | 1 | 0.84mi |
| 2414 15th Ave Gulfport, MS | 2.0 | 1.0 | 818 | $1,000 | $1.22 | 45d | 1 | 0.93mi |
| 2207 16th Ave Gulfport, MS | 2.0 | 1.0 | 1325 | $1,425 | $1.08 | 15d | 1 | 1.10mi |
| 1605 20th St Gulfport, MS | 3.0 | 3.0 | 1350 | $1,095 | $0.81 | 45d | 1 | 1.10mi |
| 3503 Hancock Ave Gulfport, MS | 2.0 | 2.5 | 1100 | $1,100 | $1.00 | 23d | 1 | 1.11mi |
| 2227 17th Ave Gulfport, MS | 2.0 | 1.0 | 1000 | $850 | $0.85 | 45d | 1 | 1.14mi |
| 1511 2nd St Gulfport, MS | 3.0 | 1.5 | 1030 | $2,000 | $1.94 | 45d | 1 | 1.16mi |
| 2110 30th St Gulfport, MS | 2.0 | 2.0 | 950 | $950 | $1.00 | 23d | 1 | 1.40mi |
| 200 Commerce St Gulfport, MS | 2.0 | 1.0 | 900 | $1,100 | $1.22 | 23d | 1 | 1.46mi |
Listing history 25 events
-
2026-06-22days on market $72,000 Active 279 DOM
-
2026-06-18days on market $72,000 Active 276 DOM
-
2026-06-17days on market $72,000 Active 275 DOM
-
2026-06-16days on market $72,000 Active 274 DOM
-
2026-06-15days on market $72,000 Active 273 DOM
-
2026-06-14days on market $72,000 Active 271 DOM
-
2026-06-13days on market $72,000 Active 270 DOM
-
2026-06-10days on market $72,000 Active 268 DOM
-
2026-06-09days on market $72,000 Active 267 DOM
-
2026-06-08days on market $72,000 Active 266 DOM
-
2026-06-07days on market $72,000 Active 265 DOM
-
2026-06-05days on market $72,000 Active 262 DOM
-
2026-06-02days on market $72,000 Active 260 DOM
-
2026-06-01days on market $72,000 Active 259 DOM
-
2026-05-31days on market $72,000 Active 258 DOM
-
2026-05-30days on market $72,000 Active 257 DOM
-
2026-05-01price $72,000 155-char remark
Show marketing remark (155 chars)
Would be a great investment property but needs TLC. Has good roof. 2801 Gulf also available for sale pkg price for both is $130K. Part of a 28 home pkg.
-
2025-11-10price $80,000 155-char remark
Show marketing remark (155 chars)
Would be a great investment property but needs TLC. Has good roof. 2801 Gulf also available for sale pkg price for both is $130K. Part of a 28 home pkg.
-
2025-09-13$112,000 Active 155-char remark
Show marketing remark (155 chars)
Would be a great investment property but needs TLC. Has good roof. 2801 Gulf also available for sale pkg price for both is $130K. Part of a 28 home pkg.
-
2023-11-15historical
-
2022-10-07$115,000 Active
-
2013-04-09soldstatus $18,500
-
2013-04-08soldstatus
-
2013-02-26$29,900
-
2008-11-21soldstatus
ⓘ Source: listings_history table (triggers on properties + properties_extension) + one-shot
backfill from property_details.listing_events for pre-trigger history.
Tax reassessment forecast MS · Resets to sale price
- Current annual tax
- $586 · $49/mo
- Projected year-2 tax
- $586 · $49/mo
- Expected delta
- $0/yr ($0/mo · 0.0%)
ⓘ Screening estimate from a state-policy table — verify with the county assessor before closing.
Climate risk First Street
- Flood 1/10 Low FEMA zone X (unshaded) · 0% chance over 30 yrs
- Wildfire 3/10 Moderate
- Heat 10/10 Extreme 7 d/yr ≥106°F today · 23 d/yr by 30 yrs out
- Wind 9/10 Extreme 99% chance of damaging wind over 30 yrs
- Air quality 1/10 Low 0 unhealthy d/yr today · 0 by 30 yrs out
Nearby sold comps map
Loading sold comps map…
Walkable amenities ~0.75 mi
Loading nearby amenities…
Taxation est. · year 1
- Rental income
- $13,752
- − Mortgage interest
- −$4,033
- − Property taxes
- −$586
- − Insurance
- −$360
- − Repairs & maintenance
- −$1,100
- − Management
- −$1,100
- − Depreciation
- −$2,095
- Taxable income
- $4,478
- Est. tax owed @ 24.0%
- −$1,075
- After-tax cash flow
- $4,312/yr
For passive investors: Depreciation is non-cash, so a rental often shows a tax loss while cash-flowing — sheltering income. Rental losses are passive: they offset passive income freely, and up to $25,000/yr can offset ordinary (W-2) income if you actively participate and your MAGI is under $100k (phasing out to $0 by $150k); unused losses carry forward. On sale, claimed depreciation is recaptured at up to 25%, and gains may owe capital-gains tax (a 1031 exchange can defer both). Figures are a year-1 estimate at your 24.0% rate — not tax advice; consult a CPA.
Schools (NCES district)
- District
- Gulfport School District
- NCES district ID
- 2801710
- Math proficiency
- 41% ▼ -15.00%
- Reading proficiency
- 42% ▼ -6.00%
- Median HH income
- $35,712
- Composite
- 34.38/100
- National rank
- #5213
- State rank
- #37 of 130 in MS
Livability — Gulfport
- Score
- 73/100
- State rank
- #15
- US rank
- #5010
Category grades
Schools grade is shown separately in the Schools card above.
Census & demographics
- Census place
- Gulfport, MS
- County
- Harrison County · 178,171 people
- City population
- 96,188
- Metro
- Gulfport-Biloxi, MS
- Population (ZIP)
- 22,565
- Household income
- $34,758
- Rent vs Own
- Severe rent burden
- 1516.0
Population outlook (Harrison County) Hauer SSP2
- Today (2025)
- 228,444 people
- By 2030
- 241,942 · +5.9%
- By 2040
- 267,531 · +17.1%
- By 2050
- 291,062 · +27.4%
- By 2075
- 346,711 · +51.8%
- By 2100
- 378,165 · +65.5%
Race, ethnicity, and origin ACS 2023
- Neighborhood character
- Diverse neighborhood (Simpson 0.56)
- Race & ethnicity
- Black 59% White 29% Two or more races 7% Hispanic / Latino 5%
- Hispanic origin (detail)
- Mexican 2%
- Common ancestry
- Lithuanian 2% Serbian 1% Slovak 1%
- Foreign-born
- 2% · Canada
- Languages at home
- 95% English-only · Spanish 4%
Political lean MEDSL · Harrison
- 2024 margin
- Strong R (+28.9) · D 35.0% · R 63.9% · Other 1.1%
- 2008→2024 swing
- -2.9pp toward R · 2008: -26.0pp · 2024: -28.9pp
- All cycles
- 2024: R+28.9 2020: R+25.2 2016: R+30.7 2012: R+26.6 2008: R+26.0
Not yet ingested
- Civics
- —
Market trends
- HPI YoY
- ▼ -110.16%
- Current HPI
- 208.998
- Rent YoY
- ▲ 10.49%
- Metro
- Gulfport-Biloxi, MS
- State GDP YoY
- —
- F500 in state
- 0
Price history
+140.8% since first listed9 events — show timeline
- 2026-05-01 Price Changed $72,000 MLSU
- 2025-11-10 Price Changed $80,000 MLSU
- 2025-09-13 Listed $112,000 MLSU
- 2023-11-15 Listing Removed — MLSU
- 2022-10-07 Listed $115,000 MLSU
- 2013-04-09 Sold (Public Records) $18,500 Public Records
- 2013-04-08 Sold (MLS) — MLSU
- 2013-02-26 Listed $29,900 MLSU
- 2008-11-21 Sold (Public Records) — Public Records
Property tax history
+1.6%/yrLatest (2025): $586 · +4.7% YoY. Source: county tax records.
Cash-flow waterfall
monthlySold comps — $/sqft
last 12 mo · ≤1 miLoading sold comps…