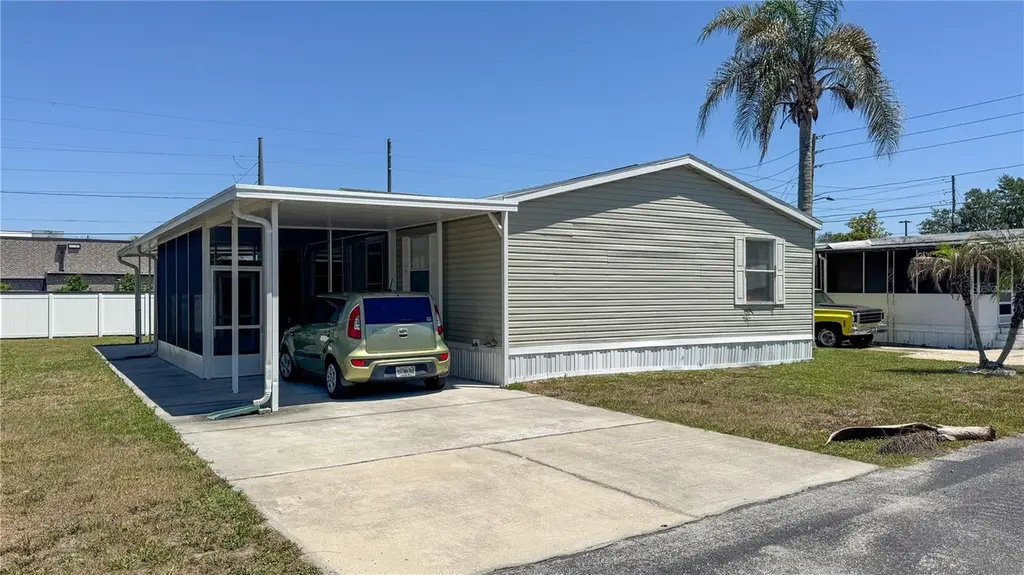
1503 Alby Dr Lot 70 · Apopka, FL
Flood risk 1/10 · Minimal
- FEMA flood zone
- X (unshaded)
- Chance of flooding over 30 yrs
- 0.0%
- Est. flood insurance / yr
- $507 – $1,088
Fire risk 4/10 · Minor
- Est. fire insurance / yr
- $947 – $1,759
Heat risk 9/10 · Severe
- Hot days now (above 108°F)
- 7 days/yr
- Hot days in 30 yrs
- 23 days/yr
Wind risk 9/10 · Severe
- Chance of severe wind over 30 yrs
- 99.0%
Air-quality risk 2/10 · Minimal
- Unhealthy air days now
- 1 days/yr
- Unhealthy air days in 30 yrs
- 2 days/yr
Risk factors via First Street. Map © Google.
Why this score? — see what drove the B- grade
The composite is a weighted blend of 9 inputs, each scored 0–100. Each bar is that input's sub-score; the figure is the points it added to the 100-point composite (weight × sub-score).
- Cash flow +27.2/30.0
- 1% rule +10.0/10.0
- DSCR +9.5/10.0
- ARV discount +7.5/15.0
- Schools +4.1/10.0
- Condition / age +3.8/5.0
- Livability +3.3/5.0
- Rent growth +2.0/5.0
- Appreciation +0.0/10.0
$98,600
🖨 Deal sheet 📄 Offer letter ✓ Due diligence
Listing remarks
Welcome to comfortable and affordable Florida living in the desirable 55+ community of Palm Isle in Apopka! This well-maintained double-wide manufactured home is being offered fully furnished and is truly move-in ready. Featuring 3 bedrooms and 2 bathrooms, the spacious layout offers generous living and dining areas, a large kitchen with center island, abundant cabinetry, and plenty of storage throughout the home. The primary suite includes a private bathroom and ample closet space, while the additional bedrooms provide flexibility for guests, hobbies, or a home office. This home also includes a washer and dryer space, covered carport, storage shed/workshop, and a welcoming covered porch pe
Key facts
- Move-in ready
- Covered carport
- Abundant cabinetry
Tags
Property features AI
Finance
- Other: Lease restrictions apply
- Financial info: Total monthly fees $850 (total annual $10,200); Unit is furnished
- HOA & community: Has HOA (Kimola Hayden) with required approval for purchase; Monthly HOA fee of $850, covers pool and grounds maintenance; Community amenities include clubhouse and pool; On-site property manager; Senior community; Pets allowed
Exterior
- Parking: Carport with 2 spaces
- Security: Gated community
- Utilities: Public water; Public sewer; Electricity available; Water connected
- Home design: Manufactured double wide home; One story; Faces west; Entry level: 1
- Construction: Vinyl siding; Shingle roof; Crawlspace foundation; Other foundation
- Exterior features: Screened side porch; Shed(s); Cul-de-sac lot; Asphalt road surface
Interior
- Kitchen: Dishwasher; Microwave; Range; Refrigerator
- Bedrooms: 3 bedrooms
- Flooring: Vinyl
- Bathrooms: 2 full bathrooms
- Heating & cooling: Central heating; Central air conditioning
- Interior features: Ceiling fans; Kitchen and family room combination; Living room and dining room combination; Storage
- Laundry & utility: Laundry room; Washer
Neighborhood map
What this means for you Summary
Snapshot
- This is a 3-bed/2.0-bath manufactured listed at $99k. Condition is rated good.
Deal economics
- At list price, monthly cash flow is $284 ($3k/yr) — positive.
- The deal already cash-flows at list — no discount required.
- Meets the 1% rule at list price ($2k rent vs $99k).
- Recommended offer: $96k (3.0% below list) — sets the bar for market timing.
- Cap rate 9.7% vs local median 3.7% in Apopka — top-decile yield for the area; either an underpriced asset or a hidden risk that comps aren't pricing in. Stress-test before assuming the spread holds.
Location & tenants
- Location reads 66/100 on livability (#594 in FL) — a middle-class / working-renter tenant base. Strengths: housing A+, cost of living B+, employment B; Watch: schools D+, crime D-, amenities F.
- Orange (suburban): math 46% / reading 51% proficiency, ranked #43 of 73 in FL (top 59%) — families likely to look elsewhere, expect single-tenant / working-renter base with shorter leases.
- Market conditions: Rents soft (-2.1%/yr); 662 active listings in the ZIP; 19 comparable units currently listed for rent nearby; rentals at typical pace (median 14d on market — plan ~3-4 weeks tenant-placement turnaround); solid renter incomes; 8,053 units permitted in Orange County in 2024 (3,133 in 5+ unit buildings).
Forward outlook
- Local home prices are declining (-3.0%/yr); year-one equity from $682 of loan paydown is wiped out by about $3k of value loss. Plan a longer hold.
- Orange County population projected at +52% by 2050 — long-run rental-demand tailwind backs the buy-and-hold thesis.
Negotiation context
- It's been on market 35 days — a 3% lower offer ($96k) is reasonable based on typical stale-listing flexibility.
Risks & watch-outs
- Watch-outs: HOA is 37% of rent.
- Climate carrying-cost: severe wind risk, 99% chance of damaging wind over 30y; extreme-heat days projected 7→23/yr by 2055 (HVAC capex compounding) — expect insurance premiums to compound above CPI over the hold.
Questions for the listing agent
- It's been on market 35 days. Have you received any prior offers? Is the seller open to a 3% concession, seller financing, or rate buy-down credit?
- What does the HOA fee cover, when was the last increase, and are there any pending special assessments or reserve-fund shortfalls?
- Is there a deadline driving the sale (1031 exchange, divorce, estate, relocation)? That informs how much negotiation room exists.
- Schools are D-rated, which usually means shorter tenancies and higher turnover. Who's the typical renter profile here, and what's been the actual vacancy rate?
- Crime grade is D in this area — have there been break-ins, vandalism, or insurance claims at this property in the last 3 years? What carrier currently insures it and at what premium?
- What's the average days-on-market for RENTAL listings here right now (not sales)? A rising rental-DOM trend means longer vacancies and softer asking-rent achievability than the comps imply.
- What's the recent tenant-quality profile in this submarket — average credit score on applications, eviction rate, late-payment / NSF rate, and stable-employment percentage? A property-management company in the area should have these aggregated.
- How much new for-sale + rental construction is in the pipeline within 1–3 miles? Heavy new supply typically softens prices + rents 12–24 months out; constrained supply supports both.
Investment metrics
- 1% rule
- 2.33% ✓
- Cap rate
- 9.74%
- Cash-on-cash
- 12.32%
- DSCR
- 1.55
- GRM
- 3.6
CMA / ARV
No comps found within radius.
Projected returns pro-forma
-3.0% appreciation · 0.0% rent growth · sell at horizon
- IRR
- -4.2%
- Equity multiple
- 0.85×
- Total profit
- $-4,094
- Equity at exit
- $14,702
- IRR
- -3.0%
- Equity multiple
- 0.85×
- Total profit
- $-4,067
- Equity at exit
- $8,525
Cash invested: $27,608 (down + closing). Projections, not guarantees.
Landlord ↔ Tenant lean methodology
- Overall (STATE)
- 87 Strongly Landlord-Friendly
- State Florida
- 87 Strongly Landlord-Friendly · R+3
- County
- — inherits STATE
- City
- — inherits STATE
ZIP-level market 32712
- Home prices YoY
- -34.5%
- Rents YoY
- -2.1%
- Active inventory
- 662
- Price-to-rent
- 3.6×
Monthly cashflow live
- Estimated rent
- $2,297 high interval (Pro) →
- Mortgage (P&I)
- −$517
- Tax est. 1.5%
- −$123 /mo · $1,479/yr
- Insurance
- −$41
- HOA
- −$850
- Vacancy / Maint / Mgmt
- −$482
- Net cashflow
- $284
Break-even live
UW: 25.0% down · 7.5% · 30yr · 1.5% tax · 5.0% vac · 8.0% maint · 8.0% mgmt
Financing live
Cash to close
- Down payment
- $24,650
- Closing costs
- $2,958
- Reserves months
- —
- Total cash needed
- —
Loan-product check · same deal, 3 products live
Conventional
25% down · 7.5% · 30yr
- Down + closing
- —
- Monthly P&I
- —
- Monthly cashflow
- —
- DSCR
- —
- Eligible?
- —
Personal DTI + credit; lowest rate.
DSCR
20% down · 8.5% · 30yr
- Down + closing
- —
- Monthly P&I
- —
- Monthly cashflow
- —
- DSCR
- —
- Eligible?
- —
No personal income docs; deal must DSCR.
Hard money
10% down · 12.0% · 12mo
- Down + closing
- —
- Monthly P&I
- —
- Monthly cashflow
- —
- DSCR
- —
- Eligible?
- —
Short-term bridge; refi at stabilization.
Rent comps 19 comps
| Address | Beds | Baths | Sqft | Rent | $/sqft | DOM | Units | Dist |
|---|---|---|---|---|---|---|---|---|
| 63 Jett Loop Apopka, FL | 3.0 | 2.0 | 1463 | $2,050 | $1.40 | 2d | 1 | 0.23mi |
| 150 Knights Hollow Dr Apopka, FL | 3.0 | 2.0 | 1817 | $2,250 | $1.24 | 17d | 1 | 0.68mi |
| 3 E Sandpiper St Apopka, FL | 3.0 | 2.0 | 1414 | $1,895 | $1.34 | 23d | 1 | 0.77mi |
| 690 N Wells St Apopka, FL | 4.0 | 2.0 | 1711 | $2,285 | $1.34 | 23d | 1 | 1.02mi |
| 1890 Needham Rd Apopka, FL | 3.0 | 2.0 | 1537 | $2,290 | $1.49 | 17d | 1 | 1.13mi |
| 846 Grand Hughey Ct Apopka, FL | 3.0 | 2.0 | 1651 | $2,350 | $1.42 | 4d | 1 | 1.16mi |
| 121 Summerset Dr Apopka, FL | 3.0 | 2.0 | 1155 | $1,971 | $1.71 | 2d | 1 | 1.17mi |
| 574 Autumn Dr Apopka, FL | 4.0 | 2.0 | 1525 | $1,990 | $1.30 | 23d | 1 | 1.26mi |
| 930 Loch Carron #1212 Apopka, FL | 3.0 | 2.0 | 1457 | $2,100 | $1.44 | 4d | 1 | 1.29mi |
| 1270 Deer Lake Cir Apopka, FL | 3.0 | 2.0 | 1781 | $2,800 | $1.57 | 16d | 1 | 1.35mi |
| 220 Bonnie Glen Ln Apopka, FL | 3.0 | 2.0 | 1141 | $2,175 | $1.91 | 4d | 1 | 1.37mi |
| 1045 Palma Verde Pl Apopka, FL | 3.0 | 2.5 | 1863 | $2,200 | $1.18 | 7d | 1 | 1.38mi |
| 1178 N Fairway Dr #1178 Apopka, FL | 2.0 | 2.5 | 1184 | $1,800 | $1.52 | 4d | 1 | 1.38mi |
| 1236 N Fairway Dr Apopka, FL | 3.0 | 2.5 | 1450 | $2,600 | $1.79 | 14d | 1 | 1.41mi |
| 1206 N Fairway Dr #1206 Apopka, FL | 3.0 | 2.5 | 1470 | $1,900 | $1.29 | 14d | 1 | 1.41mi |
| 1123 Palma Verde Pl Apopka, FL | 3.0 | 2.5 | 1644 | $2,149 | $1.31 | 4d | 1 | 1.46mi |
| 440 Breezeway Dr Apopka, FL | 3.0 | 2.0 | 1148 | $1,956 | $1.70 | 21d | 1 | 1.47mi |
| 1148 Palma Verde Pl Apopka, FL | 3.0 | 2.5 | 1658 | $2,200 | $1.33 | 7d | 1 | 1.48mi |
| 1152 Palma Verde Pl Apopka, FL | 3.0 | 2.5 | 1667 | $2,300 | $1.38 | 23d | 1 | 1.49mi |
HOA detail
- Monthly dues
- $850 · $10,200/yr
Listing history 15 events
-
2026-06-18days on market $98,600 Active 35 DOM
-
2026-06-17days on market $98,600 Active 34 DOM
-
2026-06-16days on market $98,600 Active 33 DOM
-
2026-06-15days on market $98,600 Active 32 DOM
-
2026-06-13days on market $98,600 Active 30 DOM
-
2026-06-13days on market $98,600 Active 29 DOM
-
2026-06-09days on market $98,600 Active 26 DOM
-
2026-06-08days on market $98,600 Active 25 DOM
-
2026-06-07days on market $98,600 Active 24 DOM
-
2026-06-04days on market $98,600 Active 21 DOM
-
2026-06-03days on market $98,600 Active 20 DOM
-
2026-06-02days on market $98,600 Active 19 DOM
-
2026-06-01days on market $98,600 Active 18 DOM
-
2026-05-31days on market $98,600 Active 17 DOM
-
2026-05-14$98,600 Active
ⓘ Source: listings_history table (triggers on properties + properties_extension) + one-shot
backfill from property_details.listing_events for pre-trigger history.
Climate risk First Street
- Flood 1/10 Low FEMA zone X (unshaded) · 0% chance over 30 yrs
- Wildfire 4/10 Moderate
- Heat 9/10 Extreme 7 d/yr ≥108°F today · 23 d/yr by 30 yrs out
- Wind 9/10 Extreme 99% chance of damaging wind over 30 yrs
- Air quality 2/10 Low 1 unhealthy d/yr today · 2 by 30 yrs out
Nearby sold comps map
Loading sold comps map…
Walkable amenities ~0.75 mi
Loading nearby amenities…
Taxation est. · year 1
- Rental income
- $27,569
- − Mortgage interest
- −$5,523
- − Property taxes
- −$1,479
- − Insurance
- −$493
- − Repairs & maintenance
- −$2,206
- − Management
- −$2,206
- − HOA
- −$10,200
- − Depreciation
- −$2,868
- Taxable income
- $2,594
- Est. tax owed @ 24.0%
- −$623
- After-tax cash flow
- $2,780/yr
For passive investors: Depreciation is non-cash, so a rental often shows a tax loss while cash-flowing — sheltering income. Rental losses are passive: they offset passive income freely, and up to $25,000/yr can offset ordinary (W-2) income if you actively participate and your MAGI is under $100k (phasing out to $0 by $150k); unused losses carry forward. On sale, claimed depreciation is recaptured at up to 25%, and gains may owe capital-gains tax (a 1031 exchange can defer both). Figures are a year-1 estimate at your 24.0% rate — not tax advice; consult a CPA.
Condition & rehab AI · 12 photos
This move-in ready manufactured home in Palm Isle, Apopka, offers a good condition with minor repairs needed in the kitchen and bathrooms. Upgrades like fresh paint and new cabinets would significantly enhance its value.
Repairs flagged
- Minor Kitchen cabinets — Worn appearance
- Minor Bathroom fixtures — Dated appearance
Value-add opportunities
- Both Paint interior walls — Fresh paint enhances curb appeal and interior aesthetics
- Both Replace kitchen cabinets — New cabinets improve functionality and aesthetics
- Both Replace bathroom fixtures — Modern fixtures enhance functionality and appeal
Renovation cost estimate screening
| Repair item | Severity | Est. cost |
|---|---|---|
| Kitchen cabinets · Worn appearance | Minor | $500–3,000 |
| Bathroom fixtures · Dated appearance | Minor | $500–3,000 |
| Total estimated repair cost · 2 items | $1,000–6,000 |
Value-add ROI direction
- Both Paint interior walls — Fresh paint enhances curb appeal and interior aesthetics ↑
- Both Replace kitchen cabinets — New cabinets improve functionality and aesthetics ↑
- Both Replace bathroom fixtures — Modern fixtures enhance functionality and appeal ↑
ⓘ Cost ranges are severity-bucket heuristics (US national rule-of-thumb). Get contractor quotes + a written scope before underwriting a rehab budget.
Schools (NCES district)
- District
- Orange
- NCES district ID
- 1201440
- Math proficiency
- 46% ▼ -9.00%
- Reading proficiency
- 51% ▼ -2.00%
- Median HH income
- $49,350
- Composite
- 41.47/100
- National rank
- #3461
- State rank
- #43 of 73 in FL
Livability — Apopka
- Score
- 66/100
- State rank
- #594
- US rank
- #11020
Category grades
Schools grade is shown separately in the Schools card above.
Census & demographics
- County
- Orange County · 1,471,359 people
- City population
- 109,852
- Metro
- Orlando-Kissimmee-Sanford, FL
- Population (ZIP)
- 50,583
- Household income
- $108,734
- Rent vs Own
- Severe rent burden
- 876.0
Population outlook (Orange County) Hauer SSP2
- Today (2025)
- 1,618,226 people
- By 2030
- 1,787,404 · +10.5%
- By 2040
- 2,125,621 · +31.4%
- By 2050
- 2,454,016 · +51.6%
- By 2075
- 3,173,711 · +96.1%
- By 2100
- 3,607,781 · +122.9%
Race, ethnicity, and origin ACS 2023
- Neighborhood character
- Diverse neighborhood (Simpson 0.67)
- Race & ethnicity
- White 48% Hispanic / Latino 26% Two or more races 19% Black 16% Asian 4%
- Hispanic origin (detail)
- Mexican 6% Puerto Rican 7% Cuban 2% Dominican 1%
- Common ancestry
- Romanian 2% Lithuanian 1% Slovak 1%
- Foreign-born
- 19% · Canada, Jamaica, China
- Languages at home
- 73% English-only · Spanish 21% Other Indo-European 1% French/Haitian/Cajun 1%
Political lean MEDSL · Orange
- 2024 margin
- D (+13.6) · D 56.1% · R 42.5% · Other 1.3%
- 2008→2024 swing
- -5.0pp toward R · 2008: 18.6pp · 2024: 13.6pp
- All cycles
- 2024: D+13.6 2020: D+23.1 2016: D+24.6 2012: D+18.2 2008: D+18.6
Not yet ingested
- Civics
- —
Market trends
- HPI YoY
- ▼ -149.12%
- Current HPI
- 283.4441
- Rent YoY
- ▼ -2.09%
- Metro
- Orlando-Kissimmee-Sanford, FL
- State GDP YoY
- ▲ 3.28%
- F500 in state
- 36
Industry mix (Fortune 500 HQ in FL)
| Industry | F500 HQs | Revenue |
|---|---|---|
| Industrial Technology | 2 | $29B |
|
||
| Insurance | 2 | $17B |
|
||
| Retail | 1 | $60B |
|
||
| Technology Distribution | 1 | $58B |
|
||
| Homebuilding | 1 | $35B |
|
||
| Technology Manufacturing | 1 | $35B |
|
||
Price history
1 event — show timeline
- 2026-05-14 Listed $98,600 Stellar MLS as Distributed by MLS Grid
Cash-flow waterfall
monthlySold comps — $/sqft
last 12 mo · ≤1 miLoading sold comps…