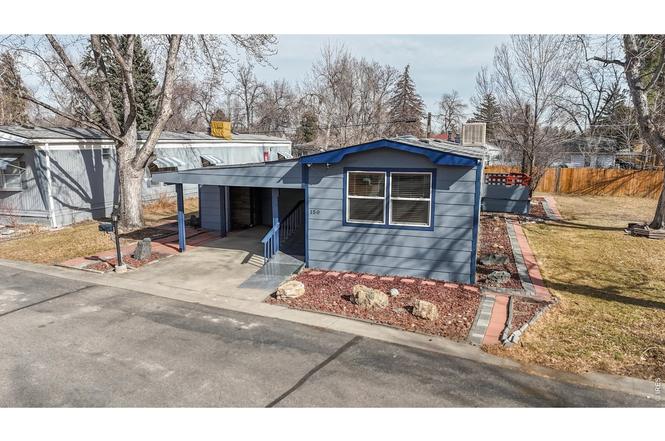
2211 W Mulberry St #150 · Fort Collins, CO
Flood risk 1/10 · Minimal
- FEMA flood zone
- X (unshaded)
- Chance of flooding over 30 yrs
- 0.0%
- Est. flood insurance / yr
- $507 – $1,088
Fire risk 7/10 · Major
- Est. fire insurance / yr
- $939 – $1,743
Heat risk 3/10 · Minor
- Hot days now (above 91°F)
- 7 days/yr
- Hot days in 30 yrs
- 18 days/yr
Wind risk 1/10 · Minimal
- Chance of severe wind over 30 yrs
- —
Air-quality risk 6/10 · Moderate
- Unhealthy air days now
- 13 days/yr
- Unhealthy air days in 30 yrs
- 13 days/yr
Risk factors via First Street. Map © Google.
Why this score? — see what drove the B+ grade
The composite is a weighted blend of 9 inputs, each scored 0–100. Each bar is that input's sub-score; the figure is the points it added to the 100-point composite (weight × sub-score).
- Cash flow +30.0/30.0
- ARV discount +15.0/15.0
- 1% rule +10.0/10.0
- DSCR +10.0/10.0
- Schools +4.5/10.0
- Livability +4.0/5.0
- Rent growth +3.8/5.0
- Condition / age +2.5/5.0
- Appreciation +0.0/10.0
$49,000
🖨 Deal sheet (PDF) 📄 Offer letter ✓ Due diligence
Listing remarks
Welcome to Skyline 55+ Mobile Home Park! This beautifully updated home is located in one of Fort Collins' premier senior living communities, offering exceptional amenities and a welcoming neighborhood feel. This home with cabin like charm will wow you with its decor. The home features 2 bedrooms plus a bonus or 3rd bedroom (non-conforming). The kitchen includes updated stainless-steel appliances and upgraded counter-tops while the bedrooms have newer carpet and paint. Adjacent to the carport is a huge, insulated workshop with electric and heating as well as a large storage room with shelving. Enjoy your morning coffee while sitting on the deck watching the squirrels play, and in the evening
Key facts
- Rv parking
- Private back patio
- Large storage room
Tags
Property features AI
Finance
- Other: Minimal flood risk (C rating)
- HOA & community: No association fees
Exterior
- Parking: Carport; RV access/parking
- Utilities: City water (meter installed); Public sewer; Natural gas available (XCEL); Electricity available; Cable available; Satellite available; High-speed internet available; Trash service by Republic
- Home design: Manufactured in park (mobile home); Level lot; Level drive
- Construction: Frame construction; Composition roof
- Exterior features: Patio; Deck; Storage building; Land lease; House faces west; Paved surfaces; Sidewalks; Street lights; Near bus
Interior
- Kitchen: Gas range; Dishwasher; Refrigerator
- Bedrooms: 2 bedrooms; All bedrooms conforming
- Flooring: Low carpet
- Bathrooms: 1 full bathroom
- Heating & cooling: Forced air heating; Evaporative cooling
- Interior features: Eat-in kitchen; Workshop; Pantry; Skylights; Window coverings
Neighborhood map
What this means for you Summary
Snapshot
- This is a 2-bed/2.0-bath manufactured listed at $49k.
Deal economics
- At list price, monthly cash flow is $1k ($12k/yr) — positive.
- The deal already cash-flows at list — no discount required.
- Meets the 1% rule at list price ($2k rent vs $49k).
- Recommended offer: $45k (9.0% below list) — sets the bar for market timing.
- Cap rate 31.2% vs local median 2.6% in Fort Collins — top-decile yield for the area; either an underpriced asset or a hidden risk that comps aren't pricing in. Stress-test before assuming the spread holds.
Location & tenants
- Location reads 80/100 on livability (#11 in CO, #1,750 nationally) — a professional / high-income tenant draw. Strengths: amenities A+, commute A+, health & safety A+; Watch: cost of living F.
- Poudre School District R-1 (urban): math 45% / reading 60% proficiency, ranked #10 of 86 in CO (top 12%) — acceptable for families but not a draw, mixed tenant base, ~2y average lease.
- Zoned schools: Bauder Elementary School (math 32% / reading 47%, grade F, #357 of 966 statewide, top 40%, 495 students, 48% FRL); Kinard Core Knowledge Middle School (math 61% / reading 77%, grade A, #8 of 270 statewide, top 3%, 748 students, 7% FRL); Poudre High School (math 36% / reading 59%, grade D, #131 of 381 statewide, top 34%, 1,663 students, 38% FRL).
- Market conditions: Rents rising fast (+5.0%/yr); 117 active listings in the ZIP; 35 comparable units currently listed for rent nearby; rentals at typical pace (median 16d on market — plan ~3-4 weeks tenant-placement turnaround); 1,786 units permitted in Larimer County in 2024 (402 in 5+ unit buildings).
- This rent runs 34% of the median local income ($58k/yr) — at the standard rent-burdened threshold; future hikes will face affordability resistance.
Forward outlook
- Local home prices are declining (-3.0%/yr); year-one equity from $339 of loan paydown is wiped out by about $1k of value loss. Plan a longer hold.
- Larimer County population projected at +51% by 2050 — long-run rental-demand tailwind backs the buy-and-hold thesis.
- At projected returns (-3.0% appreciation + 5.0% rent growth), your $14k cash investment doubles in ~2 years — after that, you're playing with house money.
Negotiation context
- It's been on market 115 days — a 9% lower offer ($45k) is reasonable based on typical stale-listing flexibility.
Risks & watch-outs
- Climate carrying-cost: major wildfire risk — expect insurance premiums to compound above CPI over the hold.
Questions for the listing agent
- It's been on market 115 days. Have you received any prior offers? Is the seller open to a 9% concession, seller financing, or rate buy-down credit?
- Built in 1972 — when were the roof, HVAC, electrical panel, plumbing, and water heater last replaced?
- Why hasn't it sold? Are there any deal-killer items the seller is aware of (foundation, flood, title, zoning, code violations)?
- Is there a deadline driving the sale (1031 exchange, divorce, estate, relocation)? That informs how much negotiation room exists.
- Schools are B-rated — typically a magnet for longer-tenancy family renters. What's the average tenant stay here, and is there a school-zone premium baked into asking?
- What's the average days-on-market for RENTAL listings here right now (not sales)? A rising rental-DOM trend means longer vacancies and softer asking-rent achievability than the comps imply.
- What's the recent tenant-quality profile in this submarket — average credit score on applications, eviction rate, late-payment / NSF rate, and stable-employment percentage? A property-management company in the area should have these aggregated.
- How much new for-sale + rental construction is in the pipeline within 1–3 miles? Heavy new supply typically softens prices + rents 12–24 months out; constrained supply supports both.
Investment metrics
- 1% rule
- 3.37% ✓
- Cap rate
- 31.21%
- Cash-on-cash
- 89.01%
- DSCR
- 4.96
- GRM
- 2.5
CMA / ARV
- ARV (on-the-fly)
- $86,856
- Comps found
- 4
Show comp detail 4 sales within ~0.75 mi
| Address | Dist | Beds/Ba | Sqft | Sold | Price | $/sf | Match |
|---|---|---|---|---|---|---|---|
| 2211 W Mulberry St #95 | 0.00mi | 2/2.0 | 960 (+4%) | 9mo | $99,500 | $104 | 86 |
| 2211 W Mulberry St #52 | 0.00mi | 3/2.0 (+1) | 920 (-0%) | 10mo | $84,000 | $91 | 86 |
| 2211 W Mulberry St #264 | 0.00mi | 3/2.0 (+1) | 980 (+6%) | 7mo | $62,500 | $64 | 79 |
| 2211 W Mulberry St #56 | 0.00mi | 2/2.0 | 1,056 (+14%) | 13mo | $99,000 | $94 | 65 |
Match score weights: distance 35% · size 25% · config 20% · recency 20%. Top-matched comps best support the ARV.
Projected returns pro-forma
-3.0% appreciation · 5.0% rent growth · sell at horizon
- IRR
- 91.8%
- Equity multiple
- 5.39×
- Total profit
- $60,254
- Equity at exit
- $7,306
- IRR
- 95.1%
- Equity multiple
- 11.96×
- Total profit
- $150,381
- Equity at exit
- $4,237
Cash invested: $13,720 (down + closing). Projections, not guarantees.
Landlord ↔ Tenant lean methodology
- Overall (STATE)
- 38 Tenant-Leaning
- State Colorado
- 38 Tenant-Leaning · D+4
- County
- — inherits STATE
- City
- — inherits STATE
ZIP-level market 80521
- Rents YoY
- 5.0%
- Active inventory
- 117
- Price-to-rent
- 2.5×
Monthly cashflow live
- Estimated rent
- $1,651 high interval (Pro) →
- Mortgage (P&I)
- −$257
- Tax from tax record
- −$9 /mo · $110/yr
- Insurance
- −$20
- HOA
- −$0
- Vacancy / Maint / Mgmt
- −$347
- Net cashflow
- $1,018
Break-even live
Sensitivity live
| Price | -10% $1,045 | -5% $1,031 | +0% $1,018 | +5% $1,004 | +10% $990 |
|---|---|---|---|---|---|
| Rent | -10% $887 | -5% $952 | +0% $1,018 | +5% $1,083 | +10% $1,148 |
| Rate | -1.0pp $1,042 | -0.5pp $1,030 | base $1,018 | +0.5pp $1,005 | +1.0pp $992 |
UW: 25.0% down · 7.5% · 30yr · 1.5% tax · 5.0% vac · 8.0% maint · 8.0% mgmt
Financing live
Cash to close
- Down payment
- $12,250
- Closing costs
- $1,470
- Reserves months
- —
- Total cash needed
- —
Loan-product check · same deal, 3 products live
Conventional
25% down · 7.5% · 30yr
- Down + closing
- —
- Monthly P&I
- —
- Monthly cashflow
- —
- DSCR
- —
- Eligible?
- —
Personal DTI + credit; lowest rate.
DSCR
20% down · 8.5% · 30yr
- Down + closing
- —
- Monthly P&I
- —
- Monthly cashflow
- —
- DSCR
- —
- Eligible?
- —
No personal income docs; deal must DSCR.
Hard money
10% down · 12.0% · 12mo
- Down + closing
- —
- Monthly P&I
- —
- Monthly cashflow
- —
- DSCR
- —
- Eligible?
- —
Short-term bridge; refi at stabilization.
Rent comps 35 comps
| Address | Beds | Baths | Sqft | Rent | $/sqft | DOM | Units | Dist |
|---|---|---|---|---|---|---|---|---|
| 2155 Orchard Pl Fort Collins, CO | 2.0 | 2.0 | 790 | $1,718 | $2.17 | 15d | 9 | 0.12mi |
| 901 S Taft Hill Rd Fort Collins, CO | 2.0 | 1.0 | 700 | $1,399 | $2.00 | 25d | 1 | 0.15mi |
| 2226 W Elizabeth St Fort Collins, CO | 2.0–3.0 | 2.0 | 1012 | $1,695 | $1.67 | 15d | 4 | 0.17mi |
| 921 Glenmoor Dr Fort Collins, CO | 2.0–3.0 | 1.0 | 680 | $1,379 | $2.03 | 15d | 4 | 0.23mi |
| 2416 Clearview Ave Unit 2416-1 Fort Collins, CO | 2.0 | 1.0 | 792 | $1,300 | $1.64 | 15d | 1 | 0.51mi |
| 2420 Clearview Ave Unit 4 Fort Collins, CO | 2.0 | 1.0 | 864 | $1,500 | $1.74 | 25d | 1 | 0.52mi |
| 155 Briarwood Rd Fort Collins, CO | 1.0–3.0 | 1.0–1.5 | 647 | $1,406 | $2.17 | 15d | 30 | 0.65mi |
| 1940 Larkspur Dr Unit 1 Fort Collins, CO | 1.0 | 1.0 | 625 | $895 | $1.43 | 25d | 1 | 0.70mi |
| 1850 Laporte Ave Fort Collins, CO | 1.0 | 1.0 | 537 | $1,395 | $2.60 | 15d | 4 | 0.85mi |
| 1850 Laporte Ave Unit a5 Fort Collins, CO | 1.0 | 1.0 | 575 | $1,395 | $2.43 | 25d | 1 | 0.87mi |
| 710 City Park Ave Unit D431 Fort Collins, CO | 2.0 | 1.0 | 966 | $1,600 | $1.66 | 15d | 1 | 0.88mi |
| 1113 W Plum St Fort Collins, CO | 1.0 | 1.0 | 486 | $928 | $1.91 | 15d | 75 | 0.98mi |
| 1208 W Elizabeth St Fort Collins, CO | 2.0–5.0 | 2.0–5.0 | 1282 | $793 | $0.62 | 25d | 10 | 0.99mi |
| 305 Scott Ave Apt B Fort Collins, CO | 1.0 | 1.0 | 600 | $1,395 | $2.33 | 25d | 1 | 1.05mi |
| 1624 Azalea Dr Unit 1- 214-1 Fort Collins, CO | 2.0 | 1.5 | 1093 | $1,395 | $1.28 | 15d | 1 | 1.12mi |
| 1628 Azalea Dr Unit 2- 215-2 Fort Collins, CO | 3.0 | 1.0 | 952 | $1,595 | $1.68 | 15d | 1 | 1.14mi |
| 1718 Larch St Unit 2 Fort Collins, CO | 2.0 | 1.0 | 850 | $1,395 | $1.64 | 25d | 1 | 1.17mi |
| 1121 W Prospect Rd Fort Collins, CO | 1.0–2.0 | 1.0 | 755 | $1,574 | $2.08 | 25d | 10 | 1.21mi |
| 1305 Burton Ct Apt 4 Fort Collins, CO | 1.0 | 1.0 | 576 | $1,245 | $2.16 | 15d | 1 | 1.23mi |
| 1313 Burton Ct Unit 3 Fort Collins, CO | 1.0 | 1.0 | 650 | $1,298 | $2.00 | 15d | 1 | 1.24mi |
| 2901 Sumac St Unit B 212-2 Fort Collins, CO | 2.0 | 1.0 | 1026 | $1,295 | $1.26 | 15d | 1 | 1.24mi |
| 1924 Ross Ct Unit A Fort Collins, CO | 2.0 | 1.5 | 900 | $1,743 | $1.94 | 15d | 1 | 1.26mi |
| 918 James Ct Unit 1 Fort Collins, CO | 1.0 | 1.0 | 652 | $1,175 | $1.80 | 25d | 1 | 1.27mi |
| 923 James Ct Unit 1 Fort Collins, CO | 1.0 | 1.0 | 634 | $1,195 | $1.88 | 25d | 1 | 1.27mi |
| 1931 Ross Ct Unit 3 Fort Collins, CO | 2.0 | 1.0 | 658 | $1,595 | $2.42 | 15d | 1 | 1.30mi |
| 2912 Somerville Dr Unit 4 Fort Collins, CO | 2.0 | 1.0 | 762 | $1,430 | $1.88 | 25d | 1 | 1.30mi |
| 3024 Sumac St Fort Collins, CO | 2.0 | 1.0 | 700 | $1,425 | $2.04 | 25d | 1 | 1.30mi |
| 3024 Sumac St Fort Collins, CO | 2.0 | 1.0 | 800 | $1,425 | $1.78 | 15d | 1 | 1.30mi |
| 1742 Heritage Cir Fort Collins, CO | 1.0–4.0 | 1.0–1.5 | 866 | $1,781 | $2.06 | 15d | 10 | 1.32mi |
| 1942 Pecan St Unit 2 Fort Collins, CO | 2.0 | 1.0 | 720 | $1,450 | $2.01 | 25d | 1 | 1.39mi |
| 1814 Belmar Dr Fort Collins, CO | 2.0 | 1.5 | 810 | $1,695 | $2.09 | 25d | 1 | 1.42mi |
| 1052 Hobbit St Fort Collins, CO | 1.0–3.0 | 1.0–2.0 | 442 | $1,212 | $2.74 | 15d | 57 | 1.43mi |
| 1050 Hobbit St Fort Collins, CO | 1.0–3.0 | 1.0–2.0 | 810 | $1,127 | $1.39 | 25d | 11 | 1.46mi |
| 1917 S Shields St Fort Collins, CO | 2.0 | 1.0 | 800 | $1,475 | $1.84 | 25d | 1 | 1.46mi |
| 308 West St Fort Collins, CO | 2.0 | 1.0 | 719 | $1,500 | $2.09 | 25d | 1 | 1.47mi |
Listing history 17 events
-
2026-06-21days on market $49,000 Active 115 DOM
-
2026-06-18days on market $49,000 Active 112 DOM
-
2026-06-17days on market $49,000 Active 111 DOM
-
2026-06-16days on market $49,000 Active 110 DOM
-
2026-06-15days on market $49,000 Active 109 DOM
-
2026-06-14days on market $49,000 Active 107 DOM
-
2026-06-10days on market $49,000 Active 104 DOM
-
2026-06-09days on market $49,000 Active 103 DOM
-
2026-06-08days on market $49,000 Active 102 DOM
-
2026-06-07days on market $49,000 Active 101 DOM
-
2026-06-03days on market $49,000 Active 97 DOM
-
2026-06-02pricedays on market $49,000 Active 96 DOM
-
2026-06-01days on market $58,000 Active 95 DOM
-
2026-05-31days on market $58,000 Active 94 DOM
-
2026-05-30days on market $58,000 Active 93 DOM
-
2026-04-13price $58,000
-
2026-02-26$70,000 Active
ⓘ Source: listings_history table (triggers on properties + properties_extension) + one-shot
backfill from property_details.listing_events for pre-trigger history.
Tax reassessment forecast CO · Resets to sale price
- Current annual tax
- $110 · $9/mo
- Projected year-2 tax
- $270 · $22/mo
- Expected delta
- +$159/yr (+$13/mo · 144.8%)
ⓘ Screening estimate from a state-policy table — verify with the county assessor before closing.
Climate risk First Street
- Flood 1/10 Low FEMA zone X (unshaded) · 0% chance over 30 yrs
- Wildfire 7/10 Severe
- Heat 3/10 Moderate 7 d/yr ≥91°F today · 18 d/yr by 30 yrs out
- Wind 1/10 Low
- Air quality 6/10 Major 13 unhealthy d/yr today · 13 by 30 yrs out
Nearby sold comps map
Loading sold comps map…
Walkable amenities ~0.75 mi
Loading nearby amenities…
Taxation est. · year 1
- Rental income
- $19,810
- − Mortgage interest
- −$2,745
- − Property taxes
- −$110
- − Insurance
- −$245
- − Repairs & maintenance
- −$1,585
- − Management
- −$1,585
- − Depreciation
- −$1,425
- Taxable income
- $12,115
- Est. tax owed @ 24.0%
- −$2,908
- After-tax cash flow
- $9,304/yr
For passive investors: Depreciation is non-cash, so a rental often shows a tax loss while cash-flowing — sheltering income. Rental losses are passive: they offset passive income freely, and up to $25,000/yr can offset ordinary (W-2) income if you actively participate and your MAGI is under $100k (phasing out to $0 by $150k); unused losses carry forward. On sale, claimed depreciation is recaptured at up to 25%, and gains may owe capital-gains tax (a 1031 exchange can defer both). Figures are a year-1 estimate at your 24.0% rate — not tax advice; consult a CPA.
Schools (NCES district)
- District
- Poudre School District R-1
- NCES district ID
- 0803990
- Math proficiency
- 45% ▼ -7.00%
- Reading proficiency
- 60% ▼ -2.00%
- Median HH income
- $57,281
- Composite
- 45.5/100
- National rank
- #2610
- State rank
- #10 of 86 in CO
Livability — Fort Collins
- Score
- 80/100
- State rank
- #11
- US rank
- #1750
Category grades
Schools grade is shown separately in the Schools card above.
Census & demographics
- Census place
- Fort Collins, CO
- County
- Larimer County · 338,255 people
- City population
- 202,303
- Metro
- Fort Collins, CO
- Population (ZIP)
- 38,776
- Household income
- $58,082
- Rent vs Own
- Severe rent burden
- 3630.0
Population outlook (Larimer County) Hauer SSP2
- Today (2025)
- 415,361 people
- By 2030
- 457,762 · +10.2%
- By 2040
- 542,310 · +30.6%
- By 2050
- 627,048 · +51.0%
- By 2075
- 833,722 · +100.7%
- By 2100
- 952,590 · +129.3%
Race, ethnicity, and origin ACS 2023
- Neighborhood character
- Predominantly White (78%)
- Race & ethnicity
- White 78% Hispanic / Latino 11% Two or more races 8% Asian 4% Black 2% Native American 1%
- Hispanic origin (detail)
- Mexican 6%
- Common ancestry
- Portuguese 3% Italian 3% Slovak 3%
- Foreign-born
- 5% · China, Canada
- Languages at home
- 91% English-only · Spanish 5% Chinese 1% French/Haitian/Cajun 1%
Political lean MEDSL · Larimer
- 2024 margin
- D (+17.6) · D 57.4% · R 39.8% · Other 2.9%
- 2008→2024 swing
- +7.9pp toward D · 2008: 9.7pp · 2024: 17.6pp
- All cycles
- 2024: D+17.6 2020: D+15.4 2016: D+4.9 2012: D+5.2 2008: D+9.7
Not yet ingested
- Civics
- —
Market trends
- HPI YoY
- ▼ -686.60%
- Current HPI
- 301.4833
- Rent YoY
- ▲ 5.00%
- Metro
- Fort Collins, CO
- State GDP YoY
- ▲ 1.95%
- F500 in state
- 14
Industry mix (Fortune 500 HQ in CO)
| Industry | F500 HQs | Revenue |
|---|---|---|
| Technology Distribution | 1 | $31B |
|
||
| Food / Agriculture | 1 | $18B |
|
||
| Packaging | 1 | $14B |
|
||
| Healthcare | 1 | $13B |
|
||
| Energy | 1 | $10B |
|
||
| Technology | 1 | $4B |
|
||
Price history
-17.1% since first listed2 events — show timeline
- 2026-04-13 Price Changed $58,000 IRES
- 2026-02-26 Listed $70,000 IRES
Property tax history
+10.6%/yrLatest (2021): $110 · +18.4% YoY. Source: county tax records.
Cash-flow waterfall
monthlySold comps — $/sqft
last 12 mo · ≤1 miLoading sold comps…