None · Union City, CA
Flood risk 5/10 · Moderate
- FEMA flood zone
- X (unshaded)
- Chance of flooding over 30 yrs
- 0.55%
- Est. flood insurance / yr
- $507 – $1,088
Fire risk 1/10 · Minimal
- Est. fire insurance / yr
- $659 – $1,223
Heat risk 4/10 · Minor
- Hot days now (above 89°F)
- 7 days/yr
- Hot days in 30 yrs
- 14 days/yr
Wind risk 1/10 · Minimal
- Chance of severe wind over 30 yrs
- —
Air-quality risk 7/10 · Major
- Unhealthy air days now
- 12 days/yr
- Unhealthy air days in 30 yrs
- 12 days/yr
Risk factors via First Street. Map © Google.
Why this score? — see what drove the C- grade
The composite is a weighted blend of 9 inputs, each scored 0–100. Each bar is that input's sub-score; the figure is the points it added to the 100-point composite (weight × sub-score).
- Cash flow +23.7/30.0
- DSCR +7.6/10.0
- 1% rule +6.2/10.0
- Schools +5.1/10.0
- Livability +3.7/5.0
- Rent growth +3.4/5.0
- Condition / age +2.5/5.0
- ARV discount +0.6/15.0
- Appreciation +0.0/10.0
$330,000
🖨 Deal sheet (PDF) 📄 Offer letter ✓ Due diligence
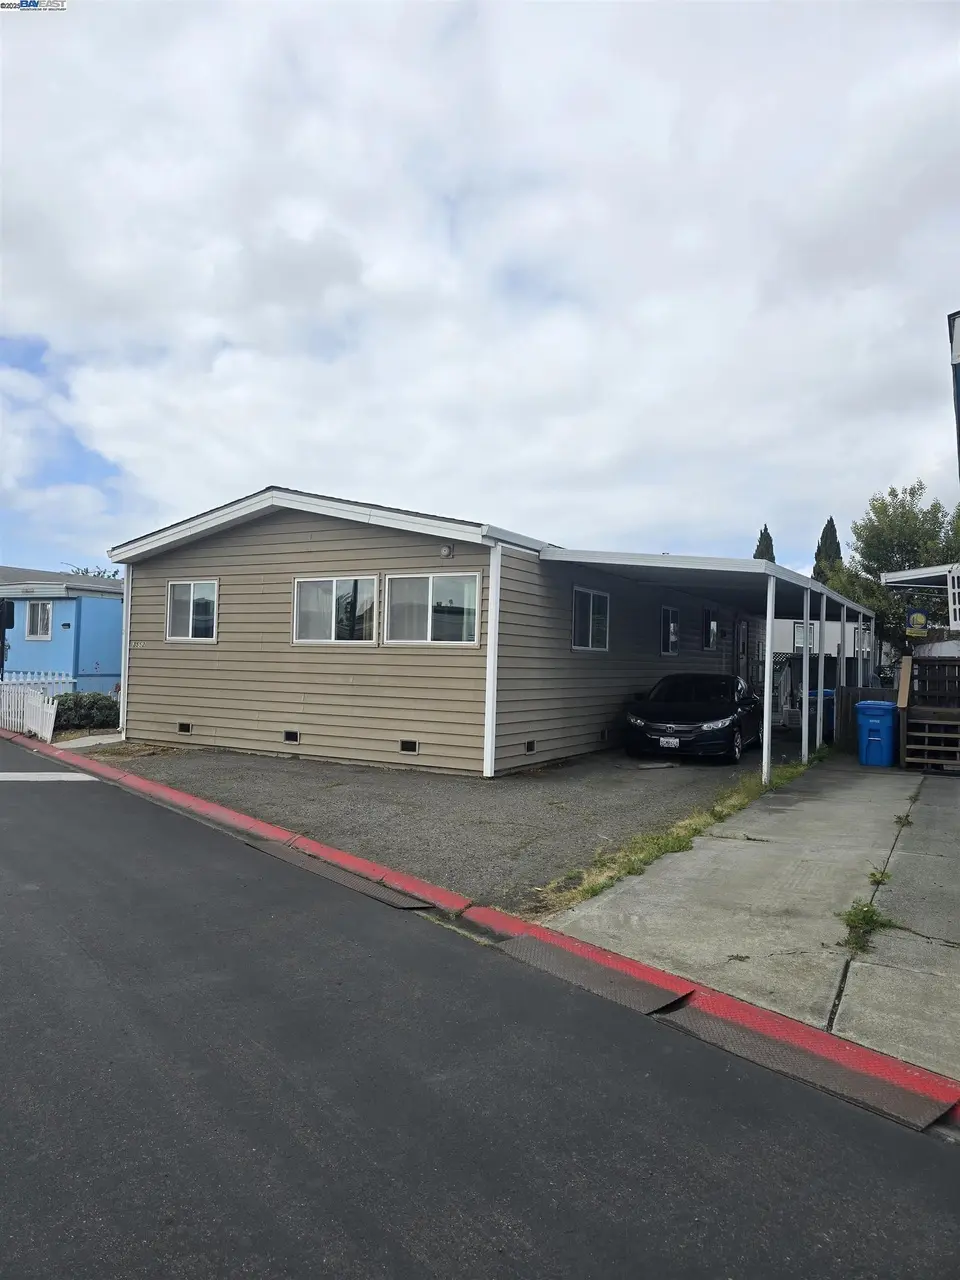
Listing remarks MLS
BACK ON THE MARKET BY NO FAULT OF THE PROPERTY. FAILURE OF BUYER TO SECURE A LOAN. FRESH INTERIOR PAINT, NEW LAMINENT FLOOR IN MAIN AREAS. THIS TWO BATHROOM (MASTER) AND THREE BEDROOM CHARMER IS READY WHEN YOU ARE. NEAR LOADS OF SHOPPING (WALMART) GAS, AND ENTERTINMENT RIGHT AROUND THE CORNER. WELL MAINTAIN BUT BEDROOMS WILL NEED ATTENTION.
Key facts
- 2,158 sq ft lot
- Community pool
- Built 1984
Neighborhood map
What this means for you Summary
Snapshot
- This is a 3-bed/2.0-bath manufactured listed at $330k.
Deal economics
- At list price, monthly cash flow is $627 ($8k/yr) — positive.
- The deal already cash-flows at list — no discount required.
- Meets the 1% rule at list price ($4k rent vs $330k).
- Recommended offer: $290k (12.0% below list) — sets the bar for market timing.
- Cap rate 8.6% vs local median 1.8% in Union City — top-decile yield for the area; either an underpriced asset or a hidden risk that comps aren't pricing in. Stress-test before assuming the spread holds.
Location & tenants
- Location reads 73/100 on livability (#150 in CA) — a middle-class / working-renter tenant base. Strengths: commute A+, employment A+, health & safety A+; Watch: crime D, amenities D, cost of living F.
- New Haven Unified (suburban): math 43% / reading 69% proficiency, ranked #85 of 517 in CA (top 16%) — acceptable for families but not a draw, mixed tenant base, ~2y average lease.
- Market conditions: Rents rising (+3.5%/yr); 150 active listings in the ZIP; 15 comparable units currently listed for rent nearby; rentals leasing fast (median 6d on market — plan ~1-2 weeks tenant-placement turnaround); high-income renter base; 1,742 units permitted in Alameda County in 2024 (856 in 5+ unit buildings).
- This rent runs 33% of the median local income ($134k/yr) — at the standard rent-burdened threshold; future hikes will face affordability resistance.
Forward outlook
- Local home prices are declining (-3.0%/yr); year-one equity from $2k of loan paydown is wiped out by about $10k of value loss. Plan a longer hold.
- Alameda County population projected at +34% by 2050 — long-run rental-demand tailwind backs the buy-and-hold thesis.
Negotiation context
- It's been on market 333 days — a 12% lower offer ($290k) is reasonable based on typical stale-listing flexibility.
- 3 sale attempts; this cycle's ask has dropped $20k (6%) from the opening price — seller is motivated, your offer sets the floor, not the list.
Risks & watch-outs
- Climate carrying-cost: moderate flood risk — expect insurance premiums to compound above CPI over the hold.
Questions for the listing agent
- It's been on market 333 days. Have you received any prior offers? Is the seller open to a 12% concession, seller financing, or rate buy-down credit?
- Why hasn't it sold? Are there any deal-killer items the seller is aware of (foundation, flood, title, zoning, code violations)?
- Is there a deadline driving the sale (1031 exchange, divorce, estate, relocation)? That informs how much negotiation room exists.
- Schools are B-rated — typically a magnet for longer-tenancy family renters. What's the average tenant stay here, and is there a school-zone premium baked into asking?
- Crime grade is D in this area — have there been break-ins, vandalism, or insurance claims at this property in the last 3 years? What carrier currently insures it and at what premium?
- What's the average days-on-market for RENTAL listings here right now (not sales)? A rising rental-DOM trend means longer vacancies and softer asking-rent achievability than the comps imply.
- What's the recent tenant-quality profile in this submarket — average credit score on applications, eviction rate, late-payment / NSF rate, and stable-employment percentage? A property-management company in the area should have these aggregated.
- How much new for-sale + rental construction is in the pipeline within 1–3 miles? Heavy new supply typically softens prices + rents 12–24 months out; constrained supply supports both.
Investment metrics
- 1% rule
- 1.12% ✓
- Cap rate
- 8.57%
- Cash-on-cash
- 8.15%
- DSCR
- 1.36
- GRM
- 7.5
CMA / ARV
- ARV (median comp)
- $285,958
- List price
- $330,000
- Delta
- 15.40%
- Verdict
- OVERPRICED
- Comps
- 20 within 2.0 mi
Show comp detail 2 sales within ~0.75 mi
| Address | Dist | Beds/Ba | Sqft | Sold | Price | $/sf | Match |
|---|---|---|---|---|---|---|---|
| 2542 Barclay Ave #122 | 0.12mi | 3/2.0 | 1,456 (+8%) | 16mo | $368,000 | $253 | 68 |
| 2553 Mifflin Ave #338 | 0.01mi | 4/2.0 (+1) | 1,536 (+14%) | 23mo | $405,000 | $264 | 51 |
Match score weights: distance 35% · size 25% · config 20% · recency 20%. Top-matched comps best support the ARV.
Projected returns pro-forma
-3.0% appreciation · 3.49% rent growth · sell at horizon
- IRR
- -3.3%
- Equity multiple
- 0.87×
- Total profit
- $-11,649
- Equity at exit
- $49,204
- IRR
- 6.9%
- Equity multiple
- 1.53×
- Total profit
- $49,077
- Equity at exit
- $28,532
Cash invested: $92,400 (down + closing). Projections, not guarantees.
Landlord ↔ Tenant lean methodology
- Overall (STATE)
- 18 Strongly Tenant-Friendly
- State California
- 18 Strongly Tenant-Friendly · D+13
- County
- — inherits STATE
- City
- — inherits STATE
ZIP-level market 94587
- Rents YoY
- 3.5%
- Active inventory
- 150
- Price-to-rent
- 7.5×
Monthly cashflow live
- Estimated rent
- $3,681 high interval (Pro) →
- Mortgage (P&I)
- −$1,731
- Tax est. 1.5%
- −$412 /mo · $4,950/yr
- Insurance
- −$138
- HOA
- −$0
- Vacancy / Maint / Mgmt
- −$773
- Net cashflow
- $627
Break-even live
Sensitivity live
| Price | -10% $855 | -5% $741 | +0% $627 | +5% $513 | +10% $399 |
|---|---|---|---|---|---|
| Rent | -10% $336 | -5% $482 | +0% $627 | +5% $773 | +10% $918 |
| Rate | -1.0pp $793 | -0.5pp $711 | base $627 | +0.5pp $542 | +1.0pp $455 |
UW: 25.0% down · 7.5% · 30yr · 1.5% tax · 5.0% vac · 8.0% maint · 8.0% mgmt
Financing live
Cash to close
- Down payment
- $82,500
- Closing costs
- $9,900
- Reserves months
- —
- Total cash needed
- —
Loan-product check · same deal, 3 products live
Conventional
25% down · 7.5% · 30yr
- Down + closing
- —
- Monthly P&I
- —
- Monthly cashflow
- —
- DSCR
- —
- Eligible?
- —
Personal DTI + credit; lowest rate.
DSCR
20% down · 8.5% · 30yr
- Down + closing
- —
- Monthly P&I
- —
- Monthly cashflow
- —
- DSCR
- —
- Eligible?
- —
No personal income docs; deal must DSCR.
Hard money
10% down · 12.0% · 12mo
- Down + closing
- —
- Monthly P&I
- —
- Monthly cashflow
- —
- DSCR
- —
- Eligible?
- —
Short-term bridge; refi at stabilization.
Rent comps 15 comps
| Address | Beds | Baths | Sqft | Rent | $/sqft | DOM | Units | Dist |
|---|---|---|---|---|---|---|---|---|
| 2449 Almaden Blvd Union City, CA | 3.0 | 2.0 | 1565 | $4,495 | $2.87 | 2d | 1 | 0.47mi |
| 3168 Courthouse Dr Union City, CA | 3.0 | 2.0 | 1207 | $4,200 | $3.48 | 16d | 1 | 0.48mi |
| 2500 Medallion Dr Union City, CA | 1.0–3.0 | 1.0 | 781 | $3,195 | $4.09 | 2d | 9 | 0.48mi |
| 3154 Sugar Beet Way Union City, CA | 4.0 | 2.0 | 1412 | $4,150 | $2.94 | 0d | 1 | 0.50mi |
| 3221 San Carlos Way Union City, CA | 3.0 | 2.0 | 1396 | $3,795 | $2.72 | 4d | 1 | 0.61mi |
| 3307 San Marco Ct Union City, CA | 3.0 | 2.0 | 1349 | $3,900 | $2.89 | 3d | 1 | 0.77mi |
| 2262 Eric Ct #4 Union City, CA | 3.0 | 1.5 | 1003 | $3,400 | $3.39 | 4d | 1 | 0.83mi |
| 31101 Fredi St Union City, CA | 3.0 | 2.0 | 1035 | $3,400 | $3.29 | 23d | 1 | 0.98mi |
| 3900 Horner St Union City, CA | 1.0–2.0 | 1.0 | 757 | $3,045 | $4.02 | 6d | 9 | 1.12mi |
| 30927 Union City Blvd Union City, CA | 2.0 | 2.0 | 1170 | $3,500 | $2.99 | 44d | 1 | 1.12mi |
| 4123 Asimuth Cir Union City, CA | 3.0 | 1.5 | 1280 | $3,350 | $2.62 | 44d | 1 | 1.27mi |
| 4402 Queen Anne Dr Union City, CA | 3.0 | 2.0 | 1357 | $4,200 | $3.10 | 2d | 1 | 1.29mi |
| 4428 Viejo Way Union City, CA | 2.0 | 1.5 | 1054 | $2,895 | $2.75 | 44d | 1 | 1.30mi |
| 4292 Comet Cir Union City, CA | 3.0 | 1.5 | 1250 | $2,950 | $2.36 | 25d | 1 | 1.35mi |
| 4562 Reyes Dr Union City, CA | 3.0 | 1.5 | 1155 | $3,250 | $2.81 | 16d | 1 | 1.45mi |
Listing history 23 events
-
2026-06-21days on market $330,000 Active 333 DOM
-
2026-06-18days on market $330,000 Active 330 DOM
-
2026-06-17days on market $330,000 Active 329 DOM
-
2026-06-16days on market $330,000 Active 328 DOM
-
2026-06-15days on market $330,000 Active 327 DOM
-
2026-06-13days on market $330,000 Active 325 DOM
-
2026-06-13days on market $330,000 Active 324 DOM
-
2026-06-09days on market $330,000 Active 321 DOM
-
2026-06-08days on market $330,000 Active 320 DOM
-
2026-06-07days on market $330,000 Active 319 DOM
-
2026-06-04days on market $330,000 Active 316 DOM
-
2026-06-03days on market $330,000 Active 315 DOM
-
2026-06-02days on market $330,000 Active 314 DOM
-
2026-06-01days on market $330,000 Active 313 DOM
-
2026-05-31days on market $330,000 Active 312 DOM
-
2026-04-21status Active 342-char remark
Show marketing remark (342 chars)
BACK ON THE MARKET BY NO FAULT OF THE PROPERTY. FAILURE OF BUYER TO SECURE A LOAN. FRESH INTERIOR PAINT, NEW LAMINENT FLOOR IN MAIN AREAS. THIS TWO BATHROOM (MASTER) AND THREE BEDROOM CHARMER IS READY WHEN YOU ARE. NEAR LOADS OF SHOPPING (WALMART) GAS, AND ENTERTINMENT RIGHT AROUND THE CORNER. WELL MAINTAIN BUT BEDROOMS WILL NEED ATTENTION.
-
2026-04-21price $330,000 342-char remark
Show marketing remark (342 chars)
BACK ON THE MARKET BY NO FAULT OF THE PROPERTY. FAILURE OF BUYER TO SECURE A LOAN. FRESH INTERIOR PAINT, NEW LAMINENT FLOOR IN MAIN AREAS. THIS TWO BATHROOM (MASTER) AND THREE BEDROOM CHARMER IS READY WHEN YOU ARE. NEAR LOADS OF SHOPPING (WALMART) GAS, AND ENTERTINMENT RIGHT AROUND THE CORNER. WELL MAINTAIN BUT BEDROOMS WILL NEED ATTENTION.
-
2026-03-21status Pending 342-char remark
Show marketing remark (342 chars)
BACK ON THE MARKET BY NO FAULT OF THE PROPERTY. FAILURE OF BUYER TO SECURE A LOAN. FRESH INTERIOR PAINT, NEW LAMINENT FLOOR IN MAIN AREAS. THIS TWO BATHROOM (MASTER) AND THREE BEDROOM CHARMER IS READY WHEN YOU ARE. NEAR LOADS OF SHOPPING (WALMART) GAS, AND ENTERTINMENT RIGHT AROUND THE CORNER. WELL MAINTAIN BUT BEDROOMS WILL NEED ATTENTION.
-
2026-02-20price $335,000 342-char remark
Show marketing remark (342 chars)
BACK ON THE MARKET BY NO FAULT OF THE PROPERTY. FAILURE OF BUYER TO SECURE A LOAN. FRESH INTERIOR PAINT, NEW LAMINENT FLOOR IN MAIN AREAS. THIS TWO BATHROOM (MASTER) AND THREE BEDROOM CHARMER IS READY WHEN YOU ARE. NEAR LOADS OF SHOPPING (WALMART) GAS, AND ENTERTINMENT RIGHT AROUND THE CORNER. WELL MAINTAIN BUT BEDROOMS WILL NEED ATTENTION.
-
2025-09-03price $345,000 342-char remark
Show marketing remark (342 chars)
BACK ON THE MARKET BY NO FAULT OF THE PROPERTY. FAILURE OF BUYER TO SECURE A LOAN. FRESH INTERIOR PAINT, NEW LAMINENT FLOOR IN MAIN AREAS. THIS TWO BATHROOM (MASTER) AND THREE BEDROOM CHARMER IS READY WHEN YOU ARE. NEAR LOADS OF SHOPPING (WALMART) GAS, AND ENTERTINMENT RIGHT AROUND THE CORNER. WELL MAINTAIN BUT BEDROOMS WILL NEED ATTENTION.
-
2025-07-23status Active 342-char remark
Show marketing remark (342 chars)
BACK ON THE MARKET BY NO FAULT OF THE PROPERTY. FAILURE OF BUYER TO SECURE A LOAN. FRESH INTERIOR PAINT, NEW LAMINENT FLOOR IN MAIN AREAS. THIS TWO BATHROOM (MASTER) AND THREE BEDROOM CHARMER IS READY WHEN YOU ARE. NEAR LOADS OF SHOPPING (WALMART) GAS, AND ENTERTINMENT RIGHT AROUND THE CORNER. WELL MAINTAIN BUT BEDROOMS WILL NEED ATTENTION.
-
2025-05-19status Pending 342-char remark
Show marketing remark (342 chars)
BACK ON THE MARKET BY NO FAULT OF THE PROPERTY. FAILURE OF BUYER TO SECURE A LOAN. FRESH INTERIOR PAINT, NEW LAMINENT FLOOR IN MAIN AREAS. THIS TWO BATHROOM (MASTER) AND THREE BEDROOM CHARMER IS READY WHEN YOU ARE. NEAR LOADS OF SHOPPING (WALMART) GAS, AND ENTERTINMENT RIGHT AROUND THE CORNER. WELL MAINTAIN BUT BEDROOMS WILL NEED ATTENTION.
-
2025-04-18$349,950 Active 342-char remark
Show marketing remark (342 chars)
BACK ON THE MARKET BY NO FAULT OF THE PROPERTY. FAILURE OF BUYER TO SECURE A LOAN. FRESH INTERIOR PAINT, NEW LAMINENT FLOOR IN MAIN AREAS. THIS TWO BATHROOM (MASTER) AND THREE BEDROOM CHARMER IS READY WHEN YOU ARE. NEAR LOADS OF SHOPPING (WALMART) GAS, AND ENTERTINMENT RIGHT AROUND THE CORNER. WELL MAINTAIN BUT BEDROOMS WILL NEED ATTENTION.
ⓘ Source: listings_history table (triggers on properties + properties_extension) + one-shot
backfill from property_details.listing_events for pre-trigger history.
Climate risk First Street
- Flood 5/10 Major FEMA zone X (unshaded) · 55% chance over 30 yrs
- Wildfire 1/10 Low
- Heat 4/10 Moderate 7 d/yr ≥89°F today · 14 d/yr by 30 yrs out
- Wind 1/10 Low
- Air quality 7/10 Severe 12 unhealthy d/yr today · 12 by 30 yrs out
Nearby sold comps map
Loading sold comps map…
Walkable amenities ~0.75 mi
Loading nearby amenities…
Taxation est. · year 1
- Rental income
- $44,168
- − Mortgage interest
- −$18,485
- − Property taxes
- −$4,950
- − Insurance
- −$1,650
- − Repairs & maintenance
- −$3,533
- − Management
- −$3,533
- − Depreciation
- −$9,600
- Taxable income
- $2,416
- Est. tax owed @ 24.0%
- −$580
- After-tax cash flow
- $6,946/yr
For passive investors: Depreciation is non-cash, so a rental often shows a tax loss while cash-flowing — sheltering income. Rental losses are passive: they offset passive income freely, and up to $25,000/yr can offset ordinary (W-2) income if you actively participate and your MAGI is under $100k (phasing out to $0 by $150k); unused losses carry forward. On sale, claimed depreciation is recaptured at up to 25%, and gains may owe capital-gains tax (a 1031 exchange can defer both). Figures are a year-1 estimate at your 24.0% rate — not tax advice; consult a CPA.
Schools (NCES district)
- District
- New Haven Unified
- NCES district ID
- 0626910
- Math proficiency
- 43% ▲ 1.00%
- Reading proficiency
- 69% ▲ 18.00%
- Median HH income
- $87,202
- Composite
- 51.21/100
- National rank
- #1754
- State rank
- #85 of 517 in CA
Livability — Union City
- Score
- 73/100
- State rank
- #150
- US rank
- #5027
Category grades
Schools grade is shown separately in the Schools card above.
Census & demographics
- Census place
- Union City, CA
- County
- Alameda County · 1,614,355 people
- City population
- 67,464
- Metro
- San Francisco-Oakland-Berkeley, CA
- Population (ZIP)
- 67,464
- Household income
- $133,715
- Rent vs Own
- Severe rent burden
- 1565.0
Population outlook (Alameda County) Hauer SSP2
- Today (2025)
- 1,928,884 people
- By 2030
- 2,069,146 · +7.3%
- By 2040
- 2,338,405 · +21.2%
- By 2050
- 2,586,608 · +34.1%
- By 2075
- 3,061,911 · +58.7%
- By 2100
- 3,234,133 · +67.7%
Race, ethnicity, and origin ACS 2023
- Neighborhood character
- Diverse neighborhood (Simpson 0.63)
- Race & ethnicity
- Asian 55% Hispanic / Latino 19% White 15% Two or more races 10% Black 5%
- Hispanic origin (detail)
- Mexican 16%
- Common ancestry
- Russian 1% Slovak 1%
- Foreign-born
- 47% · China, Canada, Vietnam
- Languages at home
- 39% English-only · Spanish 13% Other Indo-European 13% Tagalog/Filipino 12%
Political lean MEDSL · Alameda
- 2024 margin
- Solid D (+53.6) · D 74.6% · R 21.0% · Other 4.4%
- 2008→2024 swing
- -5.9pp toward R · 2008: 59.5pp · 2024: 53.6pp
- All cycles
- 2024: D+53.6 2020: D+62.5 2016: D+64.4 2012: D+59.8 2008: D+59.5
Not yet ingested
- Civics
- —
Market trends
- HPI YoY
- ▼ -1280.49%
- Current HPI
- 343.0333
- Rent YoY
- ▲ 3.49%
- Metro
- San Francisco-Oakland-Berkeley, CA
- State GDP YoY
- ▲ 3.21%
- F500 in state
- 116
Industry mix (Fortune 500 HQ in CA)
| Industry | F500 HQs | Revenue |
|---|---|---|
| Technology | 27 | $1,492B |
|
||
| Financial Services | 3 | $174B |
|
||
| Retail | 3 | $44B |
|
||
| Insurance | 3 | $26B |
|
||
| Media / Entertainment | 2 | $115B |
|
||
| Pharmaceuticals / Biotech | 2 | $62B |
|
||
Price history
-5.7% since first listed8 events — show timeline
- 2026-04-21 Relisted — bridgeMLS, Bay East AOR, or Contra Costa AOR
- 2026-04-21 Price Changed $330,000 bridgeMLS, Bay East AOR, or Contra Costa AOR
- 2026-03-21 Pending — bridgeMLS, Bay East AOR, or Contra Costa AOR
- 2026-02-20 Price Changed $335,000 bridgeMLS, Bay East AOR, or Contra Costa AOR
- 2025-09-03 Price Changed $345,000 bridgeMLS, Bay East AOR, or Contra Costa AOR
- 2025-07-23 Relisted — bridgeMLS, Bay East AOR, or Contra Costa AOR
- 2025-05-19 Pending — bridgeMLS, Bay East AOR, or Contra Costa AOR
- 2025-04-18 Listed $349,950 bridgeMLS, Bay East AOR, or Contra Costa AOR
Property tax history
-0.5%/yrLatest (2025): $260 · +1.6% YoY. Source: county tax records.
Cash-flow waterfall
monthlySold comps — $/sqft
last 12 mo · ≤1 miLoading sold comps…