1837 Sunset · Barstow, CA
Flood risk 1/10 · Minimal
- FEMA flood zone
- X (unshaded)
- Chance of flooding over 30 yrs
- 0.0%
- Est. flood insurance / yr
- $507 – $1,088
Fire risk 4/10 · Minor
- Est. fire insurance / yr
- $659 – $1,223
Heat risk 8/10 · Major
- Hot days now (above 103°F)
- 7 days/yr
- Hot days in 30 yrs
- 21 days/yr
Wind risk 1/10 · Minimal
- Chance of severe wind over 30 yrs
- —
Air-quality risk 6/10 · Moderate
- Unhealthy air days now
- 11 days/yr
- Unhealthy air days in 30 yrs
- 15 days/yr
Risk factors via First Street. Map © Google.
Why this score? — see what drove the B grade
The composite is a weighted blend of 9 inputs, each scored 0–100. Each bar is that input's sub-score; the figure is the points it added to the 100-point composite (weight × sub-score).
- Cash flow +29.9/30.0
- ARV discount +15.0/15.0
- DSCR +10.0/10.0
- 1% rule +8.4/10.0
- Livability +3.2/5.0
- Rent growth +3.1/5.0
- Schools +1.4/10.0
- Condition / age +1.0/5.0
- Appreciation +0.0/10.0
$175,000
🖨 Deal sheet 📄 Offer letter ✓ Due diligence
Listing remarks MLS
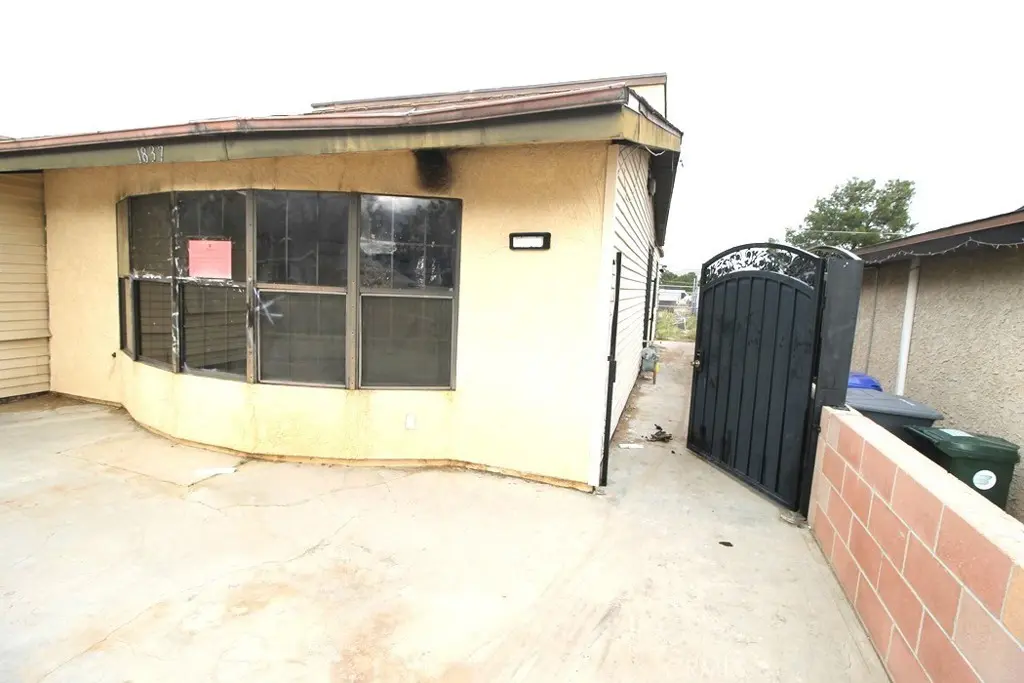
This one had a fire, and there is some debris to be removed. There is a red Tag and you should check with the City on their requirements. This one is not for the inexperienced flipper. This is a 2 Story home and it is important that the buyer verify the information provided. It appears there was 3 downstairs bedrooms and 1 bathroom ground level and 1 on the top level, but not sure.
Key facts
- 6,000 sq ft lot
- Built 1960
- Listed 126 days
Neighborhood map
What this means for you Summary
Snapshot
- This is a 5-bed/2.0-bath single-family listed at $175k. Condition is rated poor.
Deal economics
- At list price, monthly cash flow is $649 ($8k/yr) — positive.
- The deal already cash-flows at list — no discount required.
- Meets the 1% rule at list price ($2k rent vs $175k).
- Recommended offer: $154k (12.0% below list) — sets the bar for market timing.
- Cap rate 10.7% vs local median 4.6% in Barstow — top-decile yield for the area; either an underpriced asset or a hidden risk that comps aren't pricing in. Stress-test before assuming the spread holds.
Location & tenants
- Location reads 63/100 on livability (#444 in CA) — a middle-class / working-renter tenant base. Strengths: commute A+, housing A+; Watch: amenities C-, health & safety C-, schools F.
- Barstow Unified (town): math 11% / reading 22% proficiency, ranked #482 of 517 in CA (top 93%) — low school quality limits family demand, transient renter base, plan for 1-2y turnover; 68% free/reduced lunch — lower-income household profile, screen leases tightly.
- Market conditions: Rents rising (+2.3%/yr); 343 active listings in the ZIP; 2 comparable units currently listed for rent nearby; 5,458 units permitted in San Bernardino County in 2024 (1,500 in 5+ unit buildings).
- At $2,353/mo this rent would consume 46% of the median local household income ($62k/yr) (locally 1305% of renters already pay >50% of income on rent) — very limited rent-growth headroom before tenants either downsize or default.
Forward outlook
- Local home prices are declining (-3.0%/yr); year-one equity from $1k of loan paydown is wiped out by about $5k of value loss. Plan a longer hold.
- San Bernardino County population projected at +15% by 2050 — modest demand growth; plan on rents tracking national, not racing it.
- At projected returns (-3.0% appreciation + 2.3% rent growth), your $49k cash investment doubles in ~8 years — after that, you're playing with house money.
Negotiation context
- It's been on market 127 days — a 12% lower offer ($154k) is reasonable based on typical stale-listing flexibility.
- 2 sale attempts since 13y ago; this cycle's ask has dropped $20k (10%) from the opening price — seller is motivated, your offer sets the floor, not the list.
- Current owner paid $77k; list at $175k implies a 127% gain — meaningful room to come down on a strong offer.
Risks & watch-outs
- Climate carrying-cost: extreme-heat days projected 7→21/yr by 2055 (HVAC capex compounding) — expect insurance premiums to compound above CPI over the hold.
Questions for the listing agent
- It's been on market 127 days. Have you received any prior offers? Is the seller open to a 12% concession, seller financing, or rate buy-down credit?
- Have any recent inspections been done? Can we get a copy of the seller's disclosures and any deferred-maintenance estimates?
- Built in 1960 — when were the roof, HVAC, electrical panel, plumbing, and water heater last replaced?
- Why hasn't it sold? Are there any deal-killer items the seller is aware of (foundation, flood, title, zoning, code violations)?
- Is there a deadline driving the sale (1031 exchange, divorce, estate, relocation)? That informs how much negotiation room exists.
- Schools are F-rated, which usually means shorter tenancies and higher turnover. Who's the typical renter profile here, and what's been the actual vacancy rate?
- Crime grade is F in this area — have there been break-ins, vandalism, or insurance claims at this property in the last 3 years? What carrier currently insures it and at what premium?
- What's the average days-on-market for RENTAL listings here right now (not sales)? A rising rental-DOM trend means longer vacancies and softer asking-rent achievability than the comps imply.
- What's the recent tenant-quality profile in this submarket — average credit score on applications, eviction rate, late-payment / NSF rate, and stable-employment percentage? A property-management company in the area should have these aggregated.
- How much new for-sale + rental construction is in the pipeline within 1–3 miles? Heavy new supply typically softens prices + rents 12–24 months out; constrained supply supports both.
Investment metrics
- 1% rule
- 1.34% ✓
- Cap rate
- 10.75%
- Cash-on-cash
- 15.90%
- DSCR
- 1.71
- GRM
- 6.2
CMA / ARV
- ARV (median comp)
- $328,517
- List price
- $175,000
- Delta
- -46.73%
- Verdict
- UNDERPRICED
- Comps
- 20 within 1.0 mi
Show comp detail 3 sales within ~0.75 mi
| Address | Dist | Beds/Ba | Sqft | Sold | Price | $/sf | Match |
|---|---|---|---|---|---|---|---|
| 1613 Sunrise Rd | 0.31mi | 4/2.0 (-1) | 1,912 (-14%) | 8mo | $315,000 | $165 | 51 |
| 1361 Tara St | 0.58mi | 4/2.5 (-1) | 1,941 (-13%) | 10mo | $340,000 | $175 | 37 |
| 1320 Center St | 0.61mi | 4/2.5 (-1) | 1,941 (-13%) | 14mo | $380,000 | $196 | 32 |
Match score weights: distance 35% · size 25% · config 20% · recency 20%. Top-matched comps best support the ARV.
Projected returns pro-forma
-3.0% appreciation · 2.32% rent growth · sell at horizon
- IRR
- 6.0%
- Equity multiple
- 1.23×
- Total profit
- $11,434
- Equity at exit
- $26,093
- IRR
- 14.8%
- Equity multiple
- 2.16×
- Total profit
- $56,881
- Equity at exit
- $15,131
Cash invested: $49,000 (down + closing). Projections, not guarantees.
Landlord ↔ Tenant lean methodology
- Overall (STATE)
- 18 Strongly Tenant-Friendly
- State California
- 18 Strongly Tenant-Friendly · D+13
- County
- — inherits STATE
- City
- — inherits STATE
ZIP-level market 92311
- Home prices YoY
- -30.6%
- Rents YoY
- 2.3%
- Active inventory
- 343
- Price-to-rent
- 6.2×
Monthly cashflow live
- Estimated rent
- $2,353 medium interval (Pro) →
- Mortgage (P&I)
- −$918
- Tax est. 1.5%
- −$219 /mo · $2,625/yr
- Insurance
- −$73
- HOA
- −$0
- Vacancy / Maint / Mgmt
- −$494
- Net cashflow
- $649
Break-even live
UW: 25.0% down · 7.5% · 30yr · 1.5% tax · 5.0% vac · 8.0% maint · 8.0% mgmt
Financing live
Cash to close
- Down payment
- $43,750
- Closing costs
- $5,250
- Reserves months
- —
- Total cash needed
- —
Loan-product check · same deal, 3 products live
Conventional
25% down · 7.5% · 30yr
- Down + closing
- —
- Monthly P&I
- —
- Monthly cashflow
- —
- DSCR
- —
- Eligible?
- —
Personal DTI + credit; lowest rate.
DSCR
20% down · 8.5% · 30yr
- Down + closing
- —
- Monthly P&I
- —
- Monthly cashflow
- —
- DSCR
- —
- Eligible?
- —
No personal income docs; deal must DSCR.
Hard money
10% down · 12.0% · 12mo
- Down + closing
- —
- Monthly P&I
- —
- Monthly cashflow
- —
- DSCR
- —
- Eligible?
- —
Short-term bridge; refi at stabilization.
Rent comps 2 comps
| Address | Beds | Baths | Sqft | Rent | $/sqft | DOM | Units | Dist |
|---|---|---|---|---|---|---|---|---|
| 936 Pinon Dr Barstow, CA | 4.0 | 2.0 | 1762 | $2,400 | $1.36 | 24d | 1 | 1.02mi |
| 937 E Elizabeth St Barstow, CA | 4.0 | 1.0 | 1422 | $2,195 | $1.54 | 4d | 1 | 1.09mi |
Listing history 19 events
-
2026-06-18days on market $175,000 Active 127 DOM
-
2026-06-17days on market $175,000 Active 126 DOM
-
2026-06-16days on market $175,000 Active 125 DOM
-
2026-06-15days on market $175,000 Active 124 DOM
-
2026-06-13days on market $175,000 Active 122 DOM
-
2026-06-13days on market $175,000 Active 121 DOM
-
2026-06-09days on market $175,000 Active 118 DOM
-
2026-06-08days on market $175,000 Active 117 DOM
-
2026-06-07days on market $175,000 Active 116 DOM
-
2026-06-04days on market $175,000 Active 113 DOM
-
2026-06-03days on market $175,000 Active 112 DOM
-
2026-06-02days on market $175,000 Active 111 DOM
-
2026-06-01days on market $175,000 Active 110 DOM
-
2026-05-31days on market $175,000 Active 109 DOM
-
2026-04-07price $175,000 384-char remark
Show marketing remark (384 chars)
This one had a fire, and there is some debris to be removed. There is a red Tag and you should check with the City on their requirements. This one is not for the inexperienced flipper. This is a 2 Story home and it is important that the buyer verify the information provided. It appears there was 3 downstairs bedrooms and 1 bathroom ground level and 1 on the top level, but not sure.
-
2026-02-11$195,000 Active 384-char remark
Show marketing remark (384 chars)
This one had a fire, and there is some debris to be removed. There is a red Tag and you should check with the City on their requirements. This one is not for the inexperienced flipper. This is a 2 Story home and it is important that the buyer verify the information provided. It appears there was 3 downstairs bedrooms and 1 bathroom ground level and 1 on the top level, but not sure.
-
2013-12-31historical
-
2013-06-14$149,900
-
2001-06-26soldstatus $77,000
ⓘ Source: listings_history table (triggers on properties + properties_extension) + one-shot
backfill from property_details.listing_events for pre-trigger history.
Climate risk First Street
- Flood 1/10 Low FEMA zone X (unshaded) · 0% chance over 30 yrs
- Wildfire 4/10 Moderate
- Heat 8/10 Severe 7 d/yr ≥103°F today · 21 d/yr by 30 yrs out
- Wind 1/10 Low
- Air quality 6/10 Major 11 unhealthy d/yr today · 15 by 30 yrs out
Nearby sold comps map
Loading sold comps map…
Walkable amenities ~0.75 mi
Loading nearby amenities…
Taxation est. · year 1
- Rental income
- $28,233
- − Mortgage interest
- −$9,803
- − Property taxes
- −$2,625
- − Insurance
- −$875
- − Repairs & maintenance
- −$2,259
- − Management
- −$2,259
- − Depreciation
- −$5,091
- Taxable income
- $5,322
- Est. tax owed @ 24.0%
- −$1,277
- After-tax cash flow
- $6,514/yr
For passive investors: Depreciation is non-cash, so a rental often shows a tax loss while cash-flowing — sheltering income. Rental losses are passive: they offset passive income freely, and up to $25,000/yr can offset ordinary (W-2) income if you actively participate and your MAGI is under $100k (phasing out to $0 by $150k); unused losses carry forward. On sale, claimed depreciation is recaptured at up to 25%, and gains may owe capital-gains tax (a 1031 exchange can defer both). Figures are a year-1 estimate at your 24.0% rate — not tax advice; consult a CPA.
Condition & rehab AI · 12 photos
This property has been severely damaged by fire and requires a complete gut renovation. The entire structure, including the kitchen, bathrooms, exterior, and HVAC, needs to be rebuilt. Landscaping and curb appeal improvements will also be necessary to enhance the property's value.
Repairs flagged
- Major kitchen cabinets — Burnt and unusable
- Major bathroom fixtures — Burnt and unusable
- Major exterior siding — Burnt and unusable
- Major windows — Burnt and unusable
- Major roof — Burnt and unusable
- Major HVAC — Burnt and unusable
Value-add opportunities
- Both Rebuild entire structure — Complete gut renovation required
- Both Landscaping and curb appeal — New landscaping will improve curb appeal
- Both HVAC and electrical systems — New systems will improve comfort and energy efficiency
Renovation cost estimate screening
| Repair item | Severity | Est. cost |
|---|---|---|
| kitchen cabinets · Burnt and unusable | Major | $15,000–50,000 |
| bathroom fixtures · Burnt and unusable | Major | $15,000–50,000 |
| exterior siding · Burnt and unusable | Major | $15,000–50,000 |
| windows · Burnt and unusable | Major | $15,000–50,000 |
| roof · Burnt and unusable | Major | $15,000–50,000 |
| HVAC · Burnt and unusable | Major | $15,000–50,000 |
| Total estimated repair cost · 6 items | $90,000–300,000 |
Value-add ROI direction
- Both Rebuild entire structure — Complete gut renovation required ↑
- Both Landscaping and curb appeal — New landscaping will improve curb appeal ↑
- Both HVAC and electrical systems — New systems will improve comfort and energy efficiency ↑
ⓘ Cost ranges are severity-bucket heuristics (US national rule-of-thumb). Get contractor quotes + a written scope before underwriting a rehab budget.
Schools (NCES district)
- District
- Barstow Unified
- NCES district ID
- 0604020
- Math proficiency
- 11% ▼ -7.00%
- Reading proficiency
- 22% ▼ -7.00%
- Median HH income
- $44,505
- Composite
- 14.44/100
- National rank
- #9430
- State rank
- #482 of 517 in CA
Livability — Barstow
- Score
- 63/100
- State rank
- #444
- US rank
- #15099
Category grades
Schools grade is shown separately in the Schools card above.
Census & demographics
- Census place
- Barstow, CA
- County
- San Bernardino County · 2,030,291 people
- City population
- 33,954
- Metro
- Riverside-San Bernardino-Ontario, CA
- Population (ZIP)
- 33,954
- Household income
- $61,862
- Rent vs Own
- Severe rent burden
- 1305.0
Population outlook (San Bernardino County) Hauer SSP2
- Today (2025)
- 2,300,329 people
- By 2030
- 2,378,907 · +3.4%
- By 2040
- 2,523,137 · +9.7%
- By 2050
- 2,642,388 · +14.9%
- By 2075
- 2,880,769 · +25.2%
- By 2100
- 2,909,436 · +26.5%
Race, ethnicity, and origin ACS 2023
- Neighborhood character
- Diverse neighborhood (Simpson 0.68)
- Race & ethnicity
- Hispanic / Latino 46% White 29% Two or more races 22% Black 15% Native American 3% Asian 2% Pacific Islander 1%
- Hispanic origin (detail)
- Mexican 39% Puerto Rican 2%
- Common ancestry
- Portuguese 1% Lithuanian 1% Italian 1%
- Foreign-born
- 9% · Canada, South Korea
- Languages at home
- 77% English-only · Spanish 20% Tagalog/Filipino 1% Other Indo-European 1%
Political lean MEDSL · San Bernardino
- 2024 margin
- Toss-up / Even · D 47.5% · R 49.7% · Other 2.8%
- 2008→2024 swing
- -8.5pp toward R · 2008: 6.3pp · 2024: -2.1pp
- All cycles
- 2024: R+2.1 2020: D+10.7 2016: D+9.8 2012: D+5.4 2008: D+6.3
Not yet ingested
- Civics
- —
Market trends
- HPI YoY
- ▼ -139.26%
- Current HPI
- 316.4858
- Rent YoY
- ▲ 2.32%
- Metro
- Riverside-San Bernardino-Ontario, CA
- State GDP YoY
- ▲ 3.21%
- F500 in state
- 116
Industry mix (Fortune 500 HQ in CA)
| Industry | F500 HQs | Revenue |
|---|---|---|
| Technology | 27 | $1,492B |
|
||
| Financial Services | 3 | $174B |
|
||
| Retail | 3 | $44B |
|
||
| Insurance | 3 | $26B |
|
||
| Media / Entertainment | 2 | $115B |
|
||
| Pharmaceuticals / Biotech | 2 | $62B |
|
||
Price history
+127.3% since first listed5 events — show timeline
- 2026-04-07 Price Changed $175,000 CRMLS
- 2026-02-11 Listed $195,000 CRMLS
- 2013-12-31 Listing Removed — CRMLS
- 2013-06-14 Listed $149,900 CRMLS
- 2001-06-26 Sold (MLS) $77,000 CRMLS
Cash-flow waterfall
monthlySold comps — $/sqft
last 12 mo · ≤1 miLoading sold comps…