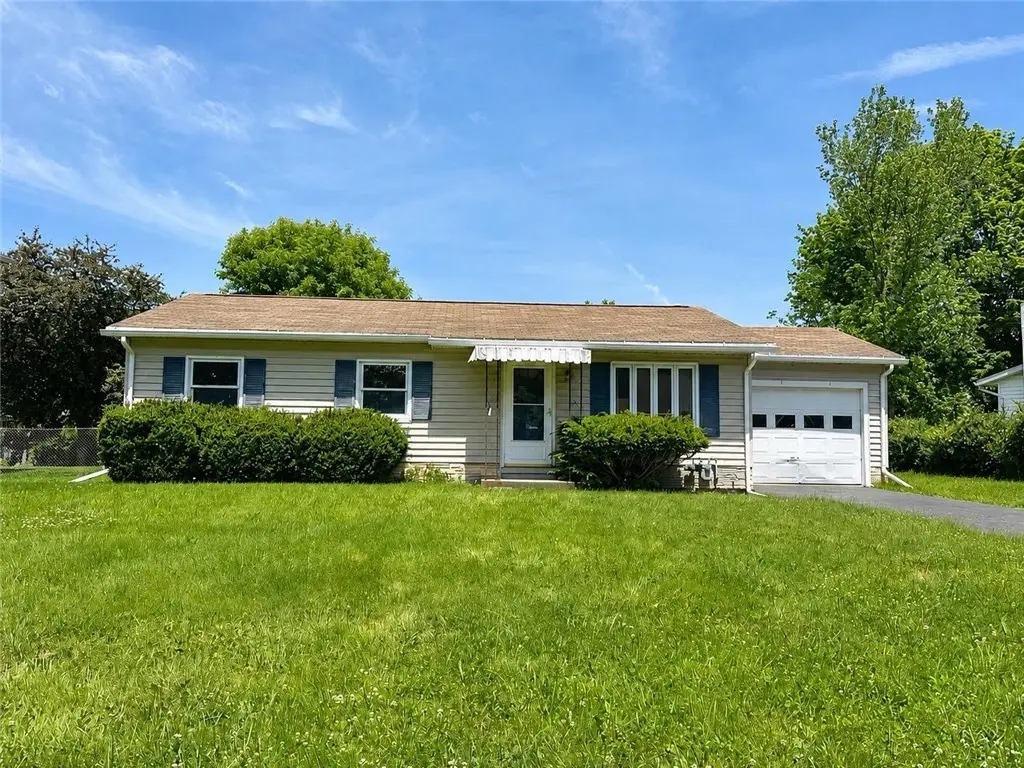
6 Meadow Ln · Gang Mills, NY
Flood risk 1/10 · Minimal
- FEMA flood zone
- X
- Chance of flooding over 30 yrs
- 0.0%
- Est. flood insurance / yr
- $473 – $860
Fire risk 2/10 · Minimal
- Est. fire insurance / yr
- $691 – $1,283
Heat risk 3/10 · Minor
- Hot days now (above 92°F)
- 7 days/yr
- Hot days in 30 yrs
- 17 days/yr
Wind risk 1/10 · Minimal
- Chance of severe wind over 30 yrs
- —
Air-quality risk 1/10 · Minimal
- Unhealthy air days now
- 0 days/yr
- Unhealthy air days in 30 yrs
- 0 days/yr
Risk factors via First Street. Map © Google.
Why this score? — see what drove the B grade
The composite is a weighted blend of 9 inputs, each scored 0–100. Each bar is that input's sub-score; the figure is the points it added to the 100-point composite (weight × sub-score).
- Cash flow +25.4/30.0
- ARV discount +14.8/15.0
- 1% rule +9.2/10.0
- DSCR +8.4/10.0
- Schools +4.2/10.0
- Livability +3.4/5.0
- Condition / age +2.5/5.0
- Rent growth +2.2/5.0
- Appreciation +0.0/10.0
$129,500
🖨 Deal sheet (PDF) 📄 Offer letter ✓ Due diligence
Listing remarks
Welcome to this 3-bedroom ranch nestled on a quiet cul-de-sac in a convenient Painted Post / Town of Erwin location close to shopping, dining, parks, schools, and everyday amenities. Enjoy 1 floor living with a comfortable floor plan featuring a good-sized eat-in kitchen, ready for casual meals and gatherings. Enjoy the benefits of a newer furnace, low maintenance vinyl siding, central air, and an attached one car garage. The fully fenced backyard provides a great space for pets, play, gardening, and outdoor entertainment. Whether you're just starting out, downsizing, or looking for 1 floor living, this home is ready for your updates and its next owner. Priced well below appraised and asses
Key facts
- Newer furnace
- Quiet cul-de-sac
- Eat-in kitchen
Tags
Property features AI
Exterior
- Parking: Attached garage (1 car)
- Utilities: Public water connected; Sewer connected; Cable available; High-speed internet available
- Home design: Single-story home; Vinyl siding; Asphalt roof; Existing (well-maintained resale property); Poured foundation
- Construction: Vinyl siding construction; Asphalt roof; Poured foundation; Built as existing/resale (year built details: existing)
- Exterior features: Deck; Fully fenced yard; Blacktop driveway; Located on a cul-de-sac; Rectangular residential lot, 70 x 120
Interior
- Kitchen: Electric oven; Electric range; Refrigerator
- Bedrooms: Three main-level bedrooms
- Flooring: Carpet; Vinyl; Varied flooring
- Bathrooms: One full bathroom on the main level
- Heating & cooling: Gas forced-air heating; Central air conditioning; Circuit breaker electrical
- Interior features: Eat-in kitchen; Separate/formal living room; Thermal windows; Full basement
- Laundry & utility: Washer and dryer located in the basement; Gas water heater (rented)
Neighborhood map
What this means for you Summary
Snapshot
- This is a 3-bed/1.5-bath single-family listed at $130k.
Deal economics
- At list price, monthly cash flow is $298 ($4k/yr) — positive.
- The deal already cash-flows at list — no discount required.
- Meets the 1% rule at list price ($2k rent vs $130k).
Location & tenants
- Location reads 68/100 on livability (#532 in NY) — a middle-class / working-renter tenant base. Strengths: employment A+, housing A+, crime B+; Watch: cost of living C-, health & safety D, amenities F.
- Corning City School District (town): math 44% / reading 53% proficiency, ranked #406 of 590 in NY (top 69%) — families likely to look elsewhere, expect single-tenant / working-renter base with shorter leases.
- Zoned schools: Erwin Valley Elementary School (math 49% / reading 55%, grade C-, #988 of 2,108 statewide, top 49%, 373 students, 33% FRL); Corning-Painted Post Middle School (math 22% / reading 48%, grade F, #480 of 729 statewide, top 66%, 962 students, 46% FRL); Corning-Painted Post High School (math 93% / reading 98%, grade A+, #82 of 1,100 statewide, top 7%, 1,463 students, 36% FRL).
- Zoned-school proficiency averages 61% at this address vs 48% district-wide (+12 pts) — the actual schools serving this property are materially stronger than the Corning City School District average implies; a family-tenant draw the district grade alone would hide.
- Market conditions: Rents soft (-1.4%/yr); 44 active listings in the ZIP; 1 comparable units currently listed for rent nearby; solid renter incomes; 196 units permitted in Steuben County in 2024 (0 in 5+ unit buildings).
Forward outlook
- Local home prices are declining (-3.0%/yr); year-one equity from $895 of loan paydown is wiped out by about $4k of value loss. Plan a longer hold.
- Steuben County population projected at -20% by 2050 — secular population decline; favor cash flow + early exit over multi-decade hold.
Negotiation context
- Only 5 days on market — expect competitive offers; lowballing is unlikely to land.
Risks & watch-outs
- Watch-outs: property tax is 3.9% of price.
Questions for the listing agent
- Built in 1974 — when were the roof, HVAC, electrical panel, plumbing, and water heater last replaced?
- Property tax is high relative to price — has the assessment been appealed recently, and will the sale trigger a re-assessment?
- Is there a deadline driving the sale (1031 exchange, divorce, estate, relocation)? That informs how much negotiation room exists.
- Schools are D-rated, which usually means shorter tenancies and higher turnover. Who's the typical renter profile here, and what's been the actual vacancy rate?
- What's the average days-on-market for RENTAL listings here right now (not sales)? A rising rental-DOM trend means longer vacancies and softer asking-rent achievability than the comps imply.
- What's the recent tenant-quality profile in this submarket — average credit score on applications, eviction rate, late-payment / NSF rate, and stable-employment percentage? A property-management company in the area should have these aggregated.
- How much new for-sale + rental construction is in the pipeline within 1–3 miles? Heavy new supply typically softens prices + rents 12–24 months out; constrained supply supports both.
Investment metrics
- 1% rule
- 1.42% ✓
- Cap rate
- 9.05%
- Cash-on-cash
- 9.85%
- DSCR
- 1.44
- GRM
- 5.9
CMA / ARV
- ARV (on-the-fly)
- $154,696
- Comps found
- 8
Show comp detail 8 sales within ~0.75 mi
| Address | Dist | Beds/Ba | Sqft | Sold | Price | $/sf | Match |
|---|---|---|---|---|---|---|---|
| 20 Erwin St | 0.12mi | 3/1.5 | 1,230 (-3%) | 2mo | $194,500 | $158 | 88 |
| 461 S Hamilton St | 0.08mi | 3/1.5 | 1,200 (-5%) | 2mo | $140,000 | $117 | 86 |
| 475 S Hamilton St | 0.11mi | 2/1.0 (-1) | 1,209 (-5%) | 22mo | $133,500 | $110 | 61 |
| 14 Meadow Ln | 0.06mi | 2/1.5 (-1) | 1,106 (-13%) | 18mo | $175,000 | $158 | 56 |
| 68 Erwin St | 0.39mi | 2/1.0 (-1) | 1,100 (-13%) | 3mo | $131,500 | $120 | 50 |
| 10 Cherry Cir | 0.13mi | 4/2.0 (+1) | 1,444 (+14%) | 19mo | $164,945 | $114 | 48 |
| 183 Beartown Rd | 0.69mi | 2/1.0 (-1) | 1,308 (+3%) | 18mo | $160,000 | $122 | 40 |
| 192 Beartown Rd | 0.74mi | 3/1.0 | 1,166 (-8%) | 22mo | $169,500 | $145 | 32 |
Match score weights: distance 35% · size 25% · config 20% · recency 20%. Top-matched comps best support the ARV.
Projected returns pro-forma
-3.0% appreciation · 0.0% rent growth · sell at horizon
- IRR
- -5.6%
- Equity multiple
- 0.80×
- Total profit
- $-7,245
- Equity at exit
- $19,309
- IRR
- -1.0%
- Equity multiple
- 0.94×
- Total profit
- $-2,002
- Equity at exit
- $11,197
Cash invested: $36,260 (down + closing). Projections, not guarantees.
Landlord ↔ Tenant lean methodology
- Overall (STATE)
- 15 Strongly Tenant-Friendly
- State New York
- 15 Strongly Tenant-Friendly · D+10
- County
- — inherits STATE
- City
- — inherits STATE
ZIP-level market 14870
- Home prices YoY
- -28.8%
- Rents YoY
- -1.4%
- Active inventory
- 44
- Price-to-rent
- 5.9×
Monthly cashflow live
- Estimated rent
- $1,842 medium interval (Pro) →
- Mortgage (P&I)
- −$679
- Tax from tax record
- −$425 /mo · $5,095/yr
- Insurance
- −$54
- HOA
- −$0
- Vacancy / Maint / Mgmt
- −$387
- Net cashflow
- $298
Break-even live
Sensitivity live
| Price | -10% $371 | -5% $334 | +0% $298 | +5% $261 | +10% $224 |
|---|---|---|---|---|---|
| Rent | -10% $152 | -5% $225 | +0% $298 | +5% $370 | +10% $443 |
| Rate | -1.0pp $363 | -0.5pp $330 | base $298 | +0.5pp $264 | +1.0pp $230 |
UW: 25.0% down · 7.5% · 30yr · 1.5% tax · 5.0% vac · 8.0% maint · 8.0% mgmt
Financing live
Cash to close
- Down payment
- $32,375
- Closing costs
- $3,885
- Reserves months
- —
- Total cash needed
- —
Loan-product check · same deal, 3 products live
Conventional
25% down · 7.5% · 30yr
- Down + closing
- —
- Monthly P&I
- —
- Monthly cashflow
- —
- DSCR
- —
- Eligible?
- —
Personal DTI + credit; lowest rate.
DSCR
20% down · 8.5% · 30yr
- Down + closing
- —
- Monthly P&I
- —
- Monthly cashflow
- —
- DSCR
- —
- Eligible?
- —
No personal income docs; deal must DSCR.
Hard money
10% down · 12.0% · 12mo
- Down + closing
- —
- Monthly P&I
- —
- Monthly cashflow
- —
- DSCR
- —
- Eligible?
- —
Short-term bridge; refi at stabilization.
Rent comps 1 comps
| Address | Beds | Baths | Sqft | Rent | $/sqft | DOM | Units | Dist |
|---|---|---|---|---|---|---|---|---|
| 12 Pondview Ct Painted Post, NY | 3.0 | 1.0–2.0 | 948 | $1,890 | $1.99 | 45d | 27 | 0.74mi |
Listing history 5 events
-
2026-06-12statusdays on market $129,500 Pending 5 DOM
-
2026-06-09days on market $129,500 Active 4 DOM
-
2026-06-08days on market $129,500 Active 3 DOM
-
2026-06-07remarks 699-char remark
-
2026-06-07$129,500 Active 2 DOM
ⓘ Source: listings_history table (triggers on properties + properties_extension) + one-shot
backfill from property_details.listing_events for pre-trigger history.
Tax reassessment forecast NY · Partial reset (capped growth)
- Current annual tax
- $5,095 · $425/mo
- Projected year-2 tax
- $5,095 · $425/mo
- Expected delta
- $0/yr ($0/mo · 0.0%)
ⓘ Screening estimate from a state-policy table — verify with the county assessor before closing.
Climate risk First Street
- Flood 1/10 Low FEMA zone X · 0% chance over 30 yrs
- Wildfire 2/10 Low
- Heat 3/10 Moderate 7 d/yr ≥92°F today · 17 d/yr by 30 yrs out
- Wind 1/10 Low
- Air quality 1/10 Low 0 unhealthy d/yr today · 0 by 30 yrs out
Nearby sold comps map
Loading sold comps map…
Walkable amenities ~0.75 mi
Loading nearby amenities…
Taxation est. · year 1
- Rental income
- $22,104
- − Mortgage interest
- −$7,254
- − Property taxes
- −$5,095
- − Insurance
- −$648
- − Repairs & maintenance
- −$1,768
- − Management
- −$1,768
- − Depreciation
- −$3,767
- Taxable income
- $1,803
- Est. tax owed @ 24.0%
- −$433
- After-tax cash flow
- $3,137/yr
For passive investors: Depreciation is non-cash, so a rental often shows a tax loss while cash-flowing — sheltering income. Rental losses are passive: they offset passive income freely, and up to $25,000/yr can offset ordinary (W-2) income if you actively participate and your MAGI is under $100k (phasing out to $0 by $150k); unused losses carry forward. On sale, claimed depreciation is recaptured at up to 25%, and gains may owe capital-gains tax (a 1031 exchange can defer both). Figures are a year-1 estimate at your 24.0% rate — not tax advice; consult a CPA.
Schools (NCES district)
- District
- Corning City School District
- NCES district ID
- 3608400
- Math proficiency
- 44% ▼ -12.00%
- Reading proficiency
- 53% ▲ 4.00%
- Median HH income
- $53,042
- Composite
- 41.8/100
- National rank
- #3392
- State rank
- #406 of 590 in NY
Livability — Gang Mills
- Score
- 68/100
- State rank
- #532
- US rank
- #9596
Category grades
Schools grade is shown separately in the Schools card above.
Census & demographics
- Census place
- Gang Mills, NY
- County
- Steuben County · 41,193 people
- City population
- 10,086
- Metro
- Corning, NY
- Population (ZIP)
- 9,795
- Household income
- $84,476
- Rent vs Own
- Severe rent burden
- 289.0
Population outlook (Steuben County) Hauer SSP2
- Today (2025)
- 93,062 people
- By 2030
- 89,793 · -3.5%
- By 2040
- 82,353 · -11.5%
- By 2050
- 74,286 · -20.2%
- By 2075
- 55,589 · -40.3%
- By 2100
- 37,587 · -59.6%
Race, ethnicity, and origin ACS 2023
- Neighborhood character
- Predominantly White (84%)
- Race & ethnicity
- White 84% Asian 8% Two or more races 5% Black 2% Hispanic / Latino 2%
- Common ancestry
- Romanian 7% Italian 3% Slovak 2%
- Foreign-born
- 8% · China, South Korea, Canada
- Languages at home
- 90% English-only · Chinese 4% Other Indo-European 2% Korean 1%
Political lean MEDSL · Steuben
- 2024 margin
- Solid R (+31.8) · D 34.1% · R 65.9%
- 2008→2024 swing
- -15.0pp toward R · 2008: -16.8pp · 2024: -31.8pp
- All cycles
- 2024: R+31.8 2020: R+29.6 2016: R+36.2 2012: R+16.4 2008: R+16.8
Not yet ingested
- Civics
- —
Market trends
- HPI YoY
- ▼ -70.45%
- Current HPI
- 174.2287
- Rent YoY
- ▼ -1.35%
- Metro
- Corning, NY
- State GDP YoY
- ▲ 2.60%
- F500 in state
- 92
Industry mix (Fortune 500 HQ in NY)
| Industry | F500 HQs | Revenue |
|---|---|---|
| Financial Services | 10 | $950B |
|
||
| Consumer Goods | 9 | $162B |
|
||
| Insurance | 4 | $225B |
|
||
| Telecommunications | 2 | $144B |
|
||
| Pharmaceuticals | 2 | $112B |
|
||
| Media / Entertainment | 2 | $69B |
|
||
Price history
1 event — show timeline
- 2026-06-04 Listed $129,500 UNYREIS
Property tax history
+1.2%/yrLatest (2025): $5,095 · +2.8% YoY. Source: county tax records.
Cash-flow waterfall
monthlySold comps — $/sqft
last 12 mo · ≤1 miLoading sold comps…