 Multi-family
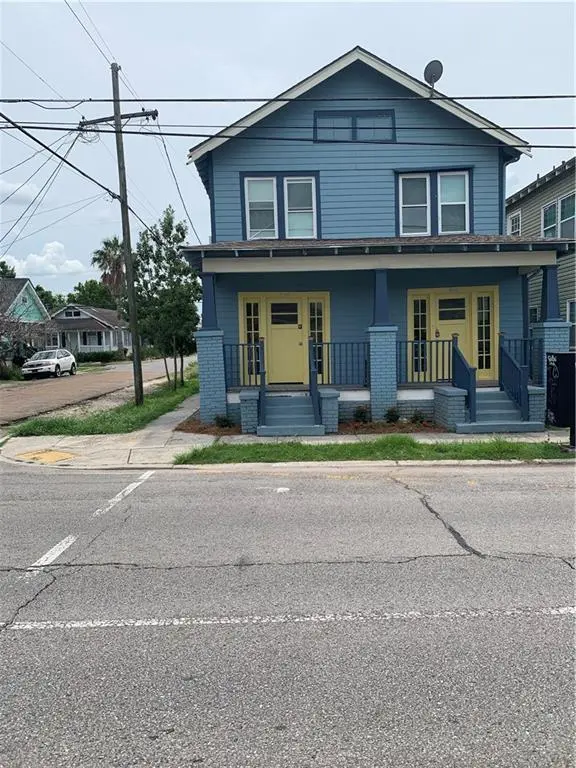
3100-02 Orleans Ave · New Orleans, LA
Flood risk 8/10 · Major
- FEMA flood zone
- AE
- Chance of flooding over 30 yrs
- 0.6%
- Est. flood insurance / yr
- $1,737 – $8,500
Fire risk 1/10 · Minimal
- Est. fire insurance / yr
- $1,269 – $2,357
Heat risk 10/10 · Severe
- Hot days now (above 108°F)
- 7 days/yr
- Hot days in 30 yrs
- 21 days/yr
Wind risk 10/10 · Severe
- Chance of severe wind over 30 yrs
- 99.0%
Air-quality risk 4/10 · Minor
- Unhealthy air days now
- 4 days/yr
- Unhealthy air days in 30 yrs
- 4 days/yr
Risk factors via First Street. Map © Google.
Why this score? — see what drove the C- grade
The composite is a weighted blend of 9 inputs, each scored 0–100. Each bar is that input's sub-score; the figure is the points it added to the 100-point composite (weight × sub-score).
- Cash flow +18.7/30.0
- ARV discount +11.8/15.0
- DSCR +5.9/10.0
- 1% rule +5.0/10.0
- Livability +4.0/5.0
- Condition / age +4.0/5.0
- Rent growth +2.5/5.0
- Schools +1.6/10.0
- Appreciation +0.0/10.0
$299,000
🖨 Deal sheet 📄 Offer letter ✓ Due diligence
Multi-family units
County records classify this as Multi-Family (2-4 Unit). Listing-text estimate: 1 unit. estimate disagrees with records
Listing remarks MLS
Property has some cosmetic improvements including new kitchen cabinets. Located just blocks from the Bayou St. John and Lafitte walking and biking trails, close to public transportation, shopping and restaurants.
Key facts
- New kitchen cabinets
- Shopping
- Restaurants
Tags
Neighborhood map
What this means for you Summary
Snapshot
- This is a 4-bed/2.0-bath multifamily listed at $299k. Condition is rated good.
Deal economics
- At list price, monthly cash flow is $-132 ($-2k/yr) — negative.
- To cash-flow at today's rent, offer at most $280k (6.4% below list).
- To meet the 1% rule (rent ≥ 1% of price), the offer needs to be $299k (0.0% below list).
- Recommended offer: $263k (12.0% below list) — sets the bar for market timing.
- Cap rate 7.5% vs local median 4.4% in New Orleans — top-decile yield for the area; either an underpriced asset or a hidden risk that comps aren't pricing in. Stress-test before assuming the spread holds.
Location & tenants
- Location reads 81/100 on livability (#3 in LA, #1,383 nationally) — a professional / high-income tenant draw. Strengths: amenities A+, commute A+, health & safety A+; Watch: crime C-, employment D.
- Orleans Parish (urban): math 11% / reading 27% proficiency, ranked #69 of 98 in LA (top 70%) — low school quality limits family demand, transient renter base, plan for 1-2y turnover; 68% free/reduced lunch — lower-income household profile, screen leases tightly.
- Market conditions: Rents soft (-0.2%/yr); 381 active listings in the ZIP; 40 comparable units currently listed for rent nearby; rentals at typical pace (median 18d on market — plan ~3-4 weeks tenant-placement turnaround); 710 units permitted in Orleans Parish in 2024 (244 in 5+ unit buildings).
- At $2,989/mo this rent would consume 67% of the median local household income ($53k/yr) (locally 3381% of renters already pay >50% of income on rent) — very limited rent-growth headroom before tenants either downsize or default.
Forward outlook
- Local home prices are declining (-3.0%/yr); year-one equity from $2k of loan paydown is wiped out by about $9k of value loss. Plan a longer hold.
- Orleans County population projected at +61% by 2050 — long-run rental-demand tailwind backs the buy-and-hold thesis.
Negotiation context
- It's been on market 329 days — a 12% lower offer ($263k) is reasonable based on typical stale-listing flexibility.
- 6 sale attempts since 21y ago; this cycle's ask is 22048% above the opening price — seller raised mid-cycle; expect resistance to lowballs.
Risks & watch-outs
- Watch-outs: flood insurance adds $427/mo.
- Climate carrying-cost: in FEMA flood zone AE (mandatory federal flood insurance); severe wind risk, 99% chance of damaging wind over 30y; extreme-heat days projected 7→21/yr by 2055 (HVAC capex compounding) — expect insurance premiums to compound above CPI over the hold.
Questions for the listing agent
- What do current leases actually rent for vs. the listed asking? Can we see a recent rent roll and the last 12 months of T-12 income?
- It's been on market 329 days. Have you received any prior offers? Is the seller open to a 12% concession, seller financing, or rate buy-down credit?
- What's the actual annual flood-insurance premium (NFIP or private), and is the property in a SFHA with mandatory coverage?
- Why hasn't it sold? Are there any deal-killer items the seller is aware of (foundation, flood, title, zoning, code violations)?
- Is there a deadline driving the sale (1031 exchange, divorce, estate, relocation)? That informs how much negotiation room exists.
- What's the average days-on-market for RENTAL listings here right now (not sales)? A rising rental-DOM trend means longer vacancies and softer asking-rent achievability than the comps imply.
- What's the recent tenant-quality profile in this submarket — average credit score on applications, eviction rate, late-payment / NSF rate, and stable-employment percentage? A property-management company in the area should have these aggregated.
- How much new apartment / multifamily construction is in the pipeline within 1–3 miles? Heavy new supply (>2% of stock underway) typically softens rents 12–24 months out; light construction supports rent growth.
Investment metrics
- 1% rule
- 1.00% ✗
- Cap rate
- 7.48%
- Cash-on-cash
- 4.23%
- DSCR
- 1.19
- GRM
- 8.3
CMA / ARV
- ARV (median comp)
- $330,749
- List price
- $299,000
- Delta
- -9.60%
- Verdict
- FAIR
- Comps
- 20 within 1.0 mi
Show comp detail 12 sales within ~0.75 mi
| Address | Dist | Beds/Ba | Sqft | Sold | Price | $/sf | Match |
|---|---|---|---|---|---|---|---|
| 2912 14 St. Peter St | 0.16mi | 4/2.0 | 1,912 (+2%) | 2mo | $290,000 | $152 | 88 |
| 2615 26 Saint Ann St | 0.44mi | 4/2.0 | 1,900 (+1%) | 6mo | $125,000 | $66 | 73 |
| 3150 52 Toulouse St | 0.11mi | 4/4.0 | 1,690 (-10%) | 3mo | $382,000 | $226 | 68 |
| 2601 03 St Ann St | 0.46mi | 4/2.0 | 1,946 (+4%) | 5mo | $220,000 | $113 | 68 |
| 2617 Toulouse St | 0.44mi | 4/4.0 | 1,750 (-7%) | 1mo | $215,000 | $123 | 60 |
| 2755 Banks St | 0.70mi | 4/4.0 | 1,920 (+2%) | 5mo | $285,000 | $148 | 51 |
| 939-941A Picheloup Pl | 0.57mi | 4/3.0 | 2,073 (+11%) | 3mo | $435,000 | $210 | 50 |
| 2216-18 Saint Louis St | 0.73mi | 4/2.0 | 1,689 (-10%) | 1mo | $335,000 | $198 | 49 |
| 124 N Rendon St | 0.38mi | 3/3.0 (-1) | 1,656 (-12%) | 6mo | $308,000 | $186 | 49 |
| 1024 26 N Rocheblave St | 0.65mi | 4/5.0 | 1,826 (-3%) | 6mo | $380,000 | $208 | 48 |
| 422 24 S Clark St | 0.74mi | 3/3.0 (-1) | 1,745 (-7%) | 5mo | $340,000 | $195 | 41 |
| 2328 30 Bienville St | 0.70mi | 5/3.5 (+1) | 2,115 (+13%) | 2mo | $400,000 | $189 | 33 |
Match score weights: distance 35% · size 25% · config 20% · recency 20%. Top-matched comps best support the ARV.
Projected returns pro-forma
-3.0% appreciation · 0.0% rent growth · sell at horizon
- IRR
- -23.5%
- Equity multiple
- 0.22×
- Total profit
- $-65,282
- Equity at exit
- $44,582
- IRR
- -33.1%
- Equity multiple
- -0.20×
- Total profit
- $-100,239
- Equity at exit
- $25,852
Cash invested: $83,720 (down + closing). Projections, not guarantees.
Landlord ↔ Tenant lean methodology
- Overall (STATE)
- 90 Strongly Landlord-Friendly
- State Louisiana
- 90 Strongly Landlord-Friendly · R+12
- County
- — inherits STATE
- City
- — inherits STATE
ZIP-level market 70119
- Home prices YoY
- -34.8%
- Rents YoY
- -0.2%
- Active inventory
- 381
- Price-to-rent
- 16.7×
Monthly cashflow live
- Estimated rent
- $2,989 high interval (Pro) →
- Mortgage (P&I)
- −$1,568
- Tax est. 1.5%
- −$374 /mo · $4,485/yr
- Insurance
- −$125
- Flood insurance flood zone
- −$427 /mo · $5,118/yr
- HOA
- −$0
- Vacancy / Maint / Mgmt
- −$628
- Net cashflow
- $-132
Break-even live
2-unit breakdown (identical units grouped — click to expand)
| Units | Beds | Baths | Est. rent |
|---|---|---|---|
| 2× units | 2 | 1 | $2,990 |
| #1 | 2 | 1 | $1,495 |
| #2 | 2 | 1 | $1,495 |
| Total (2 units) | $2,989 | ||
UW: 25.0% down · 7.5% · 30yr · 1.5% tax · 5.0% vac · 8.0% maint · 8.0% mgmt
Financing live
Cash to close
- Down payment
- $74,750
- Closing costs
- $8,970
- Reserves months
- —
- Total cash needed
- —
Loan-product check · same deal, 3 products live
Conventional
25% down · 7.5% · 30yr
- Down + closing
- —
- Monthly P&I
- —
- Monthly cashflow
- —
- DSCR
- —
- Eligible?
- —
Personal DTI + credit; lowest rate.
DSCR
20% down · 8.5% · 30yr
- Down + closing
- —
- Monthly P&I
- —
- Monthly cashflow
- —
- DSCR
- —
- Eligible?
- —
No personal income docs; deal must DSCR.
Hard money
10% down · 12.0% · 12mo
- Down + closing
- —
- Monthly P&I
- —
- Monthly cashflow
- —
- DSCR
- —
- Eligible?
- —
Short-term bridge; refi at stabilization.
Rent comps 40 comps
| Address | Beds | Baths | Sqft | Rent | $/sqft | DOM | Units | Dist |
|---|---|---|---|---|---|---|---|---|
| 824 N Dupre St New Orleans, LA | 3.0 | 2.0 | 1315 | $2,250 | $1.71 | 17d | 1 | 0.24mi |
| 3700 Orleans Ave New Orleans, LA | 1.0–3.0 | 1.0–2.0 | 1081 | $2,945 | $2.72 | 3d | 48 | 0.38mi |
| 2731 Saint Philip St Unit 2733 New Orleans, LA | 4.0 | 2.0 | 2000 | $2,600 | $1.30 | 24d | 1 | 0.39mi |
| 2738 Bienville St New Orleans, LA | 4.0 | 3.0 | 1671 | $2,200 | $1.32 | 24d | 1 | 0.43mi |
| 3024 Esplanade Ave New Orleans, LA | 3.0 | 2.5 | 2300 | $4,500 | $1.96 | 44d | 1 | 0.45mi |
| 227 S Gayoso St Unit 2h New Orleans, LA | 3.0 | 2.0 | 1800 | $2,500 | $1.39 | 44d | 1 | 0.58mi |
| 2664 Lepage St New Orleans, LA | 3.0 | 2.0 | 1750 | $2,725 | $1.56 | 44d | 1 | 0.61mi |
| 1466 N White St New Orleans, LA | 3.0 | 1.5 | 1500 | $2,250 | $1.50 | 3d | 1 | 0.61mi |
| 305 S Norman C Francis Pkwy New Orleans, LA | 3.0 | 1.5 | 1730 | $2,600 | $1.50 | 17d | 1 | 0.62mi |
| 305 S Norman C Francis Pkwy New Orleans, LA | 3.0 | 1.5 | 1730 | $2,500 | $1.45 | 15d | 1 | 0.62mi |
| 3443 Esplanade Ave New Orleans, LA | 3.0 | 1.0–2.0 | 997 | $2,500 | $2.51 | 3d | 30 | 0.63mi |
| 2912 Palmyra St Unit D New Orleans, LA | 3.0 | 2.0 | 1257 | $1,650 | $1.31 | 24d | 1 | 0.63mi |
| 426 S Lopez St New Orleans, LA | 4.0 | 3.0 | 1400 | $2,300 | $1.64 | 24d | 1 | 0.72mi |
| 315 N Miro St New Orleans, LA | 3.0 | 3.0 | 1276 | $2,500 | $1.96 | 24d | 1 | 0.75mi |
| 315 N Miro St New Orleans, LA | 3.0 | 3.0 | 1276 | $2,300 | $1.80 | 20d | 1 | 0.75mi |
| 3804 Banks St New Orleans, LA | 3.0 | 2.0 | 1353 | $2,250 | $1.66 | 17d | 1 | 0.79mi |
| 2517 Palmyra St New Orleans, LA | 3.0 | 2.0 | 1306 | $2,100 | $1.61 | 17d | 1 | 0.79mi |
| 4227 Saint Ann St New Orleans, LA | 3.0 | 2.0 | 1900 | $2,800 | $1.47 | 3d | 1 | 0.80mi |
| 4226 Dumaine St New Orleans, LA | 3.0 | 2.0 | 1411 | $2,250 | $1.59 | 17d | 1 | 0.80mi |
| 2129 Dumaine St New Orleans, LA | 3.0 | 2.0 | 1226 | $1,850 | $1.51 | 3d | 1 | 0.81mi |
| 326 S Dorgenois St Unit 326 New Orleans, LA | 4.0 | 3.0 | 1510 | $2,300 | $1.52 | 2d | 1 | 0.82mi |
| 4600 S Carrollton Ave Unit 2B New Orleans, LA | 4.0 | 2.0 | 2097 | $2,850 | $1.36 | 24d | 1 | 0.84mi |
| 3825 Baudin St New Orleans, LA | 3.0 | 3.5 | 1680 | $2,000 | $1.19 | 24d | 1 | 0.85mi |
| 2331 Columbus St New Orleans, LA | 3.0 | 1.0 | 1976 | $1,850 | $0.94 | 24d | 1 | 0.86mi |
| 2105 Bienville St New Orleans, LA | 3.0 | 3.0 | 1231 | $2,350 | $1.91 | 17d | 1 | 0.87mi |
| 2033 Conti St New Orleans, LA | 3.0 | 3.0 | 1249 | $2,250 | $1.80 | 15d | 1 | 0.89mi |
| 2329 Laharpe St New Orleans, LA | 3.0 | 1.0 | 1250 | $1,000 | $0.80 | 20d | 1 | 0.91mi |
| 2024 Bienville St New Orleans, LA | 3.0 | 2.0 | 1314 | $2,100 | $1.60 | 24d | 1 | 0.91mi |
| 1929 Dumaine St New Orleans, LA | 3.0 | 1.0 | 1293 | $1,500 | $1.16 | 3d | 1 | 0.94mi |
| 2645 Gravier St Unit 2645-A New Orleans, LA | 3.0 | 1.0 | 1290 | $1,595 | $1.24 | 24d | 1 | 0.94mi |
| 4500 Saint Ann St New Orleans, LA | 3.0 | 2.0 | 1500 | $2,350 | $1.57 | 17d | 1 | 0.96mi |
| 1908 Saint Louis St New Orleans, LA | 3.0 | 3.0 | 1234 | $2,300 | $1.86 | 24d | 1 | 0.97mi |
| 3702 Trafalgar St New Orleans, LA | 3.0 | 2.0 | 1428 | $2,350 | $1.65 | 16d | 1 | 1.00mi |
| 324 N Roman St New Orleans, LA | 3.0 | 3.0 | 2100 | $2,500 | $1.19 | 44d | 1 | 1.02mi |
| 647 S Pierce St New Orleans, LA | 3.0 | 2.0 | 1550 | $3,175 | $2.05 | 15d | 1 | 1.04mi |
| 2651 Poydras St New Orleans, LA | 1.0–4.0 | 1.0–2.0 | 1095 | $2,545 | $2.32 | 2d | 16 | 1.07mi |
| 1901 Gentilly Blvd New Orleans, LA | 3.0 | 2.5 | 2205 | $4,000 | $1.81 | 44d | 1 | 1.20mi |
| 1472 N Claiborne Ave New Orleans, LA | 3.0 | 1.0 | 1312 | $1,900 | $1.45 | 16d | 1 | 1.28mi |
| 1433 Esplanade Ave New Orleans, LA | 3.0 | 2.0 | 2411 | $5,000 | $2.07 | 2d | 1 | 1.28mi |
| 4901 Iberville St New Orleans, LA | 4.0 | 2.5 | 2256 | $3,500 | $1.55 | 44d | 1 | 1.30mi |
Listing history 25 events
-
2026-06-15days on market $299,000 Active 329 DOM
-
2026-06-13days on market $299,000 Active 327 DOM
-
2026-06-10days on market $299,000 Active 324 DOM
-
2026-06-09days on market $299,000 Active 323 DOM
-
2026-06-08days on market $299,000 Active 322 DOM
-
2026-06-07days on market $299,000 Active 321 DOM
-
2026-06-05days on market $299,000 Active 318 DOM
-
2026-06-03days on market $299,000 Active 317 DOM
-
2026-06-02days on market $299,000 Active 316 DOM
-
2026-06-01days on market $299,000 Active 315 DOM
-
2026-05-31days on market $299,000 Active 314 DOM
-
2026-04-29$1,350
-
2026-03-06price $299,000 212-char remark
Show marketing remark (212 chars)
Property has some cosmetic improvements including new kitchen cabinets. Located just blocks from the Bayou St. John and Lafitte walking and biking trails, close to public transportation, shopping and restaurants.
-
2026-03-06price $299,000 212-char remark
Show marketing remark (212 chars)
Property has some cosmetic improvements including new kitchen cabinets. Located just blocks from the Bayou St. John and Lafitte walking and biking trails, close to public transportation, shopping and restaurants.
-
2025-10-20price $284,900 212-char remark
Show marketing remark (212 chars)
Property has some cosmetic improvements including new kitchen cabinets. Located just blocks from the Bayou St. John and Lafitte walking and biking trails, close to public transportation, shopping and restaurants.
-
2025-10-20price $284,900 212-char remark
Show marketing remark (212 chars)
Property has some cosmetic improvements including new kitchen cabinets. Located just blocks from the Bayou St. John and Lafitte walking and biking trails, close to public transportation, shopping and restaurants.
-
2025-08-21price $299,000 212-char remark
Show marketing remark (212 chars)
Property has some cosmetic improvements including new kitchen cabinets. Located just blocks from the Bayou St. John and Lafitte walking and biking trails, close to public transportation, shopping and restaurants.
-
2025-08-21price $299,000 212-char remark
Show marketing remark (212 chars)
Property has some cosmetic improvements including new kitchen cabinets. Located just blocks from the Bayou St. John and Lafitte walking and biking trails, close to public transportation, shopping and restaurants.
-
2025-07-21historical $1,300
-
2025-07-18$324,900 Active 212-char remark
Show marketing remark (212 chars)
Property has some cosmetic improvements including new kitchen cabinets. Located just blocks from the Bayou St. John and Lafitte walking and biking trails, close to public transportation, shopping and restaurants.
-
2025-07-18$324,900 Active 212-char remark
Show marketing remark (212 chars)
Property has some cosmetic improvements including new kitchen cabinets. Located just blocks from the Bayou St. John and Lafitte walking and biking trails, close to public transportation, shopping and restaurants.
-
2025-06-12$1,300
-
2025-03-12historical $1,200
-
2024-11-07$1,200
-
2005-12-20$79,500
ⓘ Source: listings_history table (triggers on properties + properties_extension) + one-shot
backfill from property_details.listing_events for pre-trigger history.
Climate risk First Street
- Flood 8/10 Severe FEMA zone AE · 60% chance over 30 yrs
- Wildfire 1/10 Low
- Heat 10/10 Extreme 7 d/yr ≥108°F today · 21 d/yr by 30 yrs out
- Wind 10/10 Extreme 99% chance of damaging wind over 30 yrs
- Air quality 4/10 Moderate 4 unhealthy d/yr today · 4 by 30 yrs out
Nearby sold comps map
Loading sold comps map…
Walkable amenities ~0.75 mi
Loading nearby amenities…
Taxation est. · year 1
- Rental income
- $35,868
- − Mortgage interest
- −$16,749
- − Property taxes
- −$4,485
- − Insurance
- −$6,614
- − Repairs & maintenance
- −$2,869
- − Management
- −$2,869
- − Depreciation
- −$8,698
- Taxable loss
- −$6,416
- Est. tax savings @ 24.0%
- +$1,540
- After-tax cash flow
- $-39/yr
For passive investors: Depreciation is non-cash, so a rental often shows a tax loss while cash-flowing — sheltering income. Rental losses are passive: they offset passive income freely, and up to $25,000/yr can offset ordinary (W-2) income if you actively participate and your MAGI is under $100k (phasing out to $0 by $150k); unused losses carry forward. On sale, claimed depreciation is recaptured at up to 25%, and gains may owe capital-gains tax (a 1031 exchange can defer both). Figures are a year-1 estimate at your 24.0% rate — not tax advice; consult a CPA.
Condition & rehab AI · 12 photos
This multi-family property is in good condition with recent cosmetic improvements, making it a solid investment opportunity.
Value-add opportunities
- Both Paint exterior siding — Enhances curb appeal and value
- Both Replace air conditioning units — Improves comfort and energy efficiency
- Both Install smart home features — Attracts tech-savvy buyers and renters
Renovation cost estimate screening
Value-add ROI direction
- Both Paint exterior siding — Enhances curb appeal and value ↑
- Both Replace air conditioning units — Improves comfort and energy efficiency ↑
- Both Install smart home features — Attracts tech-savvy buyers and renters ↑
ⓘ Cost ranges are severity-bucket heuristics (US national rule-of-thumb). Get contractor quotes + a written scope before underwriting a rehab budget.
Schools (NCES district)
- District
- Orleans Parish
- NCES district ID
- 2201170
- Math proficiency
- 11% ▼ -52.00%
- Reading proficiency
- 27% ▼ -46.00%
- Median HH income
- $37,011
- Composite
- 15.78/100
- National rank
- #9271
- State rank
- #69 of 98 in LA
Livability — New Orleans
- Score
- 81/100
- State rank
- #3
- US rank
- #1383
Category grades
Schools grade is shown separately in the Schools card above.
Census & demographics
- Census place
- New Orleans, LA
- County
- Orleans Parish · 338,817 people
- City population
- 338,817
- Metro
- New Orleans-Metairie, LA
- Population (ZIP)
- 37,253
- Household income
- $53,143
- Rent vs Own
- Severe rent burden
- 3381.0
Population outlook (Orleans County) Hauer SSP2
- Today (2025)
- 513,025 people
- By 2030
- 575,781 · +12.2%
- By 2040
- 700,174 · +36.5%
- By 2050
- 826,541 · +61.1%
- By 2075
- 1,123,374 · +119.0%
- By 2100
- 1,355,609 · +164.2%
Race, ethnicity, and origin ACS 2023
- Neighborhood character
- Diverse neighborhood (Simpson 0.64)
- Race & ethnicity
- Black 44% White 40% Two or more races 10% Hispanic / Latino 9% Asian 1%
- Hispanic origin (detail)
- Mexican 2%
- Common ancestry
- Lithuanian 8% Slovak 2% Romanian 1%
- Foreign-born
- 6% · Canada, Jamaica
- Languages at home
- 91% English-only · Spanish 6% French/Haitian/Cajun 1% Other Indo-European 0%
Political lean MEDSL · Orleans
- 2024 margin
- Solid D (+67.0) · D 82.2% · R 15.2% · Other 2.7%
- 2008→2024 swing
- +6.7pp toward D · 2008: 60.3pp · 2024: 67.0pp
- All cycles
- 2024: D+67.0 2020: D+68.2 2016: D+66.2 2012: D+62.5 2008: D+60.3
Not yet ingested
- Civics
- —
Market trends
- HPI YoY
- ▼ -135.38%
- Current HPI
- 253.1929
- Rent YoY
- ▼ -0.20%
- Metro
- New Orleans-Metairie, LA
- State GDP YoY
- ▲ 3.29%
- F500 in state
- 10
Industry mix (Fortune 500 HQ in LA)
| Industry | F500 HQs | Revenue |
|---|---|---|
| Telecommunications | 2 | $23B |
|
||
| Utilities | 1 | $12B |
|
||
| Wholesale / Distribution | 1 | $5B |
|
||
| Advertising | 1 | $2B |
|
||
Price history
-98.3% since first listed14 events — show timeline
- 2026-04-29 Listed for Rent $1,350 RAAMLS
- 2026-03-06 Price Changed $299,000 AcadianaMLS
- 2026-03-06 Price Changed $299,000 GSREIN
- 2025-10-20 Price Changed $284,900 AcadianaMLS
- 2025-10-20 Price Changed $284,900 GSREIN
- 2025-08-21 Price Changed $299,000 AcadianaMLS
- 2025-08-21 Price Changed $299,000 GSREIN
- 2025-07-21 Rental Removed $1,300 GSREIN
- 2025-07-18 Listed $324,900 GSREIN
- 2025-07-18 Listed $324,900 AcadianaMLS
- 2025-06-12 Listed for Rent $1,300 GSREIN
- 2025-03-12 Rental Removed $1,200 GSREIN
- 2024-11-07 Listed for Rent $1,200 GSREIN
- 2005-12-20 Listed $79,500 AcadianaMLS
Cash-flow waterfall
monthlySold comps — $/sqft
last 12 mo · ≤1 miLoading sold comps…