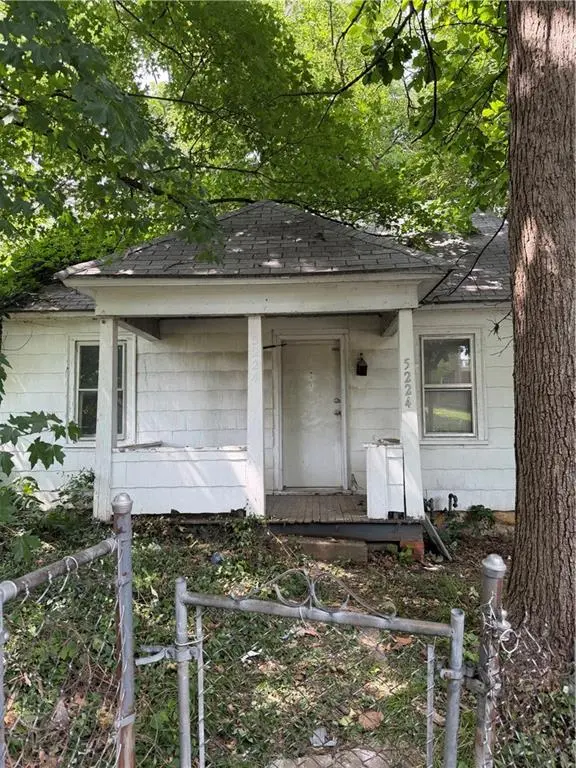
5224 Scarritt Ave · Kansas City, MO
Flood risk 1/10 · Minimal
- FEMA flood zone
- X (unshaded)
- Chance of flooding over 30 yrs
- 0.0%
- Est. flood insurance / yr
- $473 – $860
Fire risk 2/10 · Minimal
- Est. fire insurance / yr
- $1,054 – $1,958
Heat risk 4/10 · Minor
- Hot days now (above 107°F)
- 7 days/yr
- Hot days in 30 yrs
- 17 days/yr
Wind risk 2/10 · Minimal
- Chance of severe wind over 30 yrs
- —
Air-quality risk 3/10 · Minor
- Unhealthy air days now
- 2 days/yr
- Unhealthy air days in 30 yrs
- 3 days/yr
Risk factors via First Street. Map © Google.
Why this score? — see what drove the B- grade
The composite is a weighted blend of 9 inputs, each scored 0–100. Each bar is that input's sub-score; the figure is the points it added to the 100-point composite (weight × sub-score).
- Cash flow +30.0/30.0
- 1% rule +10.0/10.0
- DSCR +10.0/10.0
- ARV discount +7.5/15.0
- Livability +3.9/5.0
- Rent growth +2.5/5.0
- Condition / age +2.5/5.0
- Schools +1.5/10.0
- Appreciation +0.0/10.0
$25,000
🖨 Deal sheet 📄 Offer letter ✓ Due diligence
Listing remarks
Sold as is. Good opportunity to buy a small fixer-upper. Cash only! Proof of funds needs to match buyer on the contract. House needs considerable work. Deadline for offers is Tuesday June 9th at 8:00pm. Buyer needs to be willing to close in a week from contract being accepted. Information deemed reliable but not guaranteed. Buyer and Buyer’s Agent are responsible for independently verifying all information including, but not limited to, square footage, lot size, taxes, schools, HOA information, room dimensions, zoning, permits, property condition, and any other material facts. Listing Broker and Seller make no warranties or representations as to the accuracy of the information provide
Key facts
- 2,396 sq ft lot
- Built 1905
- Listed 11 days
Property features AI
Finance
- Other: Living area reported as 632 (source: public records); Lot size approximately 2,396 square feet (source: public records); Directions: Going west on Independence Ave, take a right at Hardesty Ave, then take left on Scarritt Ave
- HOA & community: No association fees
Exterior
- Parking: Other parking
- Utilities: City/public water (verify); Public sewer; Cable, fiber, and high-speed internet available
- Home design: Single-family residence; Bungalow/Ranch floor plan
- Construction: Asbestos construction materials; Composition roof; Built over 100 years ago
- Exterior features: Front porch; Property listed as fixer; Metal fencing; Located within city limits on a city lot
Interior
- Bedrooms: 2 bedrooms on the first floor
- Bathrooms: 1 full bathroom
- Heating & cooling: No heating; No cooling
- Interior features: Formal dining area; Cellar basement
Neighborhood map
What this means for you Summary
Snapshot
- This is a 1-bed/1.0-bath single-family listed at $25k.
Deal economics
- At list price, monthly cash flow is $588 ($7k/yr) — positive.
- The deal already cash-flows at list — no discount required.
- Meets the 1% rule at list price ($971 rent vs $25k).
- Cap rate 34.5% vs local median 3.9% in Kansas City — top-decile yield for the area; either an underpriced asset or a hidden risk that comps aren't pricing in. Stress-test before assuming the spread holds.
Location & tenants
- Location reads 78/100 on livability (#28 in MO, #2,671 nationally) — a middle-class / working-renter tenant base. Strengths: amenities A+, commute A+, cost of living A+; Watch: schools C-, crime F.
- Kansas City 33 (urban): math 12% / reading 24% proficiency, ranked #308 of 324 in MO (top 95%) — low school quality limits family demand, transient renter base, plan for 1-2y turnover; 75% free/reduced lunch — lower-income household profile, screen leases tightly.
- Market conditions: 59 active listings in the ZIP; 9 comparable units currently listed for rent nearby; rentals at typical pace (median 24d on market — plan ~3-4 weeks tenant-placement turnaround); 4,002 units permitted in Jackson County in 2024 (2,271 in 5+ unit buildings).
Forward outlook
- Local home prices are declining (-3.0%/yr); year-one equity from $173 of loan paydown is wiped out by about $750 of value loss. Plan a longer hold.
- Jackson County population projected at +4% by 2050 — modest demand growth; plan on rents tracking national, not racing it.
- At projected returns (-3.0% appreciation + 3.0% rent growth), your $7k cash investment doubles in ~2 years — after that, you're playing with house money.
Negotiation context
- Only 11 days on market — expect competitive offers; lowballing is unlikely to land.
Risks & watch-outs
- Watch-outs: built in 1905 — expect roof / HVAC / electrical / plumbing capex.
Questions for the listing agent
- Built in 1905 — when were the roof, HVAC, electrical panel, plumbing, and water heater last replaced?
- Is there a deadline driving the sale (1031 exchange, divorce, estate, relocation)? That informs how much negotiation room exists.
- Crime grade is F in this area — have there been break-ins, vandalism, or insurance claims at this property in the last 3 years? What carrier currently insures it and at what premium?
- What's the average days-on-market for RENTAL listings here right now (not sales)? A rising rental-DOM trend means longer vacancies and softer asking-rent achievability than the comps imply.
- What's the recent tenant-quality profile in this submarket — average credit score on applications, eviction rate, late-payment / NSF rate, and stable-employment percentage? A property-management company in the area should have these aggregated.
- How much new for-sale + rental construction is in the pipeline within 1–3 miles? Heavy new supply typically softens prices + rents 12–24 months out; constrained supply supports both.
Investment metrics
- 1% rule
- 3.88% ✓
- Cap rate
- 34.49%
- Cash-on-cash
- 100.72%
- DSCR
- 5.48
- GRM
- 2.1
CMA / ARV
- ARV (on-the-fly)
- $85,952
- Comps found
- 2
Show comp detail 2 sales within ~0.75 mi
| Address | Dist | Beds/Ba | Sqft | Sold | Price | $/sf | Match |
|---|---|---|---|---|---|---|---|
| 445 N Lawndale Ave | 0.33mi | 2/1.0 (+1) | 699 (+11%) | 1mo | $95,000 | $136 | 61 |
| 5700 Smart Ave | 0.44mi | 2/1.0 (+1) | 620 (-2%) | 15mo | $75,000 | $121 | 59 |
Match score weights: distance 35% · size 25% · config 20% · recency 20%. Top-matched comps best support the ARV.
Projected returns pro-forma
-3.0% appreciation · 3.0% rent growth · sell at horizon
- IRR
- —
- Equity multiple
- 5.77×
- Total profit
- $33,388
- Equity at exit
- $3,728
- IRR
- —
- Equity multiple
- 12.05×
- Total profit
- $77,334
- Equity at exit
- $2,162
Cash invested: $7,000 (down + closing). Projections, not guarantees.
Landlord ↔ Tenant lean methodology
- Overall (STATE)
- 81 Strongly Landlord-Friendly
- State Missouri
- 81 Strongly Landlord-Friendly · R+10
- County
- — inherits STATE
- City
- — inherits STATE
ZIP-level market 64123
- Home prices YoY
- -8.3%
- Active inventory
- 59
- Price-to-rent
- 2.1×
Monthly cashflow live
- Estimated rent
- $971 high interval (Pro) →
- Mortgage (P&I)
- −$131
- Tax from tax record
- −$38 /mo · $452/yr
- Insurance
- −$10
- HOA
- −$0
- Vacancy / Maint / Mgmt
- −$204
- Net cashflow
- $588
Break-even live
UW: 25.0% down · 7.5% · 30yr · 1.5% tax · 5.0% vac · 8.0% maint · 8.0% mgmt
Financing live
Cash to close
- Down payment
- $6,250
- Closing costs
- $750
- Reserves months
- —
- Total cash needed
- —
Loan-product check · same deal, 3 products live
Conventional
25% down · 7.5% · 30yr
- Down + closing
- —
- Monthly P&I
- —
- Monthly cashflow
- —
- DSCR
- —
- Eligible?
- —
Personal DTI + credit; lowest rate.
DSCR
20% down · 8.5% · 30yr
- Down + closing
- —
- Monthly P&I
- —
- Monthly cashflow
- —
- DSCR
- —
- Eligible?
- —
No personal income docs; deal must DSCR.
Hard money
10% down · 12.0% · 12mo
- Down + closing
- —
- Monthly P&I
- —
- Monthly cashflow
- —
- DSCR
- —
- Eligible?
- —
Short-term bridge; refi at stabilization.
Rent comps 9 comps
| Address | Beds | Baths | Sqft | Rent | $/sqft | DOM | Units | Dist |
|---|---|---|---|---|---|---|---|---|
| 445 N Lawndale Ave Kansas City, MO | 2.0 | 1.0 | 700 | $1,200 | $1.71 | 23d | 1 | 0.34mi |
| 3913 Scarritt Ave Apt 2W Kansas City, MO | 1.0 | 1.0 | 700 | $800 | $1.14 | 3d | 1 | 0.89mi |
| 301-307 N Gladstone Blvd Unit 307-42 Kansas City, MO | 1.0 | 1.0 | 650 | $850 | $1.31 | 4d | 1 | 0.91mi |
| 307 N Gladstone Blvd Kansas City, MO | 1.0 | 1.0 | 650 | $850 | $1.31 | 44d | 3 | 0.91mi |
| 3600 Saint John Ave Unit 109 Kansas City, MO | 1.0 | 1.0 | 680 | $750 | $1.10 | 44d | 1 | 1.05mi |
| 611 Ewing Ave Unit B Kansas City, MO | 1.0 | 1.0 | 700 | $800 | $1.14 | 23d | 1 | 1.11mi |
| 108 N Indiana Ave Unit 3S Kansas City, MO | 1.0 | 1.0 | 600 | $699 | $1.17 | 44d | 1 | 1.24mi |
| 301 Bellefontaine Ave Unit B Kansas City, MO | 1.0 | 1.0 | 700 | $850 | $1.21 | 17d | 1 | 1.49mi |
| 1616 Hardesty Ave Unit 1-108 Kansas City, MO | 1.0 | 1.0 | 634 | $1,150 | $1.81 | 21d | 1 | 1.49mi |
Listing history 9 events
-
2026-06-17status $25,000 Pending 11 DOM
-
2026-06-17days on market $25,000 Active 11 DOM
-
2026-06-16days on market $25,000 Active 10 DOM
-
2026-06-15days on market $25,000 Active 9 DOM
-
2026-06-13days on market $25,000 Active 7 DOM
-
2026-06-09days on market $25,000 Active 3 DOM
-
2026-06-08days on market $25,000 Active 2 DOM
-
2026-06-07remarks 693-char remark
-
2026-06-07$25,000 Active 1 DOM
ⓘ Source: listings_history table (triggers on properties + properties_extension) + one-shot
backfill from property_details.listing_events for pre-trigger history.
Tax reassessment forecast MO · Resets to sale price
- Current annual tax
- $452 · $38/mo
- Projected year-2 tax
- $452 · $38/mo
- Expected delta
- $0/yr ($0/mo · 0.0%)
ⓘ Screening estimate from a state-policy table — verify with the county assessor before closing.
Climate risk First Street
- Flood 1/10 Low FEMA zone X (unshaded) · 0% chance over 30 yrs
- Wildfire 2/10 Low
- Heat 4/10 Moderate 7 d/yr ≥107°F today · 17 d/yr by 30 yrs out
- Wind 2/10 Low
- Air quality 3/10 Moderate 2 unhealthy d/yr today · 3 by 30 yrs out
Nearby sold comps map
Loading sold comps map…
Walkable amenities ~0.75 mi
Loading nearby amenities…
Taxation est. · year 1
- Rental income
- $11,646
- − Mortgage interest
- −$1,400
- − Property taxes
- −$452
- − Insurance
- −$125
- − Repairs & maintenance
- −$932
- − Management
- −$932
- − Depreciation
- −$727
- Taxable income
- $7,078
- Est. tax owed @ 24.0%
- −$1,699
- After-tax cash flow
- $5,352/yr
For passive investors: Depreciation is non-cash, so a rental often shows a tax loss while cash-flowing — sheltering income. Rental losses are passive: they offset passive income freely, and up to $25,000/yr can offset ordinary (W-2) income if you actively participate and your MAGI is under $100k (phasing out to $0 by $150k); unused losses carry forward. On sale, claimed depreciation is recaptured at up to 25%, and gains may owe capital-gains tax (a 1031 exchange can defer both). Figures are a year-1 estimate at your 24.0% rate — not tax advice; consult a CPA.
Schools (NCES district)
- District
- Kansas City 33
- NCES district ID
- 2916400
- Math proficiency
- 12% ▼ -8.00%
- Reading proficiency
- 24% ▬ 0.00%
- Median HH income
- $35,227
- Composite
- 14.8/100
- National rank
- #9387
- State rank
- #308 of 324 in MO
Livability — Kansas City
- Score
- 78/100
- State rank
- #28
- US rank
- #2671
Category grades
Schools grade is shown separately in the Schools card above.
Census & demographics
- Census place
- Kansas City, MO
- County
- Jackson County · 687,798 people
- City population
- 439,467
- Metro
- Kansas City, MO-KS
- Population (ZIP)
- 11,833
- Household income
- $54,443
- Rent vs Own
- Severe rent burden
- 338.0
Population outlook (Jackson County) Hauer SSP2
- Today (2025)
- 719,589 people
- By 2030
- 731,456 · +1.6%
- By 2040
- 746,689 · +3.8%
- By 2050
- 749,289 · +4.1%
- By 2075
- 736,227 · +2.3%
- By 2100
- 668,210 · -7.1%
Race, ethnicity, and origin ACS 2023
- Neighborhood character
- Diverse neighborhood (Simpson 0.64)
- Race & ethnicity
- Hispanic / Latino 48% White 34% Two or more races 25% Black 10% Asian 5% Native American 2%
- Hispanic origin (detail)
- Mexican 37% Puerto Rican 1% Cuban 3%
- Common ancestry
- Italian 2% Arab 2% Romanian 1%
- Foreign-born
- 22% · Canada, Vietnam, Philippines
- Languages at home
- 58% English-only · Spanish 35% Arabic 2% Vietnamese 1%
Political lean MEDSL · Jackson
- 2024 margin
- D (+19.3) · D 58.9% · R 39.5% · Other 1.6%
- 2008→2024 swing
- -6.1pp toward R · 2008: 25.4pp · 2024: 19.3pp
- All cycles
- 2024: D+19.3 2020: D+22.0 2016: D+16.6 2012: D+19.0 2008: D+25.4
Not yet ingested
- Civics
- —
Market trends
- HPI YoY
- ▼ -35.35%
- Current HPI
- 392.4402
- Rent YoY
- —
- Metro
- Kansas City, MO-KS
- State GDP YoY
- ▲ 1.84%
- F500 in state
- 20
Industry mix (Fortune 500 HQ in MO)
| Industry | F500 HQs | Revenue |
|---|---|---|
| Healthcare | 1 | $163B |
|
||
| Insurance | 1 | $21B |
|
||
| Industrial Technology | 1 | $17B |
|
||
| Retail | 1 | $16B |
|
||
| Industrial Distribution | 1 | $10B |
|
||
| Utilities | 1 | $9B |
|
||
Price history
2 events — show timeline
- 2026-06-06 Listed $25,000 Heartland MLS as Distributed by MLS Grid
- 1987-03-18 Sold (Public Records) — Public Records
Property tax history
+3.2%/yrLatest (2025): $452 · +22.2% YoY. Source: county tax records.
Cash-flow waterfall
monthlySold comps — $/sqft
last 12 mo · ≤1 miLoading sold comps…