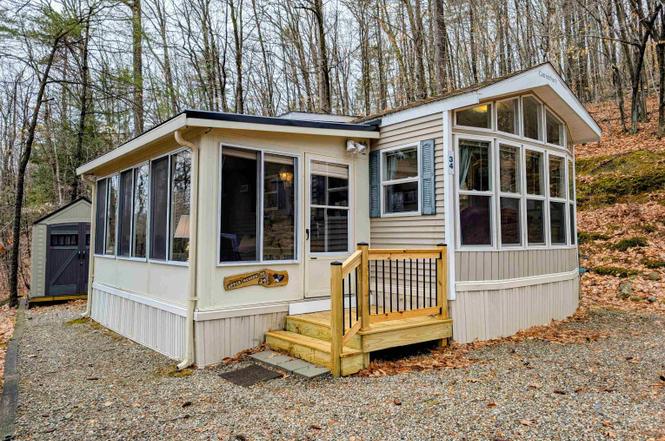
34 Upper Meadows Rd Unit (aka Unit 85} · Holderness, NH
Flood risk 1/10 · Minimal
- FEMA flood zone
- X (unshaded)
- Chance of flooding over 30 yrs
- 0.0%
- Est. flood insurance / yr
- $507 – $1,088
Fire risk 1/10 · Minimal
- Est. fire insurance / yr
- $507 – $941
Heat risk 2/10 · Minimal
- Hot days now (above 91°F)
- 7 days/yr
- Hot days in 30 yrs
- 16 days/yr
Wind risk 3/10 · Minor
- Chance of severe wind over 30 yrs
- 5.0%
Air-quality risk 2/10 · Minimal
- Unhealthy air days now
- 1 days/yr
- Unhealthy air days in 30 yrs
- 1 days/yr
Risk factors via First Street. Map © Google.
Why this score? — see what drove the C- grade
The composite is a weighted blend of 9 inputs, each scored 0–100. Each bar is that input's sub-score; the figure is the points it added to the 100-point composite (weight × sub-score).
- Cash flow +11.7/30.0
- Appreciation +10.0/10.0
- ARV discount +7.5/15.0
- 1% rule +5.0/10.0
- Schools +5.0/10.0
- DSCR +3.4/10.0
- Rent growth +2.5/5.0
- Livability +2.5/5.0
- Condition / age +2.5/5.0
$240,000
🖨 Deal sheet 📄 Offer letter ✓ Due diligence
Listing remarks
Get ready for summer fun with Available Private Beach Access to Squam Lake! Situated on a Deeded Condo Lot within a professionally managed resort community, this fully furnished vacation home is the perfect place to relax, recharge, and create lasting memories with guests. After a day on the water, gather around the fire or unwind in the bright sunroom, where abundant windows bring the outdoors in and provide a peaceful spot to enjoy your morning coffee or a good book. With sleeping accommodations for 6+ guests, including a primary bedroom, a living room with a room divider for added privacy, and two lofts, there's plenty of room for everyone. The property comes furnished with kitchen appli
Key facts
- New entry stairs
- Private beach
- $305 HOA
Tags
Property features AI
Finance
- HOA & community: Condo fees apply (approximately $305 monthly); Association amenities include clubhouse, common acreage, coin laundry, exercise facility, landscaping, playground, heated in-ground pool, recreation facility, snow removal, and trash removal; Roads: association/private/shared dirt road, privately maintained
Exterior
- Parking: Crushed stone driveway
- Utilities: Community water; Community sewer; Circuit breaker electrical service; Cable available; LP/bottle gas available; High-speed internet available
- Home design: Manufactured/Mobile home; Single entry level with a loft (2nd level loft); Shingle - Architectural roof; Unit 85
- Construction: Built in 2001; Vinyl siding construction
- Exterior features: Near country club, golf course, shopping, skiing, snowmobile trails, and hospital; Near paths
Interior
- Kitchen: Combined kitchen and living area
- Bedrooms: Main level bedroom; Loft bedroom on second level
- Bathrooms: 1 full bathroom (main level)
- Heating & cooling: Forced air heating; Central air conditioning
- Interior features: 6 total rooms
Neighborhood map
What this means for you Summary
Snapshot
- This is a 1-bed/1.0-bath single-family listed at $240k.
Deal economics
- At list price, monthly cash flow is $-70 ($-837/yr) — negative.
- To cash-flow at today's rent, offer at most $230k (4.2% below list).
- To meet the 1% rule (rent ≥ 1% of price), the offer needs to be $240k (0.1% below list).
- Recommended offer: $218k (9.0% below list) — sets the bar for market timing.
Location & tenants
- Location reads: area grade C — affects rentability + tenant quality, not the cash-flow math above.
- Pemi-Baker Regional School District (rural): math 45% / reading 70% proficiency, ranked #77 of 171 in NH (top 45%) — acceptable for families but not a draw, mixed tenant base, ~2y average lease.
- Market conditions: 26 active listings in the ZIP; 487 units permitted in Grafton County in 2024 (127 in 5+ unit buildings).
Forward outlook
- In year one you build about $26k of equity ($2k loan paydown + $24k appreciation (10.0% local appreciation)).
- Grafton County population projected at -13% by 2050 — secular population decline; favor cash flow + early exit over multi-decade hold.
- At projected returns (10.0% appreciation + 3.0% rent growth), your $67k cash investment doubles in ~3 years — after that, you're playing with house money.
- By year 2, paydown + projected appreciation supports a ~$41k cash-out refi (75% LTV) — recoverable capital for the next deal without selling this one.
Negotiation context
- It's been on market 98 days — a 9% lower offer ($218k) is reasonable based on typical stale-listing flexibility.
- 3 sale attempts since 9y ago with the ask held roughly flat each time — persistent listings suggest the price (not the market) is what's stuck; bring a comps-based counter.
- Current owner paid $191k; 26% above their basis — modest negotiation headroom, anchor on the comps not their cost.
Questions for the listing agent
- What do current leases actually rent for vs. the listed asking? Can we see a recent rent roll and the last 12 months of T-12 income?
- It's been on market 98 days. Have you received any prior offers? Is the seller open to a 9% concession, seller financing, or rate buy-down credit?
- What does the HOA fee cover, when was the last increase, and are there any pending special assessments or reserve-fund shortfalls?
- Why hasn't it sold? Are there any deal-killer items the seller is aware of (foundation, flood, title, zoning, code violations)?
- Is there a deadline driving the sale (1031 exchange, divorce, estate, relocation)? That informs how much negotiation room exists.
- What's the average days-on-market for RENTAL listings here right now (not sales)? A rising rental-DOM trend means longer vacancies and softer asking-rent achievability than the comps imply.
- What's the recent tenant-quality profile in this submarket — average credit score on applications, eviction rate, late-payment / NSF rate, and stable-employment percentage? A property-management company in the area should have these aggregated.
- How much new for-sale + rental construction is in the pipeline within 1–3 miles? Heavy new supply typically softens prices + rents 12–24 months out; constrained supply supports both.
Investment metrics
- 1% rule
- 1.00% ✗
- Cap rate
- 5.94%
- Cash-on-cash
- -1.25%
- DSCR
- 0.94
- GRM
- 8.3
CMA / ARV
No comps found within radius.
Projected returns pro-forma
10.0% appreciation · 3.0% rent growth · sell at horizon
- IRR
- 23.4%
- Equity multiple
- 2.88×
- Total profit
- $126,489
- Equity at exit
- $216,211
- IRR
- 20.9%
- Equity multiple
- 6.60×
- Total profit
- $376,429
- Equity at exit
- $466,267
Cash invested: $67,200 (down + closing). Projections, not guarantees.
Landlord ↔ Tenant lean methodology
- Overall (STATE)
- 56 Moderately Landlord-Leaning
- State New Hampshire
- 56 Moderately Landlord-Leaning · D+1
- County
- — inherits STATE
- City
- — inherits STATE
ZIP-level market 03245
- Active inventory
- 26
- Price-to-rent
- 8.3×
Monthly cashflow live
- Estimated rent
- $2,397 medium interval (Pro) →
- Mortgage (P&I)
- −$1,259
- Tax est. 1.5%
- −$300 /mo · $3,600/yr
- Insurance
- −$100
- HOA
- −$305
- Vacancy / Maint / Mgmt
- −$503
- Net cashflow
- $-70
Break-even live
UW: 25.0% down · 7.5% · 30yr · 1.5% tax · 5.0% vac · 8.0% maint · 8.0% mgmt
Financing live
Cash to close
- Down payment
- $60,000
- Closing costs
- $7,200
- Reserves months
- —
- Total cash needed
- —
Loan-product check · same deal, 3 products live
Conventional
25% down · 7.5% · 30yr
- Down + closing
- —
- Monthly P&I
- —
- Monthly cashflow
- —
- DSCR
- —
- Eligible?
- —
Personal DTI + credit; lowest rate.
DSCR
20% down · 8.5% · 30yr
- Down + closing
- —
- Monthly P&I
- —
- Monthly cashflow
- —
- DSCR
- —
- Eligible?
- —
No personal income docs; deal must DSCR.
Hard money
10% down · 12.0% · 12mo
- Down + closing
- —
- Monthly P&I
- —
- Monthly cashflow
- —
- DSCR
- —
- Eligible?
- —
Short-term bridge; refi at stabilization.
HOA detail
- Monthly dues
- $305 · $3,660/yr
- Likely covers
- water
Listing history 29 events
-
2026-06-18days on market $240,000 Active 98 DOM
-
2026-06-17days on market $240,000 Active 97 DOM
-
2026-06-16days on market $240,000 Active 96 DOM
-
2026-06-15days on market $240,000 Active 95 DOM
-
2026-06-13days on market $240,000 Active 93 DOM
-
2026-06-12remarks 699-char remark
-
2026-06-12days on market $240,000 Active 92 DOM
-
2026-06-09days on market $240,000 Active 89 DOM
-
2026-06-08days on market $240,000 Active 88 DOM
-
2026-06-07days on market $240,000 Active 87 DOM
-
2026-06-07days on market $240,000 Active 86 DOM
-
2026-06-05days on market $240,000 Active 85 DOM
-
2026-06-04days on market $240,000 Active 83 DOM
-
2026-06-02days on market $240,000 Active 82 DOM
-
2026-06-01days on market $240,000 Active 81 DOM
-
2026-05-31days on market $240,000 Active 80 DOM
-
2026-03-12$240,000 Active
-
2022-06-09soldstatus $191,000 Closed
-
2022-05-14status Pending
-
2022-05-06$185,000 Active
-
2018-08-21soldstatus $97,500 Closed
-
2018-07-23historical Active with Contract
-
2018-07-01price $105,000
-
2018-07-01price $105,000
-
2018-06-20price $107,900
-
2018-06-20price $107,900
-
2018-01-31price $109,900
-
2018-01-31price $109,900
-
2017-09-09$115,000 Active
ⓘ Source: listings_history table (triggers on properties + properties_extension) + one-shot
backfill from property_details.listing_events for pre-trigger history.
Climate risk First Street
- Flood 1/10 Low FEMA zone X (unshaded) · 0% chance over 30 yrs
- Wildfire 1/10 Low
- Heat 2/10 Low 7 d/yr ≥91°F today · 16 d/yr by 30 yrs out
- Wind 3/10 Moderate 5% chance of damaging wind over 30 yrs
- Air quality 2/10 Low 1 unhealthy d/yr today · 1 by 30 yrs out
Nearby sold comps map
Loading sold comps map…
Walkable amenities ~0.75 mi
Loading nearby amenities…
Taxation est. · year 1
- Rental income
- $28,767
- − Mortgage interest
- −$13,444
- − Property taxes
- −$3,600
- − Insurance
- −$1,200
- − Repairs & maintenance
- −$2,301
- − Management
- −$2,301
- − HOA
- −$3,660
- − Depreciation
- −$6,982
- Taxable loss
- −$4,722
- Est. tax savings @ 24.0%
- +$1,133
- After-tax cash flow
- $296/yr
For passive investors: Depreciation is non-cash, so a rental often shows a tax loss while cash-flowing — sheltering income. Rental losses are passive: they offset passive income freely, and up to $25,000/yr can offset ordinary (W-2) income if you actively participate and your MAGI is under $100k (phasing out to $0 by $150k); unused losses carry forward. On sale, claimed depreciation is recaptured at up to 25%, and gains may owe capital-gains tax (a 1031 exchange can defer both). Figures are a year-1 estimate at your 24.0% rate — not tax advice; consult a CPA.
Schools (NCES district)
- District
- Pemi-Baker Regional School District
- NCES district ID
- 3399965
- Math proficiency
- 45% ▲ 10.00%
- Reading proficiency
- 70% ▲ 15.00%
- Median HH income
- $42,275
- Composite
- 49.93/100
- National rank
- #4161
- State rank
- #77 of 171 in NH
Livability — Holderness
No livability data for this city. (Only ~50 U.S. cities are tracked.)
Census & demographics
- Population (ZIP)
- 1,927
Population outlook (Grafton County) Hauer SSP2
- Today (2025)
- 88,798 people
- By 2030
- 87,131 · -1.9%
- By 2040
- 82,000 · -7.7%
- By 2050
- 77,064 · -13.2%
- By 2075
- 68,769 · -22.6%
- By 2100
- 61,631 · -30.6%
Race, ethnicity, and origin ACS 2023
- Neighborhood character
- Predominantly White (94%)
- Race & ethnicity
- White 94% Two or more races 5% Hispanic / Latino 4%
- Common ancestry
- Lithuanian 26% Iranian 5% Romanian 3%
- Foreign-born
- 3% · Canada
- Languages at home
- 94% English-only · Spanish 2% German/W. Germanic 2% French/Haitian/Cajun 1%
Political lean MEDSL · Grafton
- 2024 margin
- D (+19.9) · D 59.4% · R 39.4% · Other 1.2%
- 2008→2024 swing
- -7.8pp toward R · 2008: 27.7pp · 2024: 19.9pp
- All cycles
- 2024: D+19.9 2020: D+24.6 2016: D+19.0 2012: D+23.8 2008: D+27.7
Not yet ingested
- Civics
- —
Market trends
- HPI YoY
- ▲ 119.42%
- Current HPI
- 460.2832
- Rent YoY
- —
- Metro
- —
- State GDP YoY
- —
- F500 in state
- 0
Price history
+108.7% since first listed13 events — show timeline
- 2026-03-12 Listed $240,000 PrimeMLS
- 2022-06-09 Sold (MLS) $191,000 PrimeMLS
- 2022-05-14 Pending — PrimeMLS
- 2022-05-06 Listed $185,000 PrimeMLS
- 2018-08-21 Sold (MLS) $97,500 PrimeMLS
- 2018-07-23 Contingent — PrimeMLS
- 2018-07-01 Price Changed $105,000 PrimeMLS
- 2018-07-01 Price Changed $105,000 PrimeMLS
- 2018-06-20 Price Changed $107,900 PrimeMLS
- 2018-06-20 Price Changed $107,900 PrimeMLS
- 2018-01-31 Price Changed $109,900 PrimeMLS
- 2018-01-31 Price Changed $109,900 PrimeMLS
- 2017-09-09 Listed $115,000 PrimeMLS
Cash-flow waterfall
monthlySold comps — $/sqft
last 12 mo · ≤1 miLoading sold comps…