 🏗️ New Construction
The Emma (212) Plan · Austin, TX
Flood risk 1/10 · Minimal
- FEMA flood zone
- X (unshaded)
- Chance of flooding over 30 yrs
- 0.0%
- Est. flood insurance / yr
- $507 – $1,088
Fire risk 4/10 · Minor
- Est. fire insurance / yr
- $1,222 – $2,270
Heat risk 8/10 · Major
- Hot days now (above 108°F)
- 7 days/yr
- Hot days in 30 yrs
- 22 days/yr
Wind risk 8/10 · Major
- Chance of severe wind over 30 yrs
- 80.0%
Air-quality risk 2/10 · Minimal
- Unhealthy air days now
- 0 days/yr
- Unhealthy air days in 30 yrs
- 1 days/yr
Risk factors via First Street. Map © Google.
Why this score? — see what drove the F grade
The composite is a weighted blend of 9 inputs, each scored 0–100. Each bar is that input's sub-score; the figure is the points it added to the 100-point composite (weight × sub-score).
- ARV discount +7.5/15.0
- Cash flow +5.3/30.0
- Livability +4.1/5.0
- Schools +3.5/10.0
- Condition / age +2.5/5.0
- Rent growth +2.1/5.0
- 1% rule +0.9/10.0
- DSCR +0.0/10.0
- Appreciation +0.0/10.0
$338,990
🖨 Deal sheet 📄 Offer letter ✓ Due diligence
Listing remarks MLS
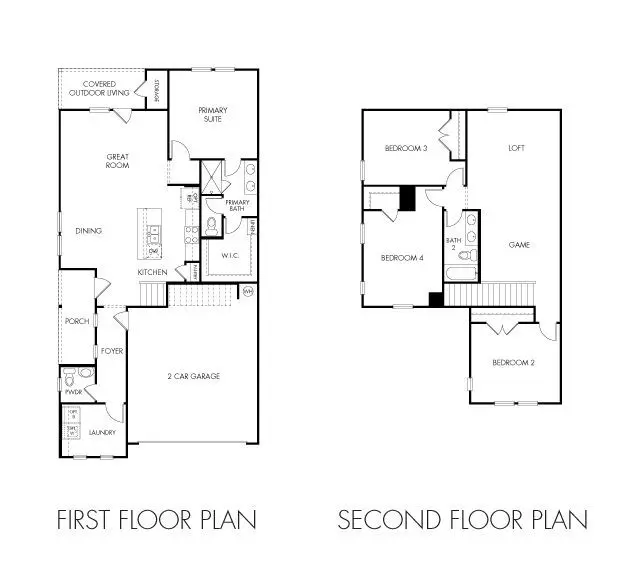
Start your day with a cup of coffee on the Emma's covered patio. The expansive upstairs loft is perfect for hosting game night or movie nights. Retreat to the downstairs primary suite when you need quiet space.
Key facts
- Upstairs loft
- Covered patio
- 2 parking spots
Tags
Neighborhood map
What this means for you Summary
Snapshot
- This is a 4-bed/2.5-bath single-family listed at $339k.
Deal economics
- At list price, monthly cash flow is $-970 ($-12k/yr) — negative.
- To cash-flow at today's rent, offer at most $294k (13.2% below list).
- To meet the 1% rule (rent ≥ 1% of price), the offer needs to be $257k (24.1% below list).
- Recommended offer: $257k (24.1% below list) — sets the bar for 1% rule.
- Cap rate 3.6% vs local median 1.8% in Austin — top-decile yield for the area; either an underpriced asset or a hidden risk that comps aren't pricing in. Stress-test before assuming the spread holds.
Location & tenants
- Location reads 82/100 on livability (#16 in TX, #1,208 nationally) — a professional / high-income tenant draw. Strengths: amenities A+, commute A+, employment A+; Watch: cost of living D, crime F.
- Hays CISD (rural): math 35% / reading 41% proficiency, ranked #390 of 826 in TX (top 47%) — families likely to look elsewhere, expect single-tenant / working-renter base with shorter leases.
- Market conditions: Rents soft (-1.8%/yr); 1002 active listings in the ZIP; 20 comparable units currently listed for rent nearby; rentals at typical pace (median 20d on market — plan ~3-4 weeks tenant-placement turnaround); high-income renter base; 17,121 units permitted in Travis County in 2024 (11,963 in 5+ unit buildings).
Forward outlook
- Local home prices are declining (-3.0%/yr); year-one equity from $3k of loan paydown is wiped out by about $13k of value loss. Plan a longer hold.
- Travis County population projected at +60% by 2050 — long-run rental-demand tailwind backs the buy-and-hold thesis.
Negotiation context
- It's been on market 85 days — a 6% lower offer ($319k) is reasonable based on typical stale-listing flexibility.
Risks & watch-outs
- Climate carrying-cost: severe wind risk, 80% chance of damaging wind over 30y; extreme-heat days projected 7→22/yr by 2055 (HVAC capex compounding) — expect insurance premiums to compound above CPI over the hold.
Questions for the listing agent
- What do current leases actually rent for vs. the listed asking? Can we see a recent rent roll and the last 12 months of T-12 income?
- It's been on market 85 days. Have you received any prior offers? Is the seller open to a 24% concession, seller financing, or rate buy-down credit?
- Why hasn't it sold? Are there any deal-killer items the seller is aware of (foundation, flood, title, zoning, code violations)?
- Is there a deadline driving the sale (1031 exchange, divorce, estate, relocation)? That informs how much negotiation room exists.
- Crime grade is F in this area — have there been break-ins, vandalism, or insurance claims at this property in the last 3 years? What carrier currently insures it and at what premium?
- The area grade is low — what's the realistic commute time and amenity access for the typical tenant pool here? Any planned neighborhood developments (good or bad) we should know about?
- What's the average days-on-market for RENTAL listings here right now (not sales)? A rising rental-DOM trend means longer vacancies and softer asking-rent achievability than the comps imply.
- What's the recent tenant-quality profile in this submarket — average credit score on applications, eviction rate, late-payment / NSF rate, and stable-employment percentage? A property-management company in the area should have these aggregated.
- How much new for-sale + rental construction is in the pipeline within 1–3 miles? Heavy new supply typically softens prices + rents 12–24 months out; constrained supply supports both.
Investment metrics
- 1% rule
- 0.59% ✗
- Cap rate
- 3.61%
- Cash-on-cash
- -9.57%
- DSCR
- 0.57
- GRM
- 14.1
CMA / ARV
- ARV (median comp)
- $434,414
- List price
- $338,990
- Delta
- -21.97%
- Verdict
- UNDERPRICED
- Comps
- 20 within 1.0 mi
Show comp detail 12 sales within ~0.75 mi
| Address | Dist | Beds/Ba | Sqft | Sold | Price | $/sf | Match |
|---|---|---|---|---|---|---|---|
| 6507 Velvet Leaf Ln | 0.01mi | 4/3.0 | 2,043 (-4%) | 2mo | $390,990 | $191 | 89 |
| 6511 Velvet Leaf Ln | 0.00mi | 4/2.5 | 2,029 (-5%) | 5mo | $364,990 | $180 | 88 |
| 6503 Velvet Leaf Ln | 0.03mi | 4/3.0 | 2,043 (-4%) | 4mo | $365,990 | $179 | 86 |
| 6509 Mallord Brook Bnd | 0.25mi | 4/2.5 | 2,103 (-1%) | 2mo | $359,000 | $171 | 84 |
| 6513 Velvet Leaf Ln | 0.01mi | 4/3.0 | 2,043 (-4%) | 9mo | $384,900 | $188 | 84 |
| 6400 Velvet Leaf Ln | 0.12mi | 4/2.0 | 2,020 (-5%) | 7mo | $397,150 | $197 | 78 |
| 6809 Rounded Pebble Ln | 0.20mi | 4/3.0 | 2,201 (+4%) | 9mo | $411,825 | $187 | 75 |
| 6514 Velvet Leaf Ln | 0.03mi | 3/2.0 (-1) | 1,927 (-9%) | 3mo | $399,900 | $208 | 74 |
| 6806 Quiet Stream Way | 0.31mi | 3/3.0 (-1) | 2,168 (+2%) | 9mo | $479,290 | $221 | 68 |
| 13100 Dairywork Rd | 0.33mi | 3/2.5 (-1) | 2,034 (-4%) | 8mo | $399,000 | $196 | 66 |
| 12700 Brave Tenderfoot Trl | 0.30mi | 3/2.0 (-1) | 2,021 (-5%) | 10mo | $454,000 | $225 | 62 |
| 6822 Rounded Pebble Ln | 0.23mi | 3/2.0 (-1) | 1,844 (-13%) | 9mo | $419,691 | $228 | 53 |
Match score weights: distance 35% · size 25% · config 20% · recency 20%. Top-matched comps best support the ARV.
Projected returns pro-forma
-3.0% appreciation · 0.0% rent growth · sell at horizon
- IRR
- -36.7%
- Equity multiple
- -0.15×
- Total profit
- $-139,660
- Equity at exit
- $64,773
- IRR
- -74.8%
- Equity multiple
- -0.89×
- Total profit
- $-230,125
- Equity at exit
- $37,560
Cash invested: $121,636 (down + closing). Projections, not guarantees.
Landlord ↔ Tenant lean methodology
- Overall (STATE)
- 87 Strongly Landlord-Friendly
- State Texas
- 87 Strongly Landlord-Friendly · R+5
- County
- — inherits STATE
- City
- — inherits STATE
ZIP-level market 78610
- Rents YoY
- -1.8%
- Active inventory
- 1002
- Price-to-rent
- 11.0×
Monthly cashflow live
- Estimated rent
- $2,573 high interval (Pro) →
- Mortgage (P&I)
- −$2,278
- Tax est. 1.5%
- −$543 /mo · $6,516/yr
- Insurance
- −$181
- HOA
- −$0
- Vacancy / Maint / Mgmt
- −$540
- Net cashflow
- $-970
Break-even live
UW: 25.0% down · 7.5% · 30yr · 1.5% tax · 5.0% vac · 8.0% maint · 8.0% mgmt
Financing live
Cash to close
- Down payment
- $108,604
- Closing costs
- $13,032
- Reserves months
- —
- Total cash needed
- —
Loan-product check · same deal, 3 products live
Conventional
25% down · 7.5% · 30yr
- Down + closing
- —
- Monthly P&I
- —
- Monthly cashflow
- —
- DSCR
- —
- Eligible?
- —
Personal DTI + credit; lowest rate.
DSCR
20% down · 8.5% · 30yr
- Down + closing
- —
- Monthly P&I
- —
- Monthly cashflow
- —
- DSCR
- —
- Eligible?
- —
No personal income docs; deal must DSCR.
Hard money
10% down · 12.0% · 12mo
- Down + closing
- —
- Monthly P&I
- —
- Monthly cashflow
- —
- DSCR
- —
- Eligible?
- —
Short-term bridge; refi at stabilization.
Rent comps 20 comps
| Address | Beds | Baths | Sqft | Rent | $/sqft | DOM | Units | Dist |
|---|---|---|---|---|---|---|---|---|
| 12603 Purple Prairie Ln Buda, TX | 4.0 | 3.0 | 2691 | $2,995 | $1.11 | 4d | 1 | 0.12mi |
| 6501 Dragride Rd Buda, TX | 5.0 | 3.0 | 2585 | $2,595 | $1.00 | 16d | 1 | 0.14mi |
| 6400 Rounded Pebble Ln Buda, TX | 5.0 | 3.0 | 2812 | $2,997 | $1.07 | 10d | 1 | 0.17mi |
| 12309 Dairywork Rd Buda, TX | 4.0 | 2.0 | 1688 | $2,300 | $1.36 | 43d | 1 | 0.24mi |
| 6401 Mallord Brook Bnd Buda, TX | 4.0 | 2.5 | 2072 | $2,900 | $1.40 | 43d | 1 | 0.27mi |
| 13013 Barrister Ln Buda, TX | 3.0 | 2.5 | 1591 | $2,050 | $1.29 | 43d | 1 | 0.27mi |
| 13107 Barrister Ln Buda, TX | 3.0 | 2.5 | 1591 | $2,200 | $1.38 | 43d | 1 | 0.29mi |
| 12809 Village Spun Plz Buda, TX | 3.0 | 2.5 | 1755 | $2,000 | $1.14 | 24d | 1 | 0.36mi |
| 11633 Lago de Garda Dr Austin, TX | 3.0 | 2.0 | 1513 | $1,995 | $1.32 | 43d | 1 | 1.06mi |
| 11628 Lago de Garda Dr Austin, TX | 5.0 | 2.5 | 2637 | $2,695 | $1.02 | 4d | 1 | 1.07mi |
| 11620 Comano Dr Austin, TX | 3.0 | 2.0 | 1547 | $2,600 | $1.68 | 4d | 1 | 1.10mi |
| 11416 Milano Dr Austin, TX | 3.0 | 2.5 | 1698 | $2,050 | $1.21 | 43d | 1 | 1.22mi |
| 11701 Domenico Cv Austin, TX | 3.0 | 2.0 | 1514 | $1,995 | $1.32 | 16d | 1 | 1.25mi |
| 5705 Respinto Dr Austin, TX | 3.0 | 2.0 | 1533 | $2,150 | $1.40 | 20d | 1 | 1.26mi |
| 5604 Respinto Dr Austin, TX | 3.0 | 2.0 | 1441 | $1,920 | $1.33 | 3d | 1 | 1.27mi |
| 11612 Domenico Cv Austin, TX | 3.0 | 2.5 | 1668 | $2,400 | $1.44 | 17d | 1 | 1.28mi |
| 4907 Escape Rivera Dr Austin, TX | 3.0 | 2.0 | 1718 | $2,350 | $1.37 | 17d | 1 | 1.31mi |
| 11513 Murano Dr Austin, TX | 4.0 | 2.0 | 1468 | $2,100 | $1.43 | 43d | 1 | 1.34mi |
| 11802 Hurricane Haze Dr Austin, TX | 3.0 | 2.5 | 2146 | $2,845 | $1.33 | 20d | 1 | 1.43mi |
| 11313 County Down Dr Austin, TX | 4.0 | 2.0 | 2334 | $2,900 | $1.24 | 14d | 1 | 1.45mi |
Listing history 14 events
-
2026-06-18days on market $338,990 Active 85 DOM
-
2026-06-17days on market $338,990 Active 84 DOM
-
2026-06-16days on market $338,990 Active 83 DOM
-
2026-06-15days on market $338,990 Active 82 DOM
-
2026-06-13days on market $338,990 Active 80 DOM
-
2026-06-09days on market $338,990 Active 76 DOM
-
2026-06-08days on market $338,990 Active 75 DOM
-
2026-06-07days on market $338,990 Active 74 DOM
-
2026-06-05days on market $338,990 Active 71 DOM
-
2026-06-03days on market $338,990 Active 70 DOM
-
2026-06-02days on market $338,990 Active 69 DOM
-
2026-06-01days on market $338,990 Active 68 DOM
-
2026-05-31days on market $338,990 Active 67 DOM
-
2026-03-25$338,990 Active 210-char remark
Show marketing remark (210 chars)
Start your day with a cup of coffee on the Emma's covered patio. The expansive upstairs loft is perfect for hosting game night or movie nights. Retreat to the downstairs primary suite when you need quiet space.
ⓘ Source: listings_history table (triggers on properties + properties_extension) + one-shot
backfill from property_details.listing_events for pre-trigger history.
Climate risk First Street
- Flood 1/10 Low FEMA zone X (unshaded) · 0% chance over 30 yrs
- Wildfire 4/10 Moderate
- Heat 8/10 Severe 7 d/yr ≥108°F today · 22 d/yr by 30 yrs out
- Wind 8/10 Severe 80% chance of damaging wind over 30 yrs
- Air quality 2/10 Low 0 unhealthy d/yr today · 1 by 30 yrs out
Nearby sold comps map
Loading sold comps map…
Walkable amenities ~0.75 mi
Loading nearby amenities…
Taxation est. · year 1
- Rental income
- $30,871
- − Mortgage interest
- −$24,334
- − Property taxes
- −$6,516
- − Insurance
- −$2,172
- − Repairs & maintenance
- −$2,470
- − Management
- −$2,470
- − Depreciation
- −$12,638
- Taxable loss
- −$19,728
- Est. tax savings @ 24.0%
- +$4,735
- After-tax cash flow
- $-6,903/yr
For passive investors: Depreciation is non-cash, so a rental often shows a tax loss while cash-flowing — sheltering income. Rental losses are passive: they offset passive income freely, and up to $25,000/yr can offset ordinary (W-2) income if you actively participate and your MAGI is under $100k (phasing out to $0 by $150k); unused losses carry forward. On sale, claimed depreciation is recaptured at up to 25%, and gains may owe capital-gains tax (a 1031 exchange can defer both). Figures are a year-1 estimate at your 24.0% rate — not tax advice; consult a CPA.
Schools (NCES district)
- District
- Hays CISD
- NCES district ID
- 4800010
- Math proficiency
- 35% ▼ -15.00%
- Reading proficiency
- 41% ▼ -5.00%
- Median HH income
- $70,570
- Composite
- 34.78/100
- National rank
- #5118
- State rank
- #390 of 826 in TX
Livability — Austin
- Score
- 82/100
- State rank
- #16
- US rank
- #1208
Category grades
Schools grade is shown separately in the Schools card above.
Census & demographics
- County
- Hays County · 280,138 people
- City population
- 1,066,854
- Metro
- Austin-Round Rock-Georgetown, TX
- Population (ZIP)
- 48,319
- Household income
- $119,698
- Rent vs Own
- Severe rent burden
- 611.0
Population outlook (Travis County) Hauer SSP2
- Today (2025)
- 1,545,133 people
- By 2030
- 1,729,269 · +11.9%
- By 2040
- 2,097,596 · +35.8%
- By 2050
- 2,463,890 · +59.5%
- By 2075
- 3,249,374 · +110.3%
- By 2100
- 3,801,868 · +146.1%
Race, ethnicity, and origin ACS 2023
- Neighborhood character
- Diverse neighborhood (Simpson 0.58)
- Race & ethnicity
- White 49% Hispanic / Latino 42% Two or more races 17% Black 4% Asian 2%
- Hispanic origin (detail)
- Mexican 35%
- Common ancestry
- Italian 2% Romanian 2% Lithuanian 2%
- Foreign-born
- 10% · Canada, Jamaica, South Korea
- Languages at home
- 76% English-only · Spanish 20% Arabic 2% Other Indo-European 1%
Political lean MEDSL · Travis
- 2024 margin
- Solid D (+39.3) · D 68.8% · R 29.4% · Other 1.8%
- 2008→2024 swing
- +9.9pp toward D · 2008: 29.4pp · 2024: 39.3pp
- All cycles
- 2024: D+39.3 2020: D+45.0 2016: D+38.9 2012: D+23.9 2008: D+29.4
Not yet ingested
- Civics
- —
Market trends
- HPI YoY
- ▼ -161.50%
- Current HPI
- 220.6824
- Rent YoY
- ▼ -1.80%
- Metro
- Austin-Round Rock-Georgetown, TX
- State GDP YoY
- ▲ 3.95%
- F500 in state
- 110
Industry mix (Fortune 500 HQ in TX)
| Industry | F500 HQs | Revenue |
|---|---|---|
| Energy | 16 | $1,198B |
|
||
| Technology | 5 | $198B |
|
||
| Engineering / Construction | 4 | $72B |
|
||
| Energy Services | 3 | $60B |
|
||
| Utilities | 3 | $41B |
|
||
| Healthcare | 2 | $330B |
|
||
Price history
1 event — show timeline
- 2026-03-25 Listed $338,990 Zillow
Cash-flow waterfall
monthlySold comps — $/sqft
last 12 mo · ≤1 miLoading sold comps…