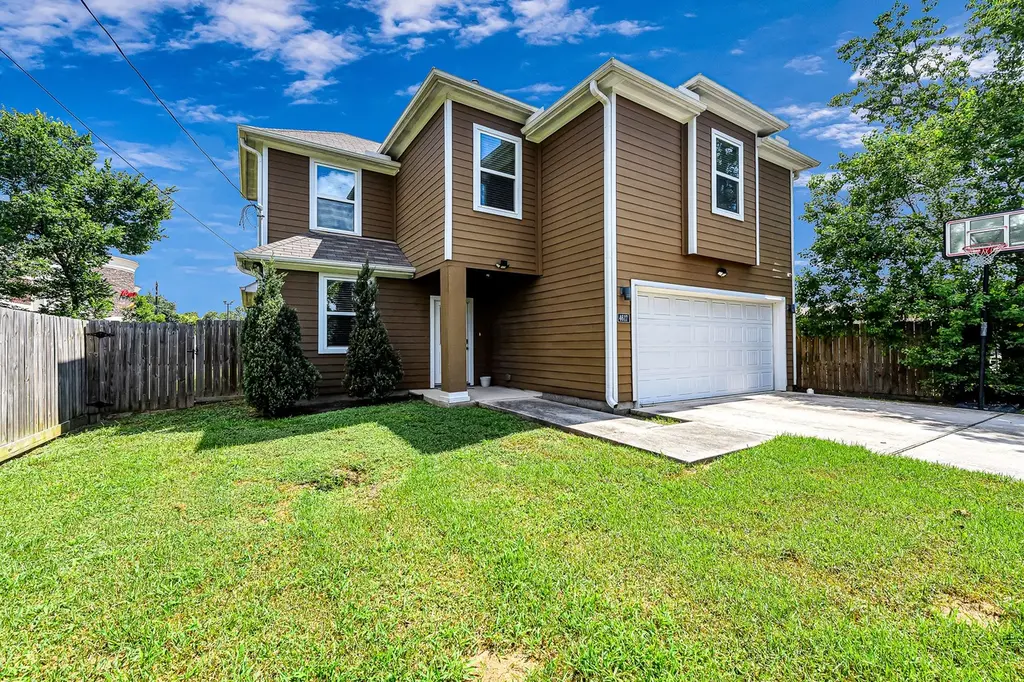
4617 White Rock St · Houston, TX
Flood risk 6/10 · Moderate
- FEMA flood zone
- X (unshaded)
- Chance of flooding over 30 yrs
- 0.71%
- Est. flood insurance / yr
- $507 – $1,088
Fire risk 1/10 · Minimal
- Est. fire insurance / yr
- $1,222 – $2,270
Heat risk 9/10 · Severe
- Hot days now (above 109°F)
- 7 days/yr
- Hot days in 30 yrs
- 22 days/yr
Wind risk 9/10 · Severe
- Chance of severe wind over 30 yrs
- 99.0%
Air-quality risk 2/10 · Minimal
- Unhealthy air days now
- 2 days/yr
- Unhealthy air days in 30 yrs
- 2 days/yr
Risk factors via First Street. Map © Google.
Why this score? — see what drove the D- grade
The composite is a weighted blend of 9 inputs, each scored 0–100. Each bar is that input's sub-score; the figure is the points it added to the 100-point composite (weight × sub-score).
- Appreciation +10.0/10.0
- Cash flow +7.7/30.0
- Rent growth +3.7/5.0
- Livability +3.7/5.0
- 1% rule +2.8/10.0
- ARV discount +2.8/15.0
- Schools +2.7/10.0
- Condition / age +2.5/5.0
- DSCR +1.8/10.0
$320,000
🖨 Deal sheet (PDF) 📄 Offer letter ✓ Due diligence
Listing remarks MLS
Don't miss out on this stunning 4 bed, 2.5 bath home with a spacious yard! Enjoy the open concept layout, abundant natural light, and modern finishes throughout. The first-floor primary suite features a luxurious bath with double sinks, separate shower, and tub. Upstairs, you'll find three large bedrooms . The backyard is perfect for entertaining with no back neighbors. Conveniently located near Med ctr, downtown Houston, NRG stadium, shopping, dining, and entertainment, with easy access to major highways. NO HOA! Schedule your showing today before it's gone! *pics prior to current tenant moving in*
Key facts
- Spacious yard
- Luxurious bath
- No back neighbors
Tags
Neighborhood map
What this means for you Summary
Snapshot
- This is a 3-bed/2.5-bath single-family listed at $320k.
Deal economics
- At list price, monthly cash flow is $-377 ($-5k/yr) — negative.
- To cash-flow at today's rent, offer at most $253k (20.8% below list).
- To meet the 1% rule (rent ≥ 1% of price), the offer needs to be $248k (22.5% below list).
- Recommended offer: $248k (22.5% below list) — sets the bar for 1% rule.
- Cap rate 4.9% vs local median 3.2% in Houston — top-decile yield for the area; either an underpriced asset or a hidden risk that comps aren't pricing in. Stress-test before assuming the spread holds.
Location & tenants
- Location reads 74/100 on livability (#184 in TX, #4,771 nationally) — a middle-class / working-renter tenant base. Strengths: amenities A+, cost of living A+, housing A+; Watch: schools D, crime F.
- Houston ISD (urban): math 27% / reading 35% proficiency, ranked #593 of 826 in TX (top 72%) — families likely to look elsewhere, expect single-tenant / working-renter base with shorter leases; 71% free/reduced lunch — lower-income household profile, screen leases tightly.
- Market conditions: Rents rising fast (+4.8%/yr); 315 active listings in the ZIP; 40 comparable units currently listed for rent nearby; rentals at typical pace (median 25d on market — plan ~3-4 weeks tenant-placement turnaround); 40% of comp listings sitting > 30 days — soft ceiling on asking rent; lower-income renter base — watch delinquency; 29,883 units permitted in Harris County in 2024 (8,621 in 5+ unit buildings).
- At $2,481/mo this rent would consume 80% of the median local household income ($37k/yr) (locally 1446% of renters already pay >50% of income on rent) — very limited rent-growth headroom before tenants either downsize or default.
Forward outlook
- In year one you build about $34k of equity ($2k loan paydown + $32k appreciation (10.0% local appreciation)).
- Harris County population projected at +47% by 2050 — long-run rental-demand tailwind backs the buy-and-hold thesis.
- By year 2, paydown + projected appreciation supports a ~$55k cash-out refi (75% LTV) — recoverable capital for the next deal without selling this one.
Negotiation context
- It's been on market 104 days — a 9% lower offer ($291k) is reasonable based on typical stale-listing flexibility.
- 15 sale attempts since 9y ago; this cycle's ask is 14784% above the opening price — seller raised mid-cycle; expect resistance to lowballs.
Risks & watch-outs
- Climate carrying-cost: major flood risk; severe wind risk, 99% chance of damaging wind over 30y; extreme-heat days projected 7→22/yr by 2055 (HVAC capex compounding) — expect insurance premiums to compound above CPI over the hold.
Questions for the listing agent
- What do current leases actually rent for vs. the listed asking? Can we see a recent rent roll and the last 12 months of T-12 income?
- It's been on market 104 days. Have you received any prior offers? Is the seller open to a 22% concession, seller financing, or rate buy-down credit?
- Why hasn't it sold? Are there any deal-killer items the seller is aware of (foundation, flood, title, zoning, code violations)?
- Is there a deadline driving the sale (1031 exchange, divorce, estate, relocation)? That informs how much negotiation room exists.
- Schools are D-rated, which usually means shorter tenancies and higher turnover. Who's the typical renter profile here, and what's been the actual vacancy rate?
- Crime grade is F in this area — have there been break-ins, vandalism, or insurance claims at this property in the last 3 years? What carrier currently insures it and at what premium?
- The area grade is low — what's the realistic commute time and amenity access for the typical tenant pool here? Any planned neighborhood developments (good or bad) we should know about?
- What's the average days-on-market for RENTAL listings here right now (not sales)? A rising rental-DOM trend means longer vacancies and softer asking-rent achievability than the comps imply.
- What's the recent tenant-quality profile in this submarket — average credit score on applications, eviction rate, late-payment / NSF rate, and stable-employment percentage? A property-management company in the area should have these aggregated.
- How much new for-sale + rental construction is in the pipeline within 1–3 miles? Heavy new supply typically softens prices + rents 12–24 months out; constrained supply supports both.
Investment metrics
- 1% rule
- 0.78% ✗
- Cap rate
- 4.88%
- Cash-on-cash
- -5.05%
- DSCR
- 0.78
- GRM
- 10.7
CMA / ARV
- ARV (median comp)
- $289,489
- List price
- $320,000
- Delta
- 10.54%
- Verdict
- OVERPRICED
- Comps
- 20 within 1.0 mi
Show comp detail 12 sales within ~0.75 mi
| Address | Dist | Beds/Ba | Sqft | Sold | Price | $/sf | Match |
|---|---|---|---|---|---|---|---|
| 4427 Elmwood St | 0.35mi | 3/2.5 | 1,995 (+1%) | 4mo | $310,000 | $155 | 78 |
| 4425 Elmwood St | 0.35mi | 3/2.5 | 1,995 (+1%) | 4mo | $310,000 | $155 | 78 |
| 4830 Teton St | 0.26mi | 4/3.0 (+1) | 1,912 (-3%) | 3mo | $270,000 | $141 | 74 |
| 4819 Lingonberry St | 0.41mi | 3/2.0 | 2,019 (+3%) | 1mo | $155,000 | $77 | 74 |
| 4418 Rosemont St | 0.39mi | 4/3.5 (+1) | 1,961 (-0%) | 1mo | $250,000 | $127 | 72 |
| 5022 Bricker St | 0.36mi | 3/2.0 | 1,767 (-10%) | 4mo | $219,000 | $124 | 61 |
| 4516 Galesburg St Unit B | 0.42mi | 3/2.5 | 2,186 (+11%) | 1mo | $289,900 | $133 | 61 |
| 4747 Clover St | 0.73mi | 3/2.0 | 1,851 (-6%) | 1mo | $247,500 | $134 | 54 |
| 4911 Edfield St | 0.36mi | 4/1.5 (+1) | 1,737 (-12%) | 6mo | $144,900 | $83 | 50 |
| 5007 Edfield St | 0.41mi | 4/1.5 (+1) | 1,703 (-13%) | 3mo | $145,000 | $85 | 47 |
| 5122 Southwind St | 0.74mi | 2/2.5 (-1) | 2,135 (+8%) | 0mo | $880,000 | $412 | 46 |
| 4357 Maggie St | 0.71mi | 4/3.0 (+1) | 1,781 (-10%) | 3mo | $239,950 | $135 | 41 |
Match score weights: distance 35% · size 25% · config 20% · recency 20%. Top-matched comps best support the ARV.
Projected returns pro-forma
10.0% appreciation · 4.77% rent growth · sell at horizon
- IRR
- 21.3%
- Equity multiple
- 2.73×
- Total profit
- $154,898
- Equity at exit
- $288,281
- IRR
- 19.6%
- Equity multiple
- 6.41×
- Total profit
- $485,049
- Equity at exit
- $621,690
Cash invested: $89,600 (down + closing). Projections, not guarantees.
Landlord ↔ Tenant lean methodology
- Overall (STATE)
- 87 Strongly Landlord-Friendly
- State Texas
- 87 Strongly Landlord-Friendly · R+5
- County
- — inherits STATE
- City
- — inherits STATE
ZIP-level market 77051
- Home prices YoY
- 9.7%
- Rents YoY
- 4.8%
- Active inventory
- 315
- Price-to-rent
- 10.7×
Monthly cashflow live
- Estimated rent
- $2,481 high interval (Pro) →
- Mortgage (P&I)
- −$1,678
- Tax from tax record
- −$525 /mo · $6,304/yr
- Insurance
- −$133
- HOA
- −$0
- Vacancy / Maint / Mgmt
- −$521
- Net cashflow
- $-377
Break-even live
Sensitivity live
| Price | -10% $-196 | -5% $-286 | +0% $-377 | +5% $-467 | +10% $-558 |
|---|---|---|---|---|---|
| Rent | -10% $-573 | -5% $-475 | +0% $-377 | +5% $-279 | +10% $-181 |
| Rate | -1.0pp $-216 | -0.5pp $-295 | base $-377 | +0.5pp $-460 | +1.0pp $-544 |
UW: 25.0% down · 7.5% · 30yr · 1.5% tax · 5.0% vac · 8.0% maint · 8.0% mgmt
Financing live
Cash to close
- Down payment
- $80,000
- Closing costs
- $9,600
- Reserves months
- —
- Total cash needed
- —
Loan-product check · same deal, 3 products live
Conventional
25% down · 7.5% · 30yr
- Down + closing
- —
- Monthly P&I
- —
- Monthly cashflow
- —
- DSCR
- —
- Eligible?
- —
Personal DTI + credit; lowest rate.
DSCR
20% down · 8.5% · 30yr
- Down + closing
- —
- Monthly P&I
- —
- Monthly cashflow
- —
- DSCR
- —
- Eligible?
- —
No personal income docs; deal must DSCR.
Hard money
10% down · 12.0% · 12mo
- Down + closing
- —
- Monthly P&I
- —
- Monthly cashflow
- —
- DSCR
- —
- Eligible?
- —
Short-term bridge; refi at stabilization.
Rent comps 40 comps
| Address | Beds | Baths | Sqft | Rent | $/sqft | DOM | Units | Dist |
|---|---|---|---|---|---|---|---|---|
| 4601 White Rock St Unit A Houston, TX | 3.0 | 2.5 | 1700 | $2,500 | $1.47 | 44d | 1 | 0.08mi |
| 8107 Calhoun Rd Houston, TX | 3.0 | 2.5 | 1304 | $2,250 | $1.73 | 25d | 1 | 0.09mi |
| 4613 Bricker St Unit B Houston, TX | 3.0 | 2.5 | 1600 | $2,300 | $1.44 | 44d | 1 | 0.12mi |
| 4609 Bricker St Unit B Houston, TX | 3.0 | 2.5 | 1300 | $3,500 | $2.69 | 13d | 1 | 0.13mi |
| 4609 Bricker St Unit ABC Houston, TX | 3.0 | 2.5 | 1375 | $3,500 | $2.55 | 12d | 1 | 0.13mi |
| 4835 Sunflower St Unit 1546466P Houston, TX | 3.0 | 2.0 | 1883 | $4,516 | $2.40 | 16d | 1 | 0.14mi |
| 8606 Lee Otis St Houston, TX | 4.0 | 2.5 | 1869 | $1,975 | $1.06 | 0d | 1 | 0.24mi |
| 4406 Sterling St Houston, TX | 3.0 | 2.5 | 1840 | $1,999 | $1.09 | 17d | 1 | 0.38mi |
| 4530 Mayflower St Houston, TX | 3.0 | 2.0 | 1302 | $1,800 | $1.38 | 44d | 1 | 0.39mi |
| 4514 Galesburg St Unit B Houston, TX | 3.0 | 2.5 | 1680 | $3,500 | $2.08 | 25d | 1 | 0.42mi |
| 4526 Knoxville St Unit A Houston, TX | 3.0 | 2.5 | 1474 | $1,775 | $1.20 | 16d | 1 | 0.45mi |
| 7710 Darnay Dr Houston, TX | 3.0 | 3.0 | 1635 | $2,095 | $1.28 | 44d | 1 | 0.53mi |
| 4117 Shelby Cir Unit 1230900P Houston, TX | 4.0 | 2.0 | 1367 | $5,253 | $3.84 | 0d | 1 | 0.61mi |
| 5222 Northridge Dr Houston, TX | 4.0 | 2.0 | 1300 | $1,850 | $1.42 | 25d | 1 | 0.69mi |
| 7358 Guadalcanal Rd Houston, TX | 3.0 | 3.0 | 1768 | $2,195 | $1.24 | 44d | 1 | 0.71mi |
| 5201 Kenilwood Dr Unit B Houston, TX | 3.0 | 2.0 | 2442 | $1,725 | $0.71 | 15d | 1 | 0.72mi |
| 4538 Clover St Houston, TX | 4.0 | 2.0 | 1768 | $1,595 | $0.90 | 44d | 1 | 0.75mi |
| 4723 Mallow St Houston, TX | 3.0 | 2.5 | 1472 | $1,850 | $1.26 | 6d | 1 | 0.76mi |
| 5314 Longmeadow St Houston, TX | 3.0 | 3.0 | 1646 | $1,900 | $1.15 | 44d | 1 | 0.87mi |
| 3620 Du Bois St Unit 1302349P Houston, TX | 3.0 | 2.5 | 1797 | $2,945 | $1.64 | 4d | 1 | 0.89mi |
| 7321 Conley St Unit A Houston, TX | 3.0 | 2.5 | 1869 | $2,025 | $1.08 | 21d | 1 | 0.89mi |
| 7321 Conley St Unit B Houston, TX | 3.0 | 2.0 | 1501 | $2,025 | $1.35 | 21d | 1 | 0.89mi |
| 7339 Krueger Rd Houston, TX | 3.0 | 2.0 | 2440 | $1,900 | $0.78 | 44d | 1 | 0.90mi |
| 8328 Corinth St Unit B Houston, TX | 3.0 | 2.5 | 1500 | $2,800 | $1.87 | 21d | 1 | 0.92mi |
| 5036 Mallow St Houston, TX | 3.0 | 3.0 | 1472 | $2,050 | $1.39 | 44d | 1 | 0.94mi |
| 4942 Bataan Rd Unit 77033 Houston, TX | 4.0 | 2.0 | 1350 | $1,800 | $1.33 | 44d | 1 | 0.99mi |
| 7806 Comal St Unit B Houston, TX | 3.0 | 2.5 | 1800 | $2,200 | $1.22 | 44d | 1 | 1.00mi |
| 8010 Livingston St Houston, TX | 3.0 | 2.0 | 1400 | $1,800 | $1.29 | 44d | 1 | 1.02mi |
| 5623 Bellfort St Houston, TX | 4.0 | 1.0 | 1320 | $1,700 | $1.29 | 16d | 1 | 1.05mi |
| 5407 Thrush Dr Houston, TX | 4.0 | 1.0 | 1407 | $1,495 | $1.06 | 15d | 1 | 1.10mi |
| 6928 Paris St Houston, TX | 3.0 | 2.0 | 1276 | $1,900 | $1.49 | 0d | 1 | 1.10mi |
| 3846 Seabrook St Houston, TX | 3.0 | 3.5 | 1833 | $2,300 | $1.25 | 44d | 1 | 1.11mi |
| 6926 Paris St Houston, TX | 3.0 | 2.0 | 1276 | $1,900 | $1.49 | 0d | 1 | 1.11mi |
| 4918 Wilmington St Unit A Houston, TX | 3.0 | 3.0 | 1300 | $2,100 | $1.62 | 44d | 1 | 1.12mi |
| 4705 Idaho St Houston, TX | 3.0 | 2.5 | 1664 | $2,500 | $1.50 | 18d | 1 | 1.16mi |
| 3732 Seabrook St Houston, TX | 3.0 | 2.5 | 1727 | $2,350 | $1.36 | 25d | 1 | 1.22mi |
| 4921a Pederson St Unit A Houston, TX | 3.0 | 2.0 | 1765 | $2,150 | $1.22 | 13d | 1 | 1.26mi |
| 5012 Higgins St Unit B Houston, TX | 3.0 | 2.5 | 1611 | $1,650 | $1.02 | 25d | 1 | 1.26mi |
| 3655 Seabrook St Unit 6 Houston, TX | 2.0 | 1.0 | 1600 | $1,000 | $0.62 | 44d | 1 | 1.28mi |
| 6731 New York St Houston, TX | 3.0 | 3.0 | 2211 | $2,100 | $0.95 | 44d | 1 | 1.30mi |
Listing history 49 events
-
2026-06-21days on market $320,000 Active 104 DOM
-
2026-06-18days on market $320,000 Active 101 DOM
-
2026-06-17days on market $320,000 Active 100 DOM
-
2026-06-16days on market $320,000 Active 99 DOM
-
2026-06-15days on market $320,000 Active 98 DOM
-
2026-06-13days on market $320,000 Active 96 DOM
-
2026-06-10days on market $320,000 Active 92 DOM
-
2026-06-08days on market $320,000 Active 91 DOM
-
2026-06-07days on market $320,000 Active 90 DOM
-
2026-06-04days on market $320,000 Active 87 DOM
-
2026-06-01days on market $320,000 Active 84 DOM
-
2026-05-31days on market $320,000 Active 83 DOM
-
2026-05-11historical $2,150
-
2026-03-11$2,150
-
2026-03-09$320,000 Active 606-char remark
Show marketing remark (606 chars)
Don't miss out on this stunning 4 bed, 2.5 bath home with a spacious yard! Enjoy the open concept layout, abundant natural light, and modern finishes throughout. The first-floor primary suite features a luxurious bath with double sinks, separate shower, and tub. Upstairs, you'll find three large bedrooms . The backyard is perfect for entertaining with no back neighbors. Conveniently located near Med ctr, downtown Houston, NRG stadium, shopping, dining, and entertainment, with easy access to major highways. NO HOA! Schedule your showing today before it's gone! *pics prior to current tenant moving in*
-
2024-11-24historical
-
2024-10-16historical $2,400
-
2024-07-31$2,400
-
2024-06-30$359,999 Active
-
2018-05-22status Pending
-
2018-05-22historical
-
2018-05-16status Active
-
2018-05-14$212,495 Active
-
2018-05-14historical
-
2018-03-27status Pending
-
2018-03-20price $201,995
-
2018-03-17$204,995 Active
-
2018-03-17historical
-
2018-03-15price $203,995
-
2018-03-08price $205,995
-
2018-03-06price $206,995
-
2018-02-28price $209,995
-
2018-01-30$212,499 Active
-
2018-01-30historical
-
2018-01-21status Active
-
2018-01-20historical
-
2018-01-07$209,995 Active
-
2018-01-07historical
-
2018-01-01$204,995 Active
-
2017-12-31historical
-
2017-12-13$206,995 Active
-
2017-12-12historical
-
2017-12-08$192,995 Active
-
2017-12-07historical
-
2017-12-02status Active
-
2017-11-30historical
-
2017-11-20price $204,995
-
2017-10-25$198,995 Active
-
1988-01-02soldstatus
ⓘ Source: listings_history table (triggers on properties + properties_extension) + one-shot
backfill from property_details.listing_events for pre-trigger history.
Tax reassessment forecast TX · Resets to sale price
- Current annual tax
- $6,304 · $525/mo
- Projected year-2 tax
- $6,304 · $525/mo
- Expected delta
- $0/yr ($0/mo · 0.0%)
ⓘ Screening estimate from a state-policy table — verify with the county assessor before closing.
Climate risk First Street
- Flood 6/10 Major FEMA zone X (unshaded) · 71% chance over 30 yrs
- Wildfire 1/10 Low
- Heat 9/10 Extreme 7 d/yr ≥109°F today · 22 d/yr by 30 yrs out
- Wind 9/10 Extreme 99% chance of damaging wind over 30 yrs
- Air quality 2/10 Low 2 unhealthy d/yr today · 2 by 30 yrs out
Nearby sold comps map
Loading sold comps map…
Walkable amenities ~0.75 mi
Loading nearby amenities…
Taxation est. · year 1
- Rental income
- $29,774
- − Mortgage interest
- −$17,925
- − Property taxes
- −$6,304
- − Insurance
- −$1,600
- − Repairs & maintenance
- −$2,382
- − Management
- −$2,382
- − Depreciation
- −$9,309
- Taxable loss
- −$10,129
- Est. tax savings @ 24.0%
- +$2,431
- After-tax cash flow
- $-2,090/yr
For passive investors: Depreciation is non-cash, so a rental often shows a tax loss while cash-flowing — sheltering income. Rental losses are passive: they offset passive income freely, and up to $25,000/yr can offset ordinary (W-2) income if you actively participate and your MAGI is under $100k (phasing out to $0 by $150k); unused losses carry forward. On sale, claimed depreciation is recaptured at up to 25%, and gains may owe capital-gains tax (a 1031 exchange can defer both). Figures are a year-1 estimate at your 24.0% rate — not tax advice; consult a CPA.
Schools (NCES district)
- District
- Houston ISD
- NCES district ID
- 4823640
- Math proficiency
- 27% ▼ -18.00%
- Reading proficiency
- 35% ▼ -6.00%
- Median HH income
- $46,054
- Composite
- 26.63/100
- National rank
- #7173
- State rank
- #593 of 826 in TX
Livability — Houston
- Score
- 74/100
- State rank
- #184
- US rank
- #4771
Category grades
Schools grade is shown separately in the Schools card above.
Census & demographics
- Census place
- Houston, TX
- County
- Harris County · 4,702,590 people
- City population
- 3,226,434
- Metro
- Houston-The Woodlands-Sugar Land, TX
- Population (ZIP)
- 19,795
- Household income
- $37,415
- Rent vs Own
- Severe rent burden
- 1446.0
Population outlook (Harris County) Hauer SSP2
- Today (2025)
- 5,571,493 people
- By 2030
- 6,089,821 · +9.3%
- By 2040
- 7,142,806 · +28.2%
- By 2050
- 8,185,864 · +46.9%
- By 2075
- 10,574,329 · +89.8%
- By 2100
- 12,109,958 · +117.4%
Race, ethnicity, and origin ACS 2023
- Neighborhood character
- Predominantly Black (77%)
- Race & ethnicity
- Black 77% Hispanic / Latino 16% Two or more races 11% White 3%
- Hispanic origin (detail)
- Mexican 6% Puerto Rican 1%
- Foreign-born
- 8% · Canada, China
- Languages at home
- 88% English-only · Spanish 10%
Political lean MEDSL · Harris
- 2024 margin
- Lean D (+5.5) · D 52.0% · R 46.4% · Other 1.6%
- 2008→2024 swing
- +3.9pp toward D · 2008: 1.6pp · 2024: 5.5pp
- All cycles
- 2024: D+5.5 2020: D+13.3 2016: D+12.4 2012: D+0.1 2008: D+1.6
Not yet ingested
- Civics
- —
Market trends
- HPI YoY
- ▲ 16.02%
- Current HPI
- 180.4283
- Rent YoY
- ▲ 4.77%
- Metro
- Houston-The Woodlands-Sugar Land, TX
- State GDP YoY
- ▲ 3.95%
- F500 in state
- 110
Industry mix (Fortune 500 HQ in TX)
| Industry | F500 HQs | Revenue |
|---|---|---|
| Energy | 16 | $1,198B |
|
||
| Technology | 5 | $198B |
|
||
| Engineering / Construction | 4 | $72B |
|
||
| Energy Services | 3 | $60B |
|
||
| Utilities | 3 | $41B |
|
||
| Healthcare | 2 | $330B |
|
||
Price history
-98.9% since first listed37 events — show timeline
- 2026-05-11 Rental Removed $2,150 HARMLS
- 2026-03-11 Listed for Rent $2,150 HARMLS
- 2026-03-09 Listed $320,000 HARMLS
- 2024-11-24 Listing Removed — HARMLS
- 2024-10-16 Rental Removed $2,400 HARMLS
- 2024-07-31 Listed for Rent $2,400 HARMLS
- 2024-06-30 Listed $359,999 HARMLS
- 2018-05-22 Pending — HARMLS
- 2018-05-22 Listing Removed — HARMLS
- 2018-05-16 Relisted — HARMLS
- 2018-05-14 Listing Removed — HARMLS
- 2018-05-14 Listed $212,495 HARMLS
- 2018-03-27 Pending — HARMLS
- 2018-03-20 Price Changed $201,995 HARMLS
- 2018-03-17 Listing Removed — HARMLS
- 2018-03-17 Listed $204,995 HARMLS
- 2018-03-15 Price Changed $203,995 HARMLS
- 2018-03-08 Price Changed $205,995 HARMLS
- 2018-03-06 Price Changed $206,995 HARMLS
- 2018-02-28 Price Changed $209,995 HARMLS
- 2018-01-30 Listing Removed — HARMLS
- 2018-01-30 Listed $212,499 HARMLS
- 2018-01-21 Relisted — HARMLS
- 2018-01-20 Listing Removed — HARMLS
- 2018-01-07 Listing Removed — HARMLS
- 2018-01-07 Listed $209,995 HARMLS
- 2018-01-01 Listed $204,995 HARMLS
- 2017-12-31 Listing Removed — HARMLS
- 2017-12-13 Listed $206,995 HARMLS
- 2017-12-12 Listing Removed — HARMLS
- 2017-12-08 Listed $192,995 HARMLS
- 2017-12-07 Listing Removed — HARMLS
- 2017-12-02 Relisted — HARMLS
- 2017-11-30 Listing Removed — HARMLS
- 2017-11-20 Price Changed $204,995 HARMLS
- 2017-10-25 Listed $198,995 HARMLS
- 1988-01-02 Sold (Public Records) — Public Records
Property tax history
+19.8%/yrLatest (2025): $6,304 · +7.3% YoY. Source: county tax records.
Cash-flow waterfall
monthlySold comps — $/sqft
last 12 mo · ≤1 miLoading sold comps…