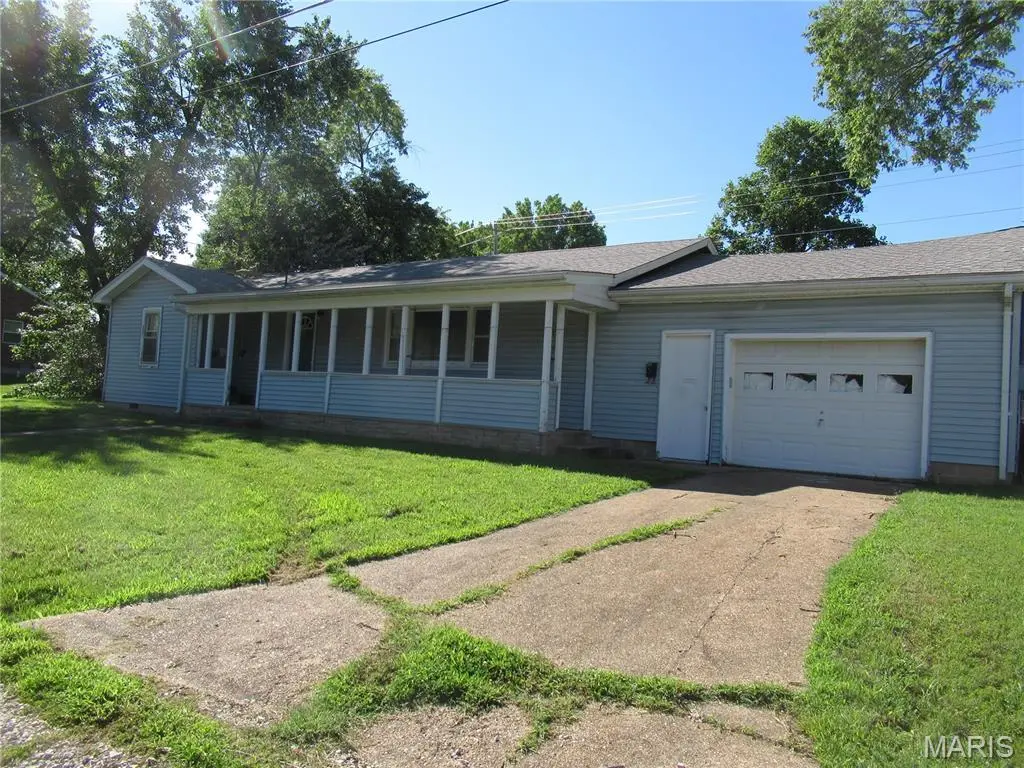
403 Marvin St · Cuba, MO
Flood risk 1/10 · Minimal
- FEMA flood zone
- X (unshaded)
- Chance of flooding over 30 yrs
- 0.0%
- Est. flood insurance / yr
- $507 – $1,088
Fire risk 3/10 · Minor
- Est. fire insurance / yr
- $1,054 – $1,958
Heat risk 5/10 · Moderate
- Hot days now (above 106°F)
- 7 days/yr
- Hot days in 30 yrs
- 19 days/yr
Wind risk 2/10 · Minimal
- Chance of severe wind over 30 yrs
- 1.0%
Air-quality risk 2/10 · Minimal
- Unhealthy air days now
- 0 days/yr
- Unhealthy air days in 30 yrs
- 1 days/yr
Risk factors via First Street. Map © Google.
Why this score? — see what drove the B- grade
The composite is a weighted blend of 9 inputs, each scored 0–100. Each bar is that input's sub-score; the figure is the points it added to the 100-point composite (weight × sub-score).
- Cash flow +30.0/30.0
- DSCR +10.0/10.0
- 1% rule +8.5/10.0
- ARV discount +7.5/15.0
- Schools +4.0/10.0
- Livability +3.2/5.0
- Rent growth +2.5/5.0
- Condition / age +2.5/5.0
- Appreciation +0.0/10.0
$92,500
🖨 Deal sheet 📄 Offer letter ✓ Due diligence
Listing remarks
H2256 GREAT SOLID HOME WITH LARGE TREE-SHADED LOT! Come remodel it and give it your personal touches. Sellers are selling "As Is". Three bedrooms, large living room and eat-in kitchen. Kitchen has an electric range with vent hood, refrigerator, 2 lazy susan cabinets and an eating bar. There is room for a large kitchen table. Hardwood floors in bedrooms and living room. Gas water heater and gas furnace. Oversized single car garage with washer/dryer that stays. Furniture in home will stay. Storage shed behind home for your yard storage items. 5x30 Covered front porch. This is priced right so you can make the necessary updates and repairs.
Key facts
- Vent hood
- Electric range
- Lazy susan cabinets
Tags
Property features AI
Finance
- Other: Ownership: private
- Financial info: Lease not considered
Exterior
- Parking: Attached garage with garage door opener; Driveway parking; Garage workshop area; Total parking for 1 vehicle
- Utilities: Public water; Public sewer; Single-phase electric; Cable available; Electricity connected; Natural gas available; Phone available
- Home design: Single-family residence; One story; Attached property; Property listed as fixer
- Construction: Vinyl siding; Shingle roof; Concrete perimeter foundation; Basement: concrete and crawl space; Built information from assessor
- Exterior features: Covered front porch; Rain gutters; Exterior storage; Shed(s); City lot, cleared and level; Corner lot with some trees; City street frontage
Interior
- Kitchen: Electric range; Range hood; Refrigerator; Eat-in kitchen with breakfast bar
- Bedrooms: 3 bedrooms, all on the main level
- Flooring: Hardwood; Vinyl
- Bathrooms: 1 full bathroom on the main level
- Heating & cooling: Forced air heating (natural gas); Central air conditioning
- Interior features: Breakfast bar; Ceiling fan(s); Eat-in kitchen; Display window(s); Blinds; Double pane and insulated windows; Screens; Storm windows; Tilt-in windows; Wood window frames
- Laundry & utility: Washer and dryer; Laundry located in the garage; Gas water heater
Neighborhood map
What this means for you Summary
Snapshot
- This is a 3-bed/1.0-bath other listed at $92k.
Deal economics
- At list price, monthly cash flow is $413 ($5k/yr) — positive.
- The deal already cash-flows at list — no discount required.
- Meets the 1% rule at list price ($1k rent vs $92k).
- Cap rate 11.7% vs local median 3.8% in Cuba — top-decile yield for the area; either an underpriced asset or a hidden risk that comps aren't pricing in. Stress-test before assuming the spread holds.
Location & tenants
- Location reads 64/100 on livability (#312 in MO) — a middle-class / working-renter tenant base. Strengths: cost of living A+; Watch: amenities F, commute F, employment F.
- Crawford County R-II (town): math 44% / reading 52% proficiency, ranked #69 of 324 in MO (top 21%) — families likely to look elsewhere, expect single-tenant / working-renter base with shorter leases.
- Zoned schools: Cuba Elem. (math 57% / reading 62%, grade B-, #124 of 1,115 statewide, top 13%, 451 students, 53% FRL); Cuba High (math 37% / reading 47%, grade F, #218 of 521 statewide, top 45%, 452 students, 41% FRL) — zoned schools at 47% FRL track the district average.
- Market conditions: 84 active listings in the ZIP; 23 units permitted in Crawford County in 2024 (0 in 5+ unit buildings).
Forward outlook
- Local home prices are declining (-3.0%/yr); year-one equity from $640 of loan paydown is wiped out by about $3k of value loss. Plan a longer hold.
- Crawford County population projected at -13% by 2050 — secular population decline; favor cash flow + early exit over multi-decade hold.
- At projected returns (-3.0% appreciation + 3.0% rent growth), your $26k cash investment doubles in ~7 years — after that, you're playing with house money.
Negotiation context
- Only 1 days on market — expect competitive offers; lowballing is unlikely to land.
Risks & watch-outs
- Watch-outs: built in 1957 — expect roof / HVAC / electrical / plumbing capex.
- Climate carrying-cost: extreme-heat days projected 7→19/yr by 2055 (HVAC capex compounding) — expect insurance premiums to compound above CPI over the hold.
Questions for the listing agent
- Built in 1957 — when were the roof, HVAC, electrical panel, plumbing, and water heater last replaced?
- Is there a deadline driving the sale (1031 exchange, divorce, estate, relocation)? That informs how much negotiation room exists.
- Schools are F-rated, which usually means shorter tenancies and higher turnover. Who's the typical renter profile here, and what's been the actual vacancy rate?
- What's the average days-on-market for RENTAL listings here right now (not sales)? A rising rental-DOM trend means longer vacancies and softer asking-rent achievability than the comps imply.
- What's the recent tenant-quality profile in this submarket — average credit score on applications, eviction rate, late-payment / NSF rate, and stable-employment percentage? A property-management company in the area should have these aggregated.
- How much new for-sale + rental construction is in the pipeline within 1–3 miles? Heavy new supply typically softens prices + rents 12–24 months out; constrained supply supports both.
Investment metrics
- 1% rule
- 1.35% ✓
- Cap rate
- 11.66%
- Cash-on-cash
- 19.16%
- DSCR
- 1.85
- GRM
- 6.2
CMA / ARV
No comps found within radius.
Projected returns pro-forma
-3.0% appreciation · 3.0% rent growth · sell at horizon
- IRR
- 11.0%
- Equity multiple
- 1.44×
- Total profit
- $11,321
- Equity at exit
- $13,792
- IRR
- 20.1%
- Equity multiple
- 2.69×
- Total profit
- $43,671
- Equity at exit
- $7,998
Cash invested: $25,900 (down + closing). Projections, not guarantees.
Landlord ↔ Tenant lean methodology
- Overall (STATE)
- 81 Strongly Landlord-Friendly
- State Missouri
- 81 Strongly Landlord-Friendly · R+10
- County
- — inherits STATE
- City
- — inherits STATE
ZIP-level market 65453
- Home prices YoY
- -21.3%
- Active inventory
- 84
- Price-to-rent
- 6.2×
Monthly cashflow live
- Estimated rent
- $1,245 medium interval (Pro) →
- Mortgage (P&I)
- −$485
- Tax from tax record
- −$46 /mo · $558/yr
- Insurance
- −$39
- HOA
- −$0
- Vacancy / Maint / Mgmt
- −$261
- Net cashflow
- $413
Break-even live
UW: 25.0% down · 7.5% · 30yr · 1.5% tax · 5.0% vac · 8.0% maint · 8.0% mgmt
Financing live
Cash to close
- Down payment
- $23,125
- Closing costs
- $2,775
- Reserves months
- —
- Total cash needed
- —
Loan-product check · same deal, 3 products live
Conventional
25% down · 7.5% · 30yr
- Down + closing
- —
- Monthly P&I
- —
- Monthly cashflow
- —
- DSCR
- —
- Eligible?
- —
Personal DTI + credit; lowest rate.
DSCR
20% down · 8.5% · 30yr
- Down + closing
- —
- Monthly P&I
- —
- Monthly cashflow
- —
- DSCR
- —
- Eligible?
- —
No personal income docs; deal must DSCR.
Hard money
10% down · 12.0% · 12mo
- Down + closing
- —
- Monthly P&I
- —
- Monthly cashflow
- —
- DSCR
- —
- Eligible?
- —
Short-term bridge; refi at stabilization.
Listing history 4 events
-
2026-06-14remarks 646-char remark
-
2026-06-14status $92,500 Pending 1 DOM
-
2026-06-13remarks 639-char remark
-
2026-06-13$92,500 Active 1 DOM
ⓘ Source: listings_history table (triggers on properties + properties_extension) + one-shot
backfill from property_details.listing_events for pre-trigger history.
Tax reassessment forecast MO · Resets to sale price
- Current annual tax
- $558 · $46/mo
- Projected year-2 tax
- $897 · $75/mo
- Expected delta
- +$340/yr (+$28/mo · 60.9%)
ⓘ Screening estimate from a state-policy table — verify with the county assessor before closing.
Climate risk First Street
- Flood 1/10 Low FEMA zone X (unshaded) · 0% chance over 30 yrs
- Wildfire 3/10 Moderate
- Heat 5/10 Major 7 d/yr ≥106°F today · 19 d/yr by 30 yrs out
- Wind 2/10 Low 100% chance of damaging wind over 30 yrs
- Air quality 2/10 Low 0 unhealthy d/yr today · 1 by 30 yrs out
Nearby sold comps map
Loading sold comps map…
Walkable amenities ~0.75 mi
Loading nearby amenities…
Taxation est. · year 1
- Rental income
- $14,940
- − Mortgage interest
- −$5,181
- − Property taxes
- −$558
- − Insurance
- −$462
- − Repairs & maintenance
- −$1,195
- − Management
- −$1,195
- − Depreciation
- −$2,691
- Taxable income
- $3,657
- Est. tax owed @ 24.0%
- −$878
- After-tax cash flow
- $4,084/yr
For passive investors: Depreciation is non-cash, so a rental often shows a tax loss while cash-flowing — sheltering income. Rental losses are passive: they offset passive income freely, and up to $25,000/yr can offset ordinary (W-2) income if you actively participate and your MAGI is under $100k (phasing out to $0 by $150k); unused losses carry forward. On sale, claimed depreciation is recaptured at up to 25%, and gains may owe capital-gains tax (a 1031 exchange can defer both). Figures are a year-1 estimate at your 24.0% rate — not tax advice; consult a CPA.
Schools (NCES district)
- District
- Crawford County R-II
- NCES district ID
- 2910410
- Math proficiency
- 44% ▲ 3.00%
- Reading proficiency
- 52% ▬ 0.00%
- Median HH income
- $37,098
- Composite
- 39.87/100
- National rank
- #3861
- State rank
- #69 of 324 in MO
Livability — Cuba
- Score
- 64/100
- State rank
- #312
- US rank
- #14362
Category grades
Schools grade is shown separately in the Schools card above.
Census & demographics
- Census place
- Cuba, MO
- Population (ZIP)
- 8,600
Population outlook (Crawford County) Hauer SSP2
- Today (2025)
- 24,107 people
- By 2030
- 23,619 · -2.0%
- By 2040
- 22,404 · -7.1%
- By 2050
- 21,042 · -12.7%
- By 2075
- 18,239 · -24.3%
- By 2100
- 15,147 · -37.2%
Race, ethnicity, and origin ACS 2023
- Neighborhood character
- Predominantly White (93%)
- Race & ethnicity
- White 93% Two or more races 4% Hispanic / Latino 2%
- Common ancestry
- Italian 3% Romanian 2% Slovak 1%
- Foreign-born
- 1% · Canada
- Languages at home
- 98% English-only · Spanish 2% German/W. Germanic 0%
Political lean MEDSL · Crawford
- 2024 margin
- Solid R (+62.2) · D 18.5% · R 80.7%
- 2008→2024 swing
- -41.4pp toward R · 2008: -20.8pp · 2024: -62.2pp
- All cycles
- 2024: R+62.2 2020: R+60.2 2016: R+59.5 2012: R+36.4 2008: R+20.8
Not yet ingested
- Civics
- —
Market trends
- HPI YoY
- ▼ -57.75%
- Current HPI
- 213.1945
- Rent YoY
- —
- Metro
- —
- State GDP YoY
- ▲ 1.84%
- F500 in state
- 20
Industry mix (Fortune 500 HQ in MO)
| Industry | F500 HQs | Revenue |
|---|---|---|
| Healthcare | 1 | $163B |
|
||
| Insurance | 1 | $21B |
|
||
| Industrial Technology | 1 | $17B |
|
||
| Retail | 1 | $16B |
|
||
| Industrial Distribution | 1 | $10B |
|
||
| Utilities | 1 | $9B |
|
||
Price history
1 event — show timeline
- 2026-06-12 Listed $92,500 MARIS as Distributed by MLS Grid
Property tax history
+1.4%/yrLatest (2025): $558 · +3.3% YoY. Source: county tax records.
Cash-flow waterfall
monthlySold comps — $/sqft
last 12 mo · ≤1 miLoading sold comps…