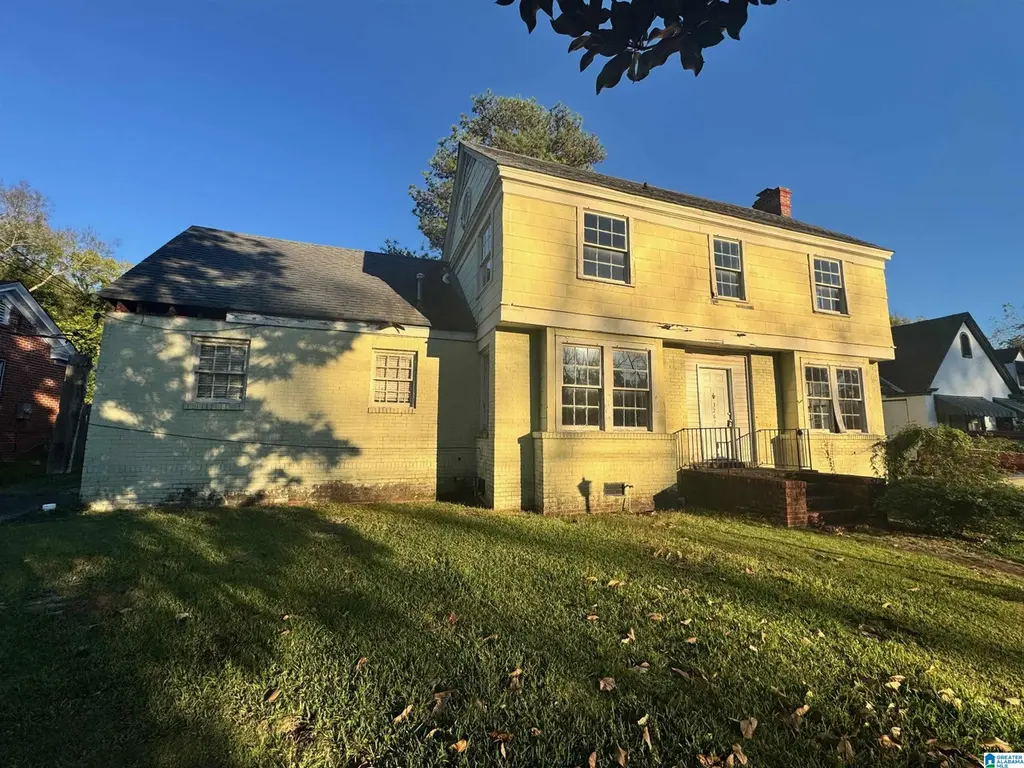
3269 S Perry St · Montgomery, AL
Flood risk 1/10 · Minimal
- FEMA flood zone
- X (unshaded)
- Chance of flooding over 30 yrs
- 0.0%
- Est. flood insurance / yr
- $507 – $1,088
Fire risk 1/10 · Minimal
- Est. fire insurance / yr
- $916 – $1,700
Heat risk 7/10 · Major
- Hot days now (above 108°F)
- 7 days/yr
- Hot days in 30 yrs
- 20 days/yr
Wind risk 8/10 · Major
- Chance of severe wind over 30 yrs
- 80.0%
Air-quality risk 2/10 · Minimal
- Unhealthy air days now
- 1 days/yr
- Unhealthy air days in 30 yrs
- 1 days/yr
Risk factors via First Street. Map © Google.
Why this score? — see what drove the B- grade
The composite is a weighted blend of 9 inputs, each scored 0–100. Each bar is that input's sub-score; the figure is the points it added to the 100-point composite (weight × sub-score).
- Cash flow +30.0/30.0
- 1% rule +10.0/10.0
- DSCR +10.0/10.0
- ARV discount +7.5/15.0
- Livability +3.2/5.0
- Rent growth +2.5/5.0
- Condition / age +2.5/5.0
- Schools +1.7/10.0
- Appreciation +0.0/10.0
$60,000
🖨 Deal sheet 📄 Offer letter ✓ Due diligence
Listing remarks MLS
Wow, what an opportunity to renovate this fabulous home. Major Fixer home located on the edges of Edgemont neighborhood, with enough space to share with loved ones. Garage, shop, with charm intact, nestled on a large treed lot. The opportunities abound with the right vision. Location offers quick access to all amenities and recreational living. Build out your own home the way you want to in the heart of Montgomery. Don't miss this, call today!
Key facts
- Large treed lot
- 0.33 acre lot
- 2 garage spots
Tags
Neighborhood map
What this means for you Summary
Snapshot
- This is a 4-bed/3.0-bath single-family listed at $60k.
Deal economics
- At list price, monthly cash flow is $772 ($9k/yr) — positive.
- The deal already cash-flows at list — no discount required.
- Meets the 1% rule at list price ($1k rent vs $60k).
- Recommended offer: $53k (12.0% below list) — sets the bar for market timing.
- Cap rate 21.7% vs local median 6.0% in Montgomery — top-decile yield for the area; either an underpriced asset or a hidden risk that comps aren't pricing in. Stress-test before assuming the spread holds.
Location & tenants
- Location reads 65/100 on livability (#138 in AL) — a middle-class / working-renter tenant base. Strengths: cost of living A+, housing A+; Watch: schools C-, employment D, crime F.
- Montgomery County (urban): math 9% / reading 31% proficiency, ranked #106 of 129 in AL (top 82%) — low school quality limits family demand, transient renter base, plan for 1-2y turnover; 70% free/reduced lunch — lower-income household profile, screen leases tightly.
- Market conditions: 79 active listings in the ZIP; 23 comparable units currently listed for rent nearby; rentals at typical pace (median 21d on market — plan ~3-4 weeks tenant-placement turnaround); 43% of comp listings sitting > 30 days — soft ceiling on asking rent; lower-income renter base — watch delinquency; 460 units permitted in Montgomery County in 2024 (37 in 5+ unit buildings).
- This rent runs 43% of the median local income ($41k/yr) — at the standard rent-burdened threshold; future hikes will face affordability resistance.
Forward outlook
- Local home prices are declining (-3.0%/yr); year-one equity from $415 of loan paydown is wiped out by about $2k of value loss. Plan a longer hold.
- Montgomery County population projected to shrink 8% by 2050 — rents likely to lag national; underwrite the cash flow, not the appreciation.
- At projected returns (-3.0% appreciation + 3.0% rent growth), your $17k cash investment doubles in ~3 years — after that, you're playing with house money.
Negotiation context
- It's been on market 224 days — a 12% lower offer ($53k) is reasonable based on typical stale-listing flexibility.
- 10 sale attempts since 21y ago; this cycle's ask has dropped $5k (8%) from the opening price — seller is motivated, your offer sets the floor, not the list.
- Current owner paid $25k; list at $60k implies a 140% gain — meaningful room to come down on a strong offer.
Risks & watch-outs
- Watch-outs: built in 1942 — expect roof / HVAC / electrical / plumbing capex.
- Climate carrying-cost: severe wind risk, 80% chance of damaging wind over 30y; extreme-heat days projected 7→20/yr by 2055 (HVAC capex compounding) — expect insurance premiums to compound above CPI over the hold.
Questions for the listing agent
- It's been on market 224 days. Have you received any prior offers? Is the seller open to a 12% concession, seller financing, or rate buy-down credit?
- Built in 1942 — when were the roof, HVAC, electrical panel, plumbing, and water heater last replaced?
- Why hasn't it sold? Are there any deal-killer items the seller is aware of (foundation, flood, title, zoning, code violations)?
- Is there a deadline driving the sale (1031 exchange, divorce, estate, relocation)? That informs how much negotiation room exists.
- Crime grade is F in this area — have there been break-ins, vandalism, or insurance claims at this property in the last 3 years? What carrier currently insures it and at what premium?
- What's the average days-on-market for RENTAL listings here right now (not sales)? A rising rental-DOM trend means longer vacancies and softer asking-rent achievability than the comps imply.
- What's the recent tenant-quality profile in this submarket — average credit score on applications, eviction rate, late-payment / NSF rate, and stable-employment percentage? A property-management company in the area should have these aggregated.
- How much new for-sale + rental construction is in the pipeline within 1–3 miles? Heavy new supply typically softens prices + rents 12–24 months out; constrained supply supports both.
Investment metrics
- 1% rule
- 2.47% ✓
- Cap rate
- 21.73%
- Cash-on-cash
- 55.14%
- DSCR
- 3.45
- GRM
- 3.4
CMA / ARV
- ARV (median comp)
- $165,736
- List price
- $60,000
- Delta
- -63.80%
- Verdict
- UNDERPRICED
- Comps
- 20 within 1.0 mi
Show comp detail 12 sales within ~0.75 mi
| Address | Dist | Beds/Ba | Sqft | Sold | Price | $/sf | Match |
|---|---|---|---|---|---|---|---|
| 3357 Wilmington Rd | 0.36mi | 3/2.0 (-1) | 2,064 (+2%) | 2mo | $165,000 | $80 | 69 |
| 3126 Gilmer Ave | 0.17mi | 3/2.0 (-1) | 2,130 (+6%) | 7mo | $39,900 | $19 | 68 |
| 3155 Wilmington Rd | 0.34mi | 3/2.0 (-1) | 1,937 (-4%) | 6mo | $148,000 | $76 | 64 |
| 3455 Wellington Rd | 0.61mi | 4/2.0 | 2,038 (+1%) | 3mo | $100,000 | $49 | 63 |
| 25 Arlington Rd | 0.22mi | 3/2.0 (-1) | 2,231 (+11%) | 0mo | $57,500 | $26 | 63 |
| 3134 S Hull St | 0.24mi | 3/2.0 (-1) | 1,830 (-9%) | 2mo | $115,000 | $63 | 62 |
| 114 Stuart St | 0.50mi | 4/2.0 | 1,726 (-14%) | 5mo | $115,000 | $67 | 44 |
| 3370 Lexington Rd | 0.47mi | 3/2.0 (-1) | 2,265 (+12%) | 6mo | $238,900 | $105 | 44 |
| 1908 Norman Bridge Ct | 0.53mi | 3/2.0 (-1) | 1,762 (-13%) | 2mo | $129,000 | $73 | 43 |
| 3469 Wellington Rd | 0.61mi | 3/2.0 (-1) | 1,782 (-12%) | 3mo | $49,900 | $28 | 41 |
| 3417 Wellington Rd | 0.59mi | 3/2.0 (-1) | 1,722 (-15%) | 1mo | $100,000 | $58 | 38 |
| 3524 S Perry St | 0.55mi | 3/2.0 (-1) | 2,314 (+15%) | 7mo | $79,900 | $35 | 36 |
Match score weights: distance 35% · size 25% · config 20% · recency 20%. Top-matched comps best support the ARV.
Projected returns pro-forma
-3.0% appreciation · 3.0% rent growth · sell at horizon
- IRR
- 53.4%
- Equity multiple
- 3.35×
- Total profit
- $39,458
- Equity at exit
- $8,946
- IRR
- 58.6%
- Equity multiple
- 6.82×
- Total profit
- $97,724
- Equity at exit
- $5,188
Cash invested: $16,800 (down + closing). Projections, not guarantees.
Landlord ↔ Tenant lean methodology
- Overall (STATE)
- 90 Strongly Landlord-Friendly
- State Alabama
- 90 Strongly Landlord-Friendly · R+15
- County
- — inherits STATE
- City
- — inherits STATE
ZIP-level market 36105
- Home prices YoY
- -32.6%
- Active inventory
- 79
- Price-to-rent
- 3.4×
Monthly cashflow live
- Estimated rent
- $1,484 high interval (Pro) →
- Mortgage (P&I)
- −$315
- Tax from tax record
- −$61 /mo · $728/yr
- Insurance
- −$25
- HOA
- −$0
- Vacancy / Maint / Mgmt
- −$312
- Net cashflow
- $772
Break-even live
UW: 25.0% down · 7.5% · 30yr · 1.5% tax · 5.0% vac · 8.0% maint · 8.0% mgmt
Financing live
Cash to close
- Down payment
- $15,000
- Closing costs
- $1,800
- Reserves months
- —
- Total cash needed
- —
Loan-product check · same deal, 3 products live
Conventional
25% down · 7.5% · 30yr
- Down + closing
- —
- Monthly P&I
- —
- Monthly cashflow
- —
- DSCR
- —
- Eligible?
- —
Personal DTI + credit; lowest rate.
DSCR
20% down · 8.5% · 30yr
- Down + closing
- —
- Monthly P&I
- —
- Monthly cashflow
- —
- DSCR
- —
- Eligible?
- —
No personal income docs; deal must DSCR.
Hard money
10% down · 12.0% · 12mo
- Down + closing
- —
- Monthly P&I
- —
- Monthly cashflow
- —
- DSCR
- —
- Eligible?
- —
Short-term bridge; refi at stabilization.
Rent comps 23 comps
| Address | Beds | Baths | Sqft | Rent | $/sqft | DOM | Units | Dist |
|---|---|---|---|---|---|---|---|---|
| 139 Mount Vernon Dr Unit A Montgomery, AL | 4.0 | 2.5 | 1700 | $1,000 | $0.59 | 43d | 1 | 0.12mi |
| 3304 Gilmer Ave Montgomery, AL | 4.0 | 2.0 | 2009 | $1,400 | $0.70 | 21d | 1 | 0.13mi |
| 3235 Norman Bridge Rd Montgomery, AL | 3.0 | 1.0 | 1873 | $900 | $0.48 | 43d | 1 | 0.39mi |
| 1919 Norman Bridge Ct Unit 1043838P Montgomery, AL | 4.0 | 3.0 | 1539 | $4,108 | $2.67 | 43d | 1 | 0.47mi |
| 3544 Southmont Dr Montgomery, AL | 4.0 | 1.5 | 1774 | $1,300 | $0.73 | 21d | 1 | 0.61mi |
| 3256 Montezuma Rd Montgomery, AL | 3.0 | 2.0 | 1515 | $1,450 | $0.96 | 43d | 1 | 0.61mi |
| 3485 Wellington Rd Montgomery, AL | 3.0 | 2.0 | 2437 | $1,395 | $0.57 | 21d | 1 | 0.62mi |
| 334 Felder Ave Montgomery, AL | 3.0 | 2.0 | 2223 | $2,395 | $1.08 | 43d | 1 | 0.65mi |
| 1259 S Lawrence St Montgomery, AL | 3.0 | 1.0 | 1728 | $1,300 | $0.75 | 43d | 1 | 0.82mi |
| 3543 Berkley Dr Montgomery, AL | 4.0 | 2.0 | 2067 | $1,575 | $0.76 | 13d | 1 | 0.90mi |
| 3616 Gaston Ave Montgomery, AL | 4.0 | 2.0 | 1629 | $1,300 | $0.80 | 43d | 1 | 0.91mi |
| 3556 Princeton Rd Montgomery, AL | 4.0 | 2.0 | 2718 | $1,200 | $0.44 | 21d | 1 | 1.04mi |
| 22 W Cromwell St Montgomery, AL | 4.0 | 2.0 | 1645 | $1,350 | $0.82 | 21d | 1 | 1.05mi |
| 3963 S Court St Montgomery, AL | 5.0 | 2.0 | 2000 | $1,840 | $0.92 | 43d | 1 | 1.06mi |
| 3510 Bankhead Ave Montgomery, AL | 3.0 | 3.0 | 2210 | $2,250 | $1.02 | 43d | 1 | 1.09mi |
| 1121 Felder Ave Unit 1043909P Montgomery, AL | 4.0 | 2.5 | 2647 | $3,152 | $1.19 | 21d | 1 | 1.19mi |
| 1355 Magnolia Curv Montgomery, AL | 3.0 | 3.0 | 2260 | $1,800 | $0.80 | 13d | 1 | 1.26mi |
| 3720 Stanley Dr Montgomery, AL | 4.0 | 2.0 | 1719 | $1,650 | $0.96 | 21d | 1 | 1.26mi |
| 3902 Wesley Dr Montgomery, AL | 5.0 | 2.0 | 1689 | $1,595 | $0.94 | 21d | 1 | 1.38mi |
| 1425 Blairwood Montgomery, AL | 3.0 | 2.0 | 1700 | $1,850 | $1.09 | 13d | 1 | 1.40mi |
| 1450 Crenshaw Pl S Montgomery, AL | 3.0 | 2.0 | 1641 | $1,775 | $1.08 | 43d | 1 | 1.40mi |
| 2043 Hazel Hedge Ln Montgomery, AL | 4.0 | 3.0 | 2001 | $1,650 | $0.82 | 13d | 1 | 1.46mi |
| 1388 Adrian Ln Montgomery, AL | 5.0 | 2.0 | 1701 | $1,600 | $0.94 | 13d | 1 | 1.50mi |
Listing history 31 events
-
2026-06-18days on market $60,000 Active 224 DOM
-
2026-06-17days on market $60,000 Active 223 DOM
-
2026-06-16days on market $60,000 Active 222 DOM
-
2026-06-15days on market $60,000 Active 221 DOM
-
2026-06-14days on market $60,000 Active 219 DOM
-
2026-06-13days on market $60,000 Active 218 DOM
-
2026-06-10days on market $60,000 Active 216 DOM
-
2026-06-09days on market $60,000 Active 215 DOM
-
2026-06-08days on market $60,000 Active 214 DOM
-
2026-06-07days on market $60,000 Active 213 DOM
-
2026-06-03days on market $60,000 Active 209 DOM
-
2026-06-02days on market $60,000 Active 208 DOM
-
2026-06-01days on market $60,000 Active 207 DOM
-
2026-05-31days on market $60,000 Active 206 DOM
-
2026-05-30days on market $60,000 Active 205 DOM
-
2026-02-13price $60,000 447-char remark
Show marketing remark (447 chars)
Wow, what an opportunity to renovate this fabulous home. Major Fixer home located on the edges of Edgemont neighborhood, with enough space to share with loved ones. Garage, shop, with charm intact, nestled on a large treed lot. The opportunities abound with the right vision. Location offers quick access to all amenities and recreational living. Build out your own home the way you want to in the heart of Montgomery. Don't miss this, call today!
-
2025-11-05$65,000 Active 447-char remark
Show marketing remark (447 chars)
Wow, what an opportunity to renovate this fabulous home. Major Fixer home located on the edges of Edgemont neighborhood, with enough space to share with loved ones. Garage, shop, with charm intact, nestled on a large treed lot. The opportunities abound with the right vision. Location offers quick access to all amenities and recreational living. Build out your own home the way you want to in the heart of Montgomery. Don't miss this, call today!
-
2025-05-01status Active
-
2025-04-02status Active
-
2025-02-23historical Contingent
-
2024-11-22$65,000 Active
-
2024-05-22status Active
-
2024-05-16historical Contingent
-
2024-05-03$73,800 Active
-
2020-11-16$59,000
-
2019-05-24soldstatus $25,000
-
2019-01-15$35,000
-
2011-01-12$83,500
-
2006-10-16soldstatus $185,250
-
2006-04-05soldstatus $54,000
-
2005-09-06$56,905
ⓘ Source: listings_history table (triggers on properties + properties_extension) + one-shot
backfill from property_details.listing_events for pre-trigger history.
Tax reassessment forecast AL · Resets to sale price
- Current annual tax
- $728 · $61/mo
- Projected year-2 tax
- $728 · $61/mo
- Expected delta
- $0/yr ($0/mo · 0.0%)
ⓘ Screening estimate from a state-policy table — verify with the county assessor before closing.
Climate risk First Street
- Flood 1/10 Low FEMA zone X (unshaded) · 0% chance over 30 yrs
- Wildfire 1/10 Low
- Heat 7/10 Severe 7 d/yr ≥108°F today · 20 d/yr by 30 yrs out
- Wind 8/10 Severe 80% chance of damaging wind over 30 yrs
- Air quality 2/10 Low 1 unhealthy d/yr today · 1 by 30 yrs out
Nearby sold comps map
Loading sold comps map…
Walkable amenities ~0.75 mi
Loading nearby amenities…
Taxation est. · year 1
- Rental income
- $17,807
- − Mortgage interest
- −$3,361
- − Property taxes
- −$728
- − Insurance
- −$300
- − Repairs & maintenance
- −$1,425
- − Management
- −$1,425
- − Depreciation
- −$1,745
- Taxable income
- $8,823
- Est. tax owed @ 24.0%
- −$2,118
- After-tax cash flow
- $7,146/yr
For passive investors: Depreciation is non-cash, so a rental often shows a tax loss while cash-flowing — sheltering income. Rental losses are passive: they offset passive income freely, and up to $25,000/yr can offset ordinary (W-2) income if you actively participate and your MAGI is under $100k (phasing out to $0 by $150k); unused losses carry forward. On sale, claimed depreciation is recaptured at up to 25%, and gains may owe capital-gains tax (a 1031 exchange can defer both). Figures are a year-1 estimate at your 24.0% rate — not tax advice; consult a CPA.
Schools (NCES district)
- District
- Montgomery County
- NCES district ID
- 0102430
- Math proficiency
- 9% ▼ -21.00%
- Reading proficiency
- 31% ▼ -1.00%
- Median HH income
- $43,902
- Composite
- 17.24/100
- National rank
- #9093
- State rank
- #106 of 129 in AL
Livability — Montgomery
- Score
- 65/100
- State rank
- #138
- US rank
- #13416
Category grades
Schools grade is shown separately in the Schools card above.
Census & demographics
- Census place
- Montgomery, AL
- County
- Montgomery County · 190,016 people
- City population
- 175,913
- Metro
- Montgomery, AL
- Population (ZIP)
- 9,207
- Household income
- $41,486
- Rent vs Own
- Severe rent burden
- 679.0
Population outlook (Montgomery County) Hauer SSP2
- Today (2025)
- 224,008 people
- By 2030
- 221,460 · -1.1%
- By 2040
- 214,179 · -4.4%
- By 2050
- 204,912 · -8.5%
- By 2075
- 177,821 · -20.6%
- By 2100
- 145,134 · -35.2%
Race, ethnicity, and origin ACS 2023
- Neighborhood character
- Predominantly Black (83%)
- Race & ethnicity
- Black 83% White 12% Hispanic / Latino 4% Two or more races 3%
- Common ancestry
- Italian 1%
- Foreign-born
- 3% · Canada, South Korea
- Languages at home
- 95% English-only · Spanish 4%
Political lean MEDSL · Montgomery
- 2024 margin
- Solid D (+30.7) · D 64.8% · R 34.1% · Other 1.1%
- 2008→2024 swing
- +11.5pp toward D · 2008: 19.2pp · 2024: 30.7pp
- All cycles
- 2024: D+30.7 2020: D+31.5 2016: D+26.2 2012: D+24.3 2008: D+19.2
Not yet ingested
- Civics
- —
Market trends
- HPI YoY
- ▼ -31.17%
- Current HPI
- 64.4673
- Rent YoY
- —
- Metro
- Montgomery, AL
- State GDP YoY
- ▲ 2.94%
- F500 in state
- 4
Industry mix (Fortune 500 HQ in AL)
| Industry | F500 HQs | Revenue |
|---|---|---|
| Financial Services | 1 | $8B |
|
||
| Healthcare | 1 | $5B |
|
||
Price history
+5.4% since first listed16 events — show timeline
- 2026-02-13 Price Changed $60,000 Greater Alabama MLS
- 2025-11-05 Listed $65,000 Greater Alabama MLS
- 2025-05-01 Relisted — MAAR
- 2025-04-02 Relisted — MAAR
- 2025-02-23 Contingent — MAAR
- 2024-11-22 Listed $65,000 MAAR
- 2024-05-22 Relisted — MAAR
- 2024-05-16 Contingent — MAAR
- 2024-05-03 Listed $73,800 MAAR
- 2020-11-16 Listed $59,000 MAAR
- 2019-05-24 Sold (MLS) $25,000 MAAR
- 2019-01-15 Listed $35,000 MAAR
- 2011-01-12 Listed $83,500 MAAR
- 2006-10-16 Sold (Public Records) $185,250 Public Records
- 2006-04-05 Sold (MLS) $54,000 MAAR
- 2005-09-06 Listed $56,905 MAAR
Property tax history
+5.2%/yrLatest (2025): $728 · -18.8% YoY. Source: county tax records.
Cash-flow waterfall
monthlySold comps — $/sqft
last 12 mo · ≤1 miLoading sold comps…