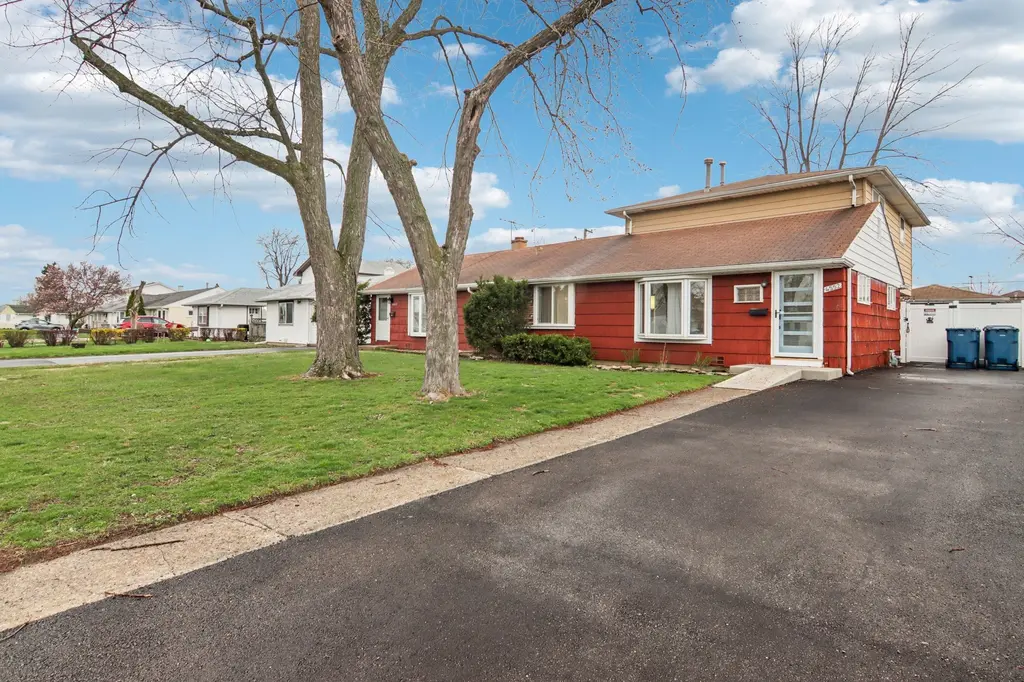
4552 W 89th St · Hometown, IL
Flood risk 1/10 · Minimal
- FEMA flood zone
- X (unshaded)
- Chance of flooding over 30 yrs
- 0.0%
- Est. flood insurance / yr
- $473 – $860
Fire risk 1/10 · Minimal
- Est. fire insurance / yr
- $804 – $1,492
Heat risk 3/10 · Minor
- Hot days now (above 101°F)
- 7 days/yr
- Hot days in 30 yrs
- 15 days/yr
Wind risk 2/10 · Minimal
- Chance of severe wind over 30 yrs
- 0.0%
Air-quality risk 4/10 · Minor
- Unhealthy air days now
- 4 days/yr
- Unhealthy air days in 30 yrs
- 6 days/yr
Risk factors via First Street. Map © Google.
Why this score? — see what drove the F grade
The composite is a weighted blend of 9 inputs, each scored 0–100. Each bar is that input's sub-score; the figure is the points it added to the 100-point composite (weight × sub-score).
- Cash flow +12.4/30.0
- Livability +4.3/5.0
- 1% rule +3.8/10.0
- DSCR +3.7/10.0
- ARV discount +2.7/15.0
- Rent growth +2.5/5.0
- Condition / age +2.5/5.0
- Schools +1.9/10.0
- Appreciation +0.0/10.0
$295,000
🖨 Deal sheet 📄 Offer letter ✓ Due diligence
Listing remarks
Spacious and versatile, this 5-bedroom, 2-bath home offers approximately 1,806 square feet of comfortable living space in a convenient Hometown location. With a flexible layout, there's plenty of room for larger households, home offices, or guest accommodations. The bright living areas provide a welcoming atmosphere, while the generously sized bedrooms offer comfort and privacy for everyone. Recent updates add value and peace of mind, including a new driveway (August), new hardwood floors, and new carpet upstairs (August). The kitchen has been refreshed with a new sink, and additional improvements include new interior and storm doors as well as a privacy fence (September), enhancing both co
Key facts
- Garage
- Built 1953
- Listed 51 days
Property features AI
Finance
- Other: Two units in building (duplex configuration indicated)
- Financial info: Homeowner tax exemption listed
- HOA & community: Monthly association fee frequency; Master association not required; Pets allowed (cats and dogs OK; large max pet weight indicated)
Exterior
- Parking: Detached garage (garage owned) providing 1 garage space and 1 total parking space
- Utilities: Public water; Public sewer; Electric with circuit breakers
- Home design: Attached single property configured as a townhouse-ranch; Single-level entry (entry level 1); Fee simple ownership; Built approximately 71–80 years ago; Property built before 1978
- Construction: Shingle siding and other construction materials
- Exterior features: 4000 (lot dimension listed)
Interior
- Kitchen: Eating area with breakfast bar and table space; Pantry closet and custom cabinetry; Lower-height (34 inch or lower) countertops; Range, oven, range hood, dishwasher, refrigerator; Stainless steel appliances
- Bedrooms: Five bedrooms (master on main); Bedroom dimensions include 12 x 10 (master), 10 x 11, 11 x 13, 10 x 18, and 15 x 10
- Flooring: Hardwood in main living areas; Parquet in family room; Carpet in several bedrooms and laundry; Other flooring in one bedroom
- Bathrooms: Two full bathrooms; Separate shower
- Heating & cooling: Natural gas forced-air heating; Central air conditioning (partial)
- Interior features: First-floor bedroom and first-floor full bath; Eight total rooms; Ceiling fan(s)
- Laundry & utility: Main-level laundry with washer hookup, gas dryer hookup, and laundry closet; Dryer included
Neighborhood map
What this means for you Summary
Snapshot
- This is a 5-bed/1.5-bath townhouse listed at $295k.
Deal economics
- At list price, monthly cash flow is $-48 ($-578/yr) — negative.
- To cash-flow at today's rent, offer at most $286k (2.9% below list).
- To meet the 1% rule (rent ≥ 1% of price), the offer needs to be $260k (11.9% below list).
- Recommended offer: $260k (11.9% below list) — sets the bar for 1% rule.
Location & tenants
- Location reads 86/100 on livability (#21 in IL, #416 nationally) — a professional / high-income tenant draw. Strengths: commute A+, cost of living A+, housing A+; Watch: amenities C-.
- Oak Lawn Chsd 229 (suburban): math 22% / reading 21% proficiency, ranked #384 of 620 in IL (top 62%) — low school quality limits family demand, transient renter base, plan for 1-2y turnover.
- Zoned schools: Oak Lawn Comm High School (math 22% / reading 21%, grade F, #345 of 693 statewide, top 50%, 1,834 students, 0% FRL).
- Market conditions: 8 active listings in the ZIP; 1 comparable units currently listed for rent nearby; 6,272 units permitted in Cook County in 2024 (4,658 in 5+ unit buildings).
Forward outlook
- Local home prices are declining (-3.0%/yr); year-one equity from $2k of loan paydown is wiped out by about $9k of value loss. Plan a longer hold.
Negotiation context
- It's been on market 52 days — a 3% lower offer ($286k) is reasonable based on typical stale-listing flexibility.
- 2 sale attempts with the ask held roughly flat each time — persistent listings suggest the price (not the market) is what's stuck; bring a comps-based counter.
Risks & watch-outs
- Watch-outs: built in 1953 — expect roof / HVAC / electrical / plumbing capex.
Questions for the listing agent
- What do current leases actually rent for vs. the listed asking? Can we see a recent rent roll and the last 12 months of T-12 income?
- It's been on market 52 days. Have you received any prior offers? Is the seller open to a 12% concession, seller financing, or rate buy-down credit?
- Built in 1953 — when were the roof, HVAC, electrical panel, plumbing, and water heater last replaced?
- Is there a deadline driving the sale (1031 exchange, divorce, estate, relocation)? That informs how much negotiation room exists.
- Schools are D-rated, which usually means shorter tenancies and higher turnover. Who's the typical renter profile here, and what's been the actual vacancy rate?
- The area grade is low — what's the realistic commute time and amenity access for the typical tenant pool here? Any planned neighborhood developments (good or bad) we should know about?
- What's the average days-on-market for RENTAL listings here right now (not sales)? A rising rental-DOM trend means longer vacancies and softer asking-rent achievability than the comps imply.
- What's the recent tenant-quality profile in this submarket — average credit score on applications, eviction rate, late-payment / NSF rate, and stable-employment percentage? A property-management company in the area should have these aggregated.
- How much new for-sale + rental construction is in the pipeline within 1–3 miles? Heavy new supply typically softens prices + rents 12–24 months out; constrained supply supports both.
Investment metrics
- 1% rule
- 0.88% ✗
- Cap rate
- 6.10%
- Cash-on-cash
- -0.70%
- DSCR
- 0.97
- GRM
- 9.5
CMA / ARV
- ARV (on-the-fly)
- $266,344
- Comps found
- 6
Show comp detail 6 sales within ~0.75 mi
| Address | Dist | Beds/Ba | Sqft | Sold | Price | $/sf | Match |
|---|---|---|---|---|---|---|---|
| 4612 W 89th Pl | 0.05mi | 4/2.0 (-1) | 1,740 (+10%) | 9mo | $222,500 | $128 | 66 |
| 9025 S Corcoran Rd | 0.26mi | 4/2.0 (-1) | 1,627 (+3%) | 12mo | $295,000 | $181 | 65 |
| 4452 W 87th Pl | 0.31mi | 4/2.0 (-1) | 1,633 (+4%) | 18mo | $212,000 | $130 | 57 |
| 8912 S Ryan Rd | 0.58mi | 4/2.0 (-1) | 1,680 (+7%) | 8mo | $299,900 | $179 | 49 |
| 4037 W 90th Pl | 0.68mi | 4/2.0 (-1) | 1,500 (-5%) | 11mo | $235,000 | $157 | 44 |
| 8828 S Beck Pl | 0.37mi | 4/2.0 (-1) | 1,806 (+15%) | 9mo | $305,900 | $169 | 44 |
Match score weights: distance 35% · size 25% · config 20% · recency 20%. Top-matched comps best support the ARV.
Projected returns pro-forma
-3.0% appreciation · 3.0% rent growth · sell at horizon
- IRR
- -17.4%
- Equity multiple
- 0.39×
- Total profit
- $-50,793
- Equity at exit
- $43,985
- IRR
- -9.4%
- Equity multiple
- 0.42×
- Total profit
- $-47,864
- Equity at exit
- $25,506
Cash invested: $82,600 (down + closing). Projections, not guarantees.
Landlord ↔ Tenant lean methodology
- Overall (STATE)
- 43 Moderately Tenant-Leaning
- State Illinois
- 43 Moderately Tenant-Leaning · D+7
- County
- — inherits STATE
- City
- — inherits STATE
ZIP-level market 60456
- Home prices YoY
- -18.3%
- Active inventory
- 8
- Price-to-rent
- 9.5×
Monthly cashflow live
- Estimated rent
- $2,600 medium interval (Pro) →
- Mortgage (P&I)
- −$1,547
- Tax from tax record
- −$432 /mo · $5,187/yr
- Insurance
- −$123
- HOA
- −$0
- Vacancy / Maint / Mgmt
- −$546
- Net cashflow
- $-48
Break-even live
UW: 25.0% down · 7.5% · 30yr · 1.5% tax · 5.0% vac · 8.0% maint · 8.0% mgmt
Financing live
Cash to close
- Down payment
- $73,750
- Closing costs
- $8,850
- Reserves months
- —
- Total cash needed
- —
Loan-product check · same deal, 3 products live
Conventional
25% down · 7.5% · 30yr
- Down + closing
- —
- Monthly P&I
- —
- Monthly cashflow
- —
- DSCR
- —
- Eligible?
- —
Personal DTI + credit; lowest rate.
DSCR
20% down · 8.5% · 30yr
- Down + closing
- —
- Monthly P&I
- —
- Monthly cashflow
- —
- DSCR
- —
- Eligible?
- —
No personal income docs; deal must DSCR.
Hard money
10% down · 12.0% · 12mo
- Down + closing
- —
- Monthly P&I
- —
- Monthly cashflow
- —
- DSCR
- —
- Eligible?
- —
Short-term bridge; refi at stabilization.
Rent comps 1 comps
| Address | Beds | Baths | Sqft | Rent | $/sqft | DOM | Units | Dist |
|---|---|---|---|---|---|---|---|---|
| 10029 Harnew Rd E Oak Lawn, IL | 4.0 | 2.0 | 1575 | $2,600 | $1.65 | 3d | 1 | 1.43mi |
Listing history 18 events
-
2026-06-18days on market $295,000 Active 52 DOM
-
2026-06-17days on market $295,000 Active 51 DOM
-
2026-06-16days on market $295,000 Active 50 DOM
-
2026-06-15days on market $295,000 Active 49 DOM
-
2026-06-13days on market $295,000 Active 47 DOM
-
2026-06-13days on market $295,000 Active 46 DOM
-
2026-06-09days on market $295,000 Active 43 DOM
-
2026-06-08days on market $295,000 Active 42 DOM
-
2026-06-07days on market $295,000 Active 41 DOM
-
2026-06-04days on market $295,000 Active 38 DOM
-
2026-06-03days on market $295,000 Active 37 DOM
-
2026-06-02days on market $295,000 Active 36 DOM
-
2026-06-01days on market $295,000 Active 35 DOM
-
2026-05-31days on market $295,000 Active 34 DOM
-
2026-05-20price $295,000
-
2026-04-27$305,000 Active
-
2026-04-27historical
-
2026-04-02Active
ⓘ Source: listings_history table (triggers on properties + properties_extension) + one-shot
backfill from property_details.listing_events for pre-trigger history.
Tax reassessment forecast IL · Partial reset (capped growth)
- Current annual tax
- $5,187 · $432/mo
- Projected year-2 tax
- $5,942 · $495/mo
- Expected delta
- +$755/yr (+$63/mo · 14.5%)
ⓘ Screening estimate from a state-policy table — verify with the county assessor before closing.
Climate risk First Street
- Flood 1/10 Low FEMA zone X (unshaded) · 0% chance over 30 yrs
- Wildfire 1/10 Low
- Heat 3/10 Moderate 7 d/yr ≥101°F today · 15 d/yr by 30 yrs out
- Wind 2/10 Low 0% chance of damaging wind over 30 yrs
- Air quality 4/10 Moderate 4 unhealthy d/yr today · 6 by 30 yrs out
Nearby sold comps map
Loading sold comps map…
Walkable amenities ~0.75 mi
Loading nearby amenities…
Taxation est. · year 1
- Rental income
- $31,200
- − Mortgage interest
- −$16,525
- − Property taxes
- −$5,187
- − Insurance
- −$1,475
- − Repairs & maintenance
- −$2,496
- − Management
- −$2,496
- − Depreciation
- −$8,582
- Taxable loss
- −$5,561
- Est. tax savings @ 24.0%
- +$1,335
- After-tax cash flow
- $756/yr
For passive investors: Depreciation is non-cash, so a rental often shows a tax loss while cash-flowing — sheltering income. Rental losses are passive: they offset passive income freely, and up to $25,000/yr can offset ordinary (W-2) income if you actively participate and your MAGI is under $100k (phasing out to $0 by $150k); unused losses carry forward. On sale, claimed depreciation is recaptured at up to 25%, and gains may owe capital-gains tax (a 1031 exchange can defer both). Figures are a year-1 estimate at your 24.0% rate — not tax advice; consult a CPA.
Schools (NCES district)
- District
- Oak Lawn Chsd 229
- NCES district ID
- 1729220
- Math proficiency
- 22% ▼ -4.00%
- Reading proficiency
- 21% ▼ -4.00%
- Median HH income
- $52,505
- Composite
- 19.41/100
- National rank
- #8777
- State rank
- #384 of 620 in IL
Livability — Hometown
- Score
- 86/100
- State rank
- #21
- US rank
- #416
Category grades
Schools grade is shown separately in the Schools card above.
Census & demographics
- Census place
- Hometown, IL
- City population
- 4,244
- Population (ZIP)
- 4,244
Population outlook (Cook County) Hauer SSP2
- Today (2025)
- 5,347,519 people
- By 2030
- 5,357,703 · +0.2%
- By 2040
- 5,324,924 · -0.4%
- By 2050
- 5,230,762 · -2.2%
- By 2075
- 4,785,735 · -10.5%
- By 2100
- 4,188,836 · -21.7%
Race, ethnicity, and origin ACS 2023
- Neighborhood character
- Majority White (63%)
- Race & ethnicity
- White 63% Hispanic / Latino 32% Two or more races 16% Asian 1%
- Hispanic origin (detail)
- Mexican 24% Puerto Rican 5%
- Common ancestry
- Romanian 12% Lithuanian 1% Danish 1%
- Foreign-born
- 10% · Canada
- Languages at home
- 78% English-only · Spanish 20% Other Indo-European 1%
Political lean MEDSL · Cook
- 2024 margin
- Solid D (+42.0) · D 70.4% · R 28.4% · Other 1.2%
- 2008→2024 swing
- -11.4pp toward R · 2008: 53.4pp · 2024: 42.0pp
- All cycles
- 2024: D+42.0 2020: D+50.3 2016: D+53.0 2012: D+49.4 2008: D+53.4
Not yet ingested
- Civics
- —
Market trends
- HPI YoY
- ▼ -64.51%
- Current HPI
- 287.2695
- Rent YoY
- —
- Metro
- —
- State GDP YoY
- ▲ 1.59%
- F500 in state
- 60
Industry mix (Fortune 500 HQ in IL)
| Industry | F500 HQs | Revenue |
|---|---|---|
| Insurance | 4 | $201B |
|
||
| Consumer Goods | 4 | $87B |
|
||
| Industrial Machinery | 3 | $64B |
|
||
| Healthcare | 2 | $55B |
|
||
| Retail / Pharmacy | 1 | $148B |
|
||
| Agriculture / Food | 1 | $86B |
|
||
Price history
-3.3% since first listed4 events — show timeline
- 2026-05-20 Price Changed $295,000 MRED as Distributed by MLS Grid
- 2026-04-27 Listing Removed — MRED as Distributed by MLS Grid
- 2026-04-27 Listed $305,000 MRED as Distributed by MLS Grid
- 2026-04-02 Listed — MRED as Distributed by MLS Grid
Property tax history
+4.7%/yrLatest (2023): $5,187 · +34.2% YoY. Source: county tax records.
Cash-flow waterfall
monthlySold comps — $/sqft
last 12 mo · ≤1 miLoading sold comps…