6212 Chickney Dr · Princeton, TX
Flood risk 1/10 · Minimal
- FEMA flood zone
- X (unshaded)
- Chance of flooding over 30 yrs
- 0.0%
- Est. flood insurance / yr
- $507 – $1,088
Fire risk 3/10 · Minor
- Est. fire insurance / yr
- $1,222 – $2,270
Heat risk 7/10 · Major
- Hot days now (above 110°F)
- 6 days/yr
- Hot days in 30 yrs
- 19 days/yr
Wind risk 6/10 · Moderate
- Chance of severe wind over 30 yrs
- 27.0%
Air-quality risk 3/10 · Minor
- Unhealthy air days now
- 3 days/yr
- Unhealthy air days in 30 yrs
- 3 days/yr
Risk factors via First Street. Map © Google.
Why this score? — see what drove the D grade
The composite is a weighted blend of 9 inputs, each scored 0–100. Each bar is that input's sub-score; the figure is the points it added to the 100-point composite (weight × sub-score).
- Cash flow +10.6/30.0
- ARV discount +9.3/15.0
- Schools +5.0/10.0
- Condition / age +4.8/5.0
- 1% rule +3.4/10.0
- Livability +3.1/5.0
- DSCR +3.0/10.0
- Rent growth +2.0/5.0
- Appreciation +0.0/10.0
$281,557
🖨 Deal sheet 📄 Offer letter ✓ Due diligence
Listing remarks MLS
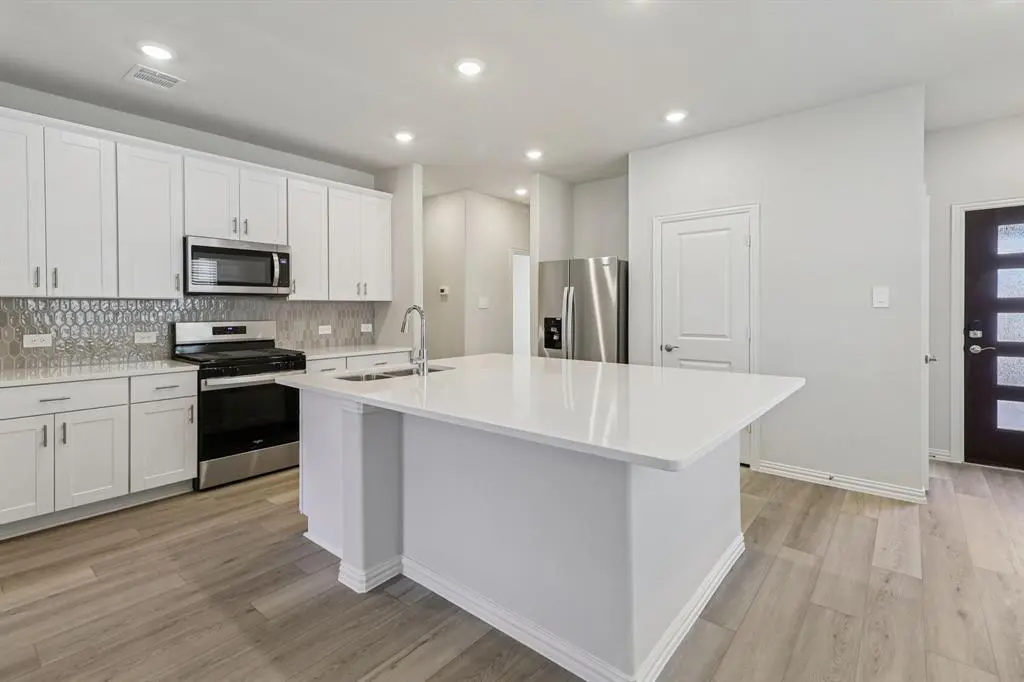
Enjoy family dinners around the kitchen island in the Sequoia's convenient eat-in kitchen. White cabinets with veined white quartz countertops, muted beige EVP flooring with light taupe carpet.
Key facts
- Resort style pool
- Kitchen island
- 4,792 sq ft lot
Tags
Neighborhood map
What this means for you Summary
Snapshot
- This is a 3-bed/2.0-bath single-family listed at $282k. Condition is rated excellent.
Deal economics
- At list price, monthly cash flow is $-142 ($-2k/yr) — negative.
- To cash-flow at today's rent, offer at most $261k (7.3% below list).
- To meet the 1% rule (rent ≥ 1% of price), the offer needs to be $237k (16.0% below list).
- Recommended offer: $237k (16.0% below list) — sets the bar for 1% rule.
- Cap rate 5.7% vs local median 4.5% in Princeton — meaningfully above typical; check what's discounted (condition, days-on-market, listing class) to confirm the premium yield is real.
Location & tenants
- Location reads 62/100 on livability (#969 in TX) — a middle-class / working-renter tenant base. Strengths: employment A+, housing A+, cost of living A; Watch: schools C-, amenities F, commute F.
- Mckinney ISD (suburban): math 54% / reading 58% proficiency, ranked #72 of 826 in TX (top 9%) — acceptable for families but not a draw, mixed tenant base, ~2y average lease.
- Market conditions: Rents soft (-2.1%/yr); 2125 active listings in the ZIP; 20 comparable units currently listed for rent nearby; rentals at typical pace (median 17d on market — plan ~3-4 weeks tenant-placement turnaround); high-income renter base; 19,194 units permitted in Collin County in 2024 (3,988 in 5+ unit buildings).
Forward outlook
- Local home prices are declining (-3.0%/yr); year-one equity from $2k of loan paydown is wiped out by about $8k of value loss. Plan a longer hold.
- Collin County population projected at +60% by 2050 — long-run rental-demand tailwind backs the buy-and-hold thesis.
Negotiation context
- It's been on market 64 days — a 6% lower offer ($265k) is reasonable based on typical stale-listing flexibility.
- 2 sale attempts with the ask held roughly flat each time — persistent listings suggest the price (not the market) is what's stuck; bring a comps-based counter.
Risks & watch-outs
- Climate carrying-cost: major wind risk, 27% chance of damaging wind over 30y; extreme-heat days projected 6→19/yr by 2055 (HVAC capex compounding) — expect insurance premiums to compound above CPI over the hold.
Questions for the listing agent
- What do current leases actually rent for vs. the listed asking? Can we see a recent rent roll and the last 12 months of T-12 income?
- It's been on market 64 days. Have you received any prior offers? Is the seller open to a 16% concession, seller financing, or rate buy-down credit?
- What does the HOA fee cover, when was the last increase, and are there any pending special assessments or reserve-fund shortfalls?
- Why hasn't it sold? Are there any deal-killer items the seller is aware of (foundation, flood, title, zoning, code violations)?
- Is there a deadline driving the sale (1031 exchange, divorce, estate, relocation)? That informs how much negotiation room exists.
- The area grade is low — what's the realistic commute time and amenity access for the typical tenant pool here? Any planned neighborhood developments (good or bad) we should know about?
- What's the average days-on-market for RENTAL listings here right now (not sales)? A rising rental-DOM trend means longer vacancies and softer asking-rent achievability than the comps imply.
- What's the recent tenant-quality profile in this submarket — average credit score on applications, eviction rate, late-payment / NSF rate, and stable-employment percentage? A property-management company in the area should have these aggregated.
- How much new for-sale + rental construction is in the pipeline within 1–3 miles? Heavy new supply typically softens prices + rents 12–24 months out; constrained supply supports both.
Investment metrics
- 1% rule
- 0.84% ✗
- Cap rate
- 5.69%
- Cash-on-cash
- -2.15%
- DSCR
- 0.90
- GRM
- 9.9
CMA / ARV
- ARV (median comp)
- $293,138
- List price
- $281,557
- Delta
- -3.95%
- Verdict
- FAIR
- Comps
- 20 within 1.0 mi
Show comp detail 12 sales within ~0.75 mi
| Address | Dist | Beds/Ba | Sqft | Sold | Price | $/sf | Match |
|---|---|---|---|---|---|---|---|
| 6004 Belchamp Dr | 0.25mi | 3/2.0 | 1,318 (0%) | 1mo | $281,257 | $213 | 88 |
| 1130 Old Stead Dr | 0.27mi | 3/2.0 | 1,318 (0%) | 0mo | $285,397 | $217 | 87 |
| 1213 Bridgewalk Dr | 0.28mi | 3/2.0 | 1,318 (0%) | 2mo | $280,357 | $213 | 86 |
| 715 Dotty Dr | 0.45mi | 3/2.0 | 1,318 (0%) | 2mo | $276,097 | $209 | 77 |
| 803 Dotty Dr | 0.45mi | 3/2.0 | 1,318 (0%) | 3mo | $275,736 | $209 | 77 |
| 707 Dotty Dr | 0.46mi | 3/2.0 | 1,318 (0%) | 3mo | $277,257 | $210 | 76 |
| 804 Leavenworth Dr | 0.47mi | 3/2.0 | 1,318 (0%) | 4mo | $274,357 | $208 | 75 |
| 714 Leavenworth Dr | 0.48mi | 3/2.0 | 1,318 (0%) | 4mo | $261,017 | $198 | 74 |
| 809 Leavenworth Dr | 0.50mi | 3/2.0 | 1,318 (0%) | 4mo | $269,097 | $204 | 73 |
| 707 Leavenworth Dr | 0.52mi | 3/2.0 | 1,318 (0%) | 4mo | $269,097 | $204 | 72 |
| 826 Honeydew Ln | 0.72mi | 3/2.0 | 1,318 (0%) | 14mo | $306,533 | $233 | 54 |
| 818 Honeydew Ln | 0.73mi | 3/2.0 | 1,318 (0%) | 15mo | $303,793 | $230 | 53 |
Match score weights: distance 35% · size 25% · config 20% · recency 20%. Top-matched comps best support the ARV.
Projected returns pro-forma
-3.0% appreciation · 0.0% rent growth · sell at horizon
- IRR
- -23.4%
- Equity multiple
- 0.22×
- Total profit
- $-61,500
- Equity at exit
- $41,981
- IRR
- -29.6%
- Equity multiple
- -0.16×
- Total profit
- $-91,654
- Equity at exit
- $24,344
Cash invested: $78,836 (down + closing). Projections, not guarantees.
Landlord ↔ Tenant lean methodology
- Overall (STATE)
- 87 Strongly Landlord-Friendly
- State Texas
- 87 Strongly Landlord-Friendly · R+5
- County
- — inherits STATE
- City
- — inherits STATE
ZIP-level market 75071
- Home prices YoY
- -19.1%
- Rents YoY
- -2.1%
- Active inventory
- 2125
- Price-to-rent
- 9.9×
Monthly cashflow live
- Estimated rent
- $2,366 high interval (Pro) →
- Mortgage (P&I)
- −$1,477
- Tax est. 1.5%
- −$352 /mo · $4,223/yr
- Insurance
- −$117
- HOA
- −$65
- Vacancy / Maint / Mgmt
- −$497
- Net cashflow
- $-142
Break-even live
UW: 25.0% down · 7.5% · 30yr · 1.5% tax · 5.0% vac · 8.0% maint · 8.0% mgmt
Financing live
Cash to close
- Down payment
- $70,389
- Closing costs
- $8,447
- Reserves months
- —
- Total cash needed
- —
Loan-product check · same deal, 3 products live
Conventional
25% down · 7.5% · 30yr
- Down + closing
- —
- Monthly P&I
- —
- Monthly cashflow
- —
- DSCR
- —
- Eligible?
- —
Personal DTI + credit; lowest rate.
DSCR
20% down · 8.5% · 30yr
- Down + closing
- —
- Monthly P&I
- —
- Monthly cashflow
- —
- DSCR
- —
- Eligible?
- —
No personal income docs; deal must DSCR.
Hard money
10% down · 12.0% · 12mo
- Down + closing
- —
- Monthly P&I
- —
- Monthly cashflow
- —
- DSCR
- —
- Eligible?
- —
Short-term bridge; refi at stabilization.
Rent comps 20 comps
| Address | Beds | Baths | Sqft | Rent | $/sqft | DOM | Units | Dist |
|---|---|---|---|---|---|---|---|---|
| 1211 Bridgewalk Dr McKinney, TX | 4.0 | 2.0 | 1605 | $2,500 | $1.56 | 24d | 1 | 0.25mi |
| 1209 Bridgewalk Dr McKinney, TX | 3.0 | 2.0 | 1551 | $2,299 | $1.48 | 5d | 1 | 0.25mi |
| 1209 Bridgewalk Dr McKinney, TX | 3.0 | 2.0 | 1551 | $2,350 | $1.52 | 24d | 1 | 0.25mi |
| 715 Dotty Dr McKinney, TX | 3.0 | 2.0 | 1318 | $2,200 | $1.67 | 24d | 1 | 0.42mi |
| 808 Leavenworth Dr McKinney, TX | 4.0 | 2.0 | 1605 | $3,300 | $2.06 | 16d | 1 | 0.43mi |
| 1004 Knox River Dr McKinney, TX | 3.0 | 2.0 | 1609 | $1,999 | $1.24 | 7d | 1 | 0.46mi |
| 1004 Knox River Dr McKinney, TX | 3.0 | 2.0 | 1609 | $1,999 | $1.24 | 12d | 1 | 0.46mi |
| 704 Summerberry Dr McKinney, TX | 4.0 | 2.0 | 1818 | $2,700 | $1.49 | 1d | 1 | 0.70mi |
| 610 Clover Creek Dr Unit 610 McKinney, TX | 3.0 | 2.0 | 1533 | $2,250 | $1.47 | 43d | 1 | 0.83mi |
| 600 Clover Creek Dr McKinney, TX | 3.0 | 2.0 | 1533 | $2,500 | $1.63 | 1d | 1 | 0.84mi |
| 607 Clover Creek Dr McKinney, TX | 3.0 | 2.0 | 1551 | $2,300 | $1.48 | 11d | 1 | 0.86mi |
| 514 Green Grass Dr McKinney, TX | 3.0 | 2.0 | 1504 | $2,300 | $1.53 | 3d | 1 | 0.90mi |
| 519 Green Grass Dr McKinney, TX | 3.0 | 2.0 | 1450 | $2,500 | $1.72 | 1d | 1 | 0.92mi |
| 506 Towerglen Dr McKinney, TX | 3.0 | 2.0 | 1503 | $2,100 | $1.40 | 43d | 1 | 0.95mi |
| 7221 Mayplace Dr McKinney, TX | 4.0 | 2.0 | 1836 | $2,300 | $1.25 | 24d | 1 | 1.14mi |
| 421 Bertney Dr McKinney, TX | 3.0 | 2.0 | 1500 | $2,200 | $1.47 | 43d | 1 | 1.19mi |
| 114 Mountain Meadow Ln McKinney, TX | 3.0 | 2.0 | 1475 | $2,300 | $1.56 | 43d | 1 | 1.37mi |
| 108 Mountain Meadow Ln McKinney, TX | 3.0 | 2.0 | 1566 | $2,200 | $1.40 | 43d | 1 | 1.39mi |
| 4330 FM 75 Princeton, TX | 4.0 | 2.0 | 1832 | $2,200 | $1.20 | 10d | 1 | 1.41mi |
| 4908 Pebblewood Dr McKinney, TX | 4.0 | 2.0 | 1818 | $2,595 | $1.43 | 2d | 1 | 1.44mi |
HOA detail
- Monthly dues
- $65 · $780/yr
Listing history 15 events
-
2026-06-18days on market $281,557 Active 64 DOM
-
2026-06-17days on market $281,557 Active 63 DOM
-
2026-06-16days on market $281,557 Active 62 DOM
-
2026-06-15days on market $281,557 Active 61 DOM
-
2026-06-13days on market $281,557 Active 59 DOM
-
2026-06-09days on market $281,557 Active 55 DOM
-
2026-06-08days on market $281,557 Active 54 DOM
-
2026-06-07days on market $281,557 Active 53 DOM
-
2026-06-04pricedays on market $281,557 Active 50 DOM
-
2026-06-03days on market $280,057 Active 49 DOM
-
2026-06-02days on market $280,057 Active 48 DOM
-
2026-06-01days on market $280,057 Active 47 DOM
-
2026-05-31days on market $280,057 Active 46 DOM
-
2026-04-22$280,057 Active 193-char remark
Show marketing remark (193 chars)
Enjoy family dinners around the kitchen island in the Sequoia's convenient eat-in kitchen. White cabinets with veined white quartz countertops, muted beige EVP flooring with light taupe carpet.
-
2026-04-15$280,057 Active 758-char remark
Show marketing remark (758 chars)
BRAND NEW energy - efficient home Jun 2026! Enjoy family dinners around the kitchen island in the Sequoia's convenient eat-in kitchen. White cabinets with veined white quartz countertops, muted beige EVP flooring with light taupe carpet. Spend the weekends debating what activity to do in this amenity-filled community, make a splash in the resort-style pool, pick up a game of basketball, or let the kids loose on the playground. With quick access to US 380, residents will enjoy the benefits of a short commute to downtown McKinney, Frisco, or Richardson to enjoy nearby shopping and entertainment. Each of our homes is built with innovative, energy-efficient features designed to help you enjoy more savings, better health, real comfort and peace of mind.
ⓘ Source: listings_history table (triggers on properties + properties_extension) + one-shot
backfill from property_details.listing_events for pre-trigger history.
Climate risk First Street
- Flood 1/10 Low FEMA zone X (unshaded) · 0% chance over 30 yrs
- Wildfire 3/10 Moderate
- Heat 7/10 Severe 6 d/yr ≥110°F today · 19 d/yr by 30 yrs out
- Wind 6/10 Major 27% chance of damaging wind over 30 yrs
- Air quality 3/10 Moderate 3 unhealthy d/yr today · 3 by 30 yrs out
Nearby sold comps map
Loading sold comps map…
Walkable amenities ~0.75 mi
Loading nearby amenities…
Taxation est. · year 1
- Rental income
- $28,393
- − Mortgage interest
- −$15,772
- − Property taxes
- −$4,223
- − Insurance
- −$1,408
- − Repairs & maintenance
- −$2,271
- − Management
- −$2,271
- − HOA
- −$780
- − Depreciation
- −$8,191
- Taxable loss
- −$6,523
- Est. tax savings @ 24.0%
- +$1,566
- After-tax cash flow
- $-133/yr
For passive investors: Depreciation is non-cash, so a rental often shows a tax loss while cash-flowing — sheltering income. Rental losses are passive: they offset passive income freely, and up to $25,000/yr can offset ordinary (W-2) income if you actively participate and your MAGI is under $100k (phasing out to $0 by $150k); unused losses carry forward. On sale, claimed depreciation is recaptured at up to 25%, and gains may owe capital-gains tax (a 1031 exchange can defer both). Figures are a year-1 estimate at your 24.0% rate — not tax advice; consult a CPA.
Condition & rehab AI · 12 photos
This home is in excellent condition with no visible repairs or maintenance needed. It is move-in ready and has the potential for further value increases through exterior painting and landscaping improvements.
Value-add opportunities
- Both Painting the exterior brick and siding — Enhances curb appeal and can increase both resale and rental value
- Both Landscaping improvements — Enhances curb appeal and can increase both resale and rental value
Renovation cost estimate screening
Value-add ROI direction
- Both Painting the exterior brick and siding — Enhances curb appeal and can increase both resale and rental value ↑
- Both Landscaping improvements — Enhances curb appeal and can increase both resale and rental value ↑
ⓘ Cost ranges are severity-bucket heuristics (US national rule-of-thumb). Get contractor quotes + a written scope before underwriting a rehab budget.
Schools (NCES district)
- District
- Mckinney ISD
- NCES district ID
- 4829850
- Math proficiency
- 54% ▼ -9.00%
- Reading proficiency
- 58% ▼ -2.00%
- Median HH income
- $78,283
- Composite
- 50.46/100
- National rank
- #1862
- State rank
- #72 of 826 in TX
Livability — Princeton
- Score
- 62/100
- State rank
- #969
- US rank
- #17215
Category grades
Schools grade is shown separately in the Schools card above.
Census & demographics
- County
- Collin County · 1,159,394 people
- City population
- 34,171
- Metro
- Dallas-Fort Worth-Arlington, TX
- Population (ZIP)
- 72,964
- Household income
- $132,447
- Rent vs Own
- Severe rent burden
- 1682.0
Population outlook (Collin County) Hauer SSP2
- Today (2025)
- 1,210,074 people
- By 2030
- 1,358,201 · +12.2%
- By 2040
- 1,654,061 · +36.7%
- By 2050
- 1,937,359 · +60.1%
- By 2075
- 2,567,039 · +112.1%
- By 2100
- 2,952,048 · +144.0%
Race, ethnicity, and origin ACS 2023
- Neighborhood character
- Diverse neighborhood (Simpson 0.64)
- Race & ethnicity
- White 55% Hispanic / Latino 17% Black 13% Two or more races 12% Asian 10%
- Hispanic origin (detail)
- Mexican 12%
- Common ancestry
- Italian 2% Slovak 2% Portuguese 1%
- Foreign-born
- 16% · Canada, China, South Korea
- Languages at home
- 76% English-only · Spanish 11% Other Indo-European 4% Other Asian/Pacific 2%
Political lean MEDSL · Collin
- 2024 margin
- R (+11.1) · D 43.1% · R 54.3% · Other 2.6%
- 2008→2024 swing
- +14.4pp toward D · 2008: -25.6pp · 2024: -11.1pp
- All cycles
- 2024: R+11.1 2020: R+4.3 2016: R+17.0 2012: R+31.6 2008: R+25.6
Not yet ingested
- Civics
- —
Market trends
- HPI YoY
- ▼ -59.92%
- Current HPI
- 254.4946
- Rent YoY
- ▼ -2.15%
- Metro
- Dallas-Fort Worth-Arlington, TX
- State GDP YoY
- ▲ 3.95%
- F500 in state
- 110
Industry mix (Fortune 500 HQ in TX)
| Industry | F500 HQs | Revenue |
|---|---|---|
| Energy | 16 | $1,198B |
|
||
| Technology | 5 | $198B |
|
||
| Engineering / Construction | 4 | $72B |
|
||
| Energy Services | 3 | $60B |
|
||
| Utilities | 3 | $41B |
|
||
| Healthcare | 2 | $330B |
|
||
Price history
+0.0% since first listed2 events — show timeline
- 2026-04-22 Listed $280,057 Zillow
- 2026-04-15 Listed $280,057 NTREIS
Cash-flow waterfall
monthlySold comps — $/sqft
last 12 mo · ≤1 miLoading sold comps…