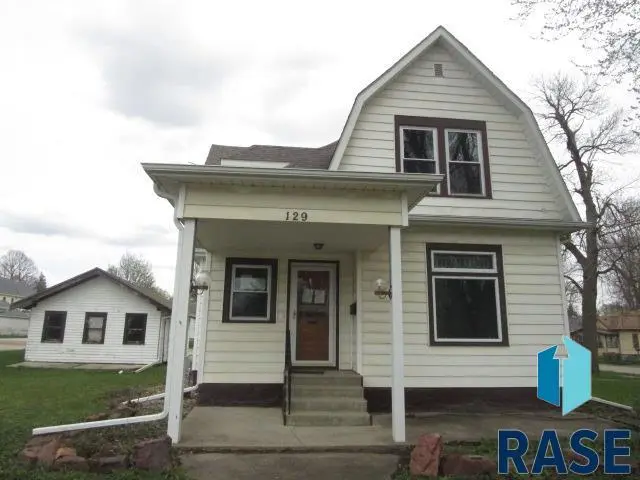
129 SW Park St St · Luverne, MN
Flood risk 1/10 · Minimal
- FEMA flood zone
- X
- Chance of flooding over 30 yrs
- 0.0%
- Est. flood insurance / yr
- $473 – $860
Fire risk 1/10 · Minimal
- Est. fire insurance / yr
- $888 – $1,650
Heat risk 2/10 · Minimal
- Hot days now (above 99°F)
- 7 days/yr
- Hot days in 30 yrs
- 15 days/yr
Wind risk 2/10 · Minimal
- Chance of severe wind over 30 yrs
- —
Air-quality risk 2/10 · Minimal
- Unhealthy air days now
- 1 days/yr
- Unhealthy air days in 30 yrs
- 1 days/yr
Risk factors via First Street. Map © Google.
Why this score? — see what drove the B grade
The composite is a weighted blend of 9 inputs, each scored 0–100. Each bar is that input's sub-score; the figure is the points it added to the 100-point composite (weight × sub-score).
- Cash flow +30.0/30.0
- 1% rule +10.0/10.0
- DSCR +10.0/10.0
- ARV discount +7.5/15.0
- Schools +4.8/10.0
- Livability +4.3/5.0
- Rent growth +2.5/5.0
- Condition / age +2.2/5.0
- Appreciation +0.0/10.0
$89,900
🖨 Deal sheet 📄 Offer letter ✓ Due diligence
Listing remarks MLS
Great opportunity to bring this home back to life. Some remodeling has been started, and the fun rebuilding stage is next. With over 2200 sq ft of above grade finished living space you will enjoy the large bedrooms and accessibility to bathrooms on all levels. 4 beds and 3 baths. Property boasts a detached 2 stall garage. Large Kitchen. This home has great bones and has so much potential. Sold AS IS.
Key facts
- 0.31 acre lot
- 2 garage spots
- Built 1908
Neighborhood map
What this means for you Summary
Snapshot
- This is a 4-bed/3.0-bath single-family listed at $90k. Condition is rated fair.
Deal economics
- At list price, monthly cash flow is $598 ($7k/yr) — positive.
- The deal already cash-flows at list — no discount required.
- Meets the 1% rule at list price ($2k rent vs $90k).
- Recommended offer: $79k (12.0% below list) — sets the bar for market timing.
- Cap rate 14.3% vs local median 3.6% in Luverne — top-decile yield for the area; either an underpriced asset or a hidden risk that comps aren't pricing in. Stress-test before assuming the spread holds.
Location & tenants
- Location reads 86/100 on livability (#14 in MN, #455 nationally) — a professional / high-income tenant draw. Strengths: amenities A+, cost of living A+, housing A+; Watch: commute F.
- Luverne Public School District (rural): math 55% / reading 58% proficiency, ranked #64 of 301 in MN (top 21%) — acceptable for families but not a draw, mixed tenant base, ~2y average lease.
- Market conditions: 64 active listings in the ZIP; 66 units permitted in Rock County in 2024 (50 in 5+ unit buildings).
Forward outlook
- Local home prices are declining (-3.0%/yr); year-one equity from $622 of loan paydown is wiped out by about $3k of value loss. Plan a longer hold.
- Rock County population projected to shrink 9% by 2050 — rents likely to lag national; underwrite the cash flow, not the appreciation.
- At projected returns (-3.0% appreciation + 3.0% rent growth), your $25k cash investment doubles in ~5 years — after that, you're playing with house money.
Negotiation context
- It's been on market 188 days — a 12% lower offer ($79k) is reasonable based on typical stale-listing flexibility.
Risks & watch-outs
- Watch-outs: built in 1908 — expect roof / HVAC / electrical / plumbing capex.
Questions for the listing agent
- It's been on market 188 days. Have you received any prior offers? Is the seller open to a 12% concession, seller financing, or rate buy-down credit?
- Have any recent inspections been done? Can we get a copy of the seller's disclosures and any deferred-maintenance estimates?
- Built in 1908 — when were the roof, HVAC, electrical panel, plumbing, and water heater last replaced?
- Why hasn't it sold? Are there any deal-killer items the seller is aware of (foundation, flood, title, zoning, code violations)?
- Is there a deadline driving the sale (1031 exchange, divorce, estate, relocation)? That informs how much negotiation room exists.
- Schools are B-rated — typically a magnet for longer-tenancy family renters. What's the average tenant stay here, and is there a school-zone premium baked into asking?
- What's the average days-on-market for RENTAL listings here right now (not sales)? A rising rental-DOM trend means longer vacancies and softer asking-rent achievability than the comps imply.
- What's the recent tenant-quality profile in this submarket — average credit score on applications, eviction rate, late-payment / NSF rate, and stable-employment percentage? A property-management company in the area should have these aggregated.
- How much new for-sale + rental construction is in the pipeline within 1–3 miles? Heavy new supply typically softens prices + rents 12–24 months out; constrained supply supports both.
Investment metrics
- 1% rule
- 1.72% ✓
- Cap rate
- 14.28%
- Cash-on-cash
- 28.52%
- DSCR
- 2.27
- GRM
- 4.9
CMA / ARV
- ARV (median comp)
- $294,615
- List price
- $89,900
- Delta
- -69.49%
- Verdict
- UNDERPRICED
- Comps
- 15 within 1.0 mi
Show comp detail 5 sales within ~0.75 mi
| Address | Dist | Beds/Ba | Sqft | Sold | Price | $/sf | Match |
|---|---|---|---|---|---|---|---|
| 313 W Luverne St St | 0.24mi | 5/2.5 (+1) | 3,122 (+1%) | 8mo | $305,500 | $98 | 74 |
| 405 W Bishop St | 0.41mi | 4/4.0 | 3,289 (+6%) | 14mo | $295,000 | $90 | 55 |
| 801 W WARREN St | 0.25mi | 4/2.0 | 2,738 (-12%) | 13mo | $540,000 | $197 | 54 |
| 417 W Crawford St | 0.35mi | 5/2.5 (+1) | 3,318 (+7%) | 14mo | $420,000 | $127 | 53 |
| 520 W Luverne St | 0.29mi | 3/2.0 (-1) | 2,696 (-13%) | 22mo | $270,000 | $100 | 38 |
Match score weights: distance 35% · size 25% · config 20% · recency 20%. Top-matched comps best support the ARV.
Projected returns pro-forma
-3.0% appreciation · 3.0% rent growth · sell at horizon
- IRR
- 22.8%
- Equity multiple
- 1.94×
- Total profit
- $23,565
- Equity at exit
- $13,404
- IRR
- 30.8%
- Equity multiple
- 3.77×
- Total profit
- $69,687
- Equity at exit
- $7,773
Cash invested: $25,172 (down + closing). Projections, not guarantees.
Landlord ↔ Tenant lean methodology
- Overall (STATE)
- 46 Balanced
- State Minnesota
- 46 Balanced · D+2
- County
- — inherits STATE
- City
- — inherits STATE
ZIP-level market 56156
- Active inventory
- 64
- Price-to-rent
- 4.9×
Monthly cashflow live
- Estimated rent
- $1,544 medium interval (Pro) →
- Mortgage (P&I)
- −$471
- Tax est. 1.5%
- −$112 /mo · $1,348/yr
- Insurance
- −$37
- HOA
- −$0
- Vacancy / Maint / Mgmt
- −$324
- Net cashflow
- $598
Break-even live
UW: 25.0% down · 7.5% · 30yr · 1.5% tax · 5.0% vac · 8.0% maint · 8.0% mgmt
Financing live
Cash to close
- Down payment
- $22,475
- Closing costs
- $2,697
- Reserves months
- —
- Total cash needed
- —
Loan-product check · same deal, 3 products live
Conventional
25% down · 7.5% · 30yr
- Down + closing
- —
- Monthly P&I
- —
- Monthly cashflow
- —
- DSCR
- —
- Eligible?
- —
Personal DTI + credit; lowest rate.
DSCR
20% down · 8.5% · 30yr
- Down + closing
- —
- Monthly P&I
- —
- Monthly cashflow
- —
- DSCR
- —
- Eligible?
- —
No personal income docs; deal must DSCR.
Hard money
10% down · 12.0% · 12mo
- Down + closing
- —
- Monthly P&I
- —
- Monthly cashflow
- —
- DSCR
- —
- Eligible?
- —
Short-term bridge; refi at stabilization.
Listing history 20 events
-
2026-06-18days on market $89,900 Active 188 DOM
-
2026-06-17days on market $89,900 Active 187 DOM
-
2026-06-16days on market $89,900 Active 186 DOM
-
2026-06-15days on market $89,900 Active 185 DOM
-
2026-06-14price $89,900 Active 183 DOM
-
2026-06-13days on market $99,900 Active 183 DOM
-
2026-06-12days on market $99,900 Active 182 DOM
-
2026-06-09days on market $99,900 Active 179 DOM
-
2026-06-08days on market $99,900 Active 178 DOM
-
2026-06-07days on market $99,900 Active 177 DOM
-
2026-06-07days on market $99,900 Active 176 DOM
-
2026-06-04days on market $99,900 Active 173 DOM
-
2026-06-02days on market $99,900 Active 172 DOM
-
2026-06-01days on market $99,900 Active 171 DOM
-
2026-05-31days on market $99,900 Active 170 DOM
-
2026-05-31days on market $99,900 Active 169 DOM
-
2026-04-30price $99,900 403-char remark
Show marketing remark (403 chars)
Great opportunity to bring this home back to life. Some remodeling has been started, and the fun rebuilding stage is next. With over 2200 sq ft of above grade finished living space you will enjoy the large bedrooms and accessibility to bathrooms on all levels. 4 beds and 3 baths. Property boasts a detached 2 stall garage. Large Kitchen. This home has great bones and has so much potential. Sold AS IS.
-
2026-03-15price $109,900 403-char remark
Show marketing remark (403 chars)
Great opportunity to bring this home back to life. Some remodeling has been started, and the fun rebuilding stage is next. With over 2200 sq ft of above grade finished living space you will enjoy the large bedrooms and accessibility to bathrooms on all levels. 4 beds and 3 baths. Property boasts a detached 2 stall garage. Large Kitchen. This home has great bones and has so much potential. Sold AS IS.
-
2026-01-23price $119,900 403-char remark
Show marketing remark (403 chars)
Great opportunity to bring this home back to life. Some remodeling has been started, and the fun rebuilding stage is next. With over 2200 sq ft of above grade finished living space you will enjoy the large bedrooms and accessibility to bathrooms on all levels. 4 beds and 3 baths. Property boasts a detached 2 stall garage. Large Kitchen. This home has great bones and has so much potential. Sold AS IS.
-
2025-12-11$129,900 Active 403-char remark
Show marketing remark (403 chars)
Great opportunity to bring this home back to life. Some remodeling has been started, and the fun rebuilding stage is next. With over 2200 sq ft of above grade finished living space you will enjoy the large bedrooms and accessibility to bathrooms on all levels. 4 beds and 3 baths. Property boasts a detached 2 stall garage. Large Kitchen. This home has great bones and has so much potential. Sold AS IS.
ⓘ Source: listings_history table (triggers on properties + properties_extension) + one-shot
backfill from property_details.listing_events for pre-trigger history.
Climate risk First Street
- Flood 1/10 Low FEMA zone X · 0% chance over 30 yrs
- Wildfire 1/10 Low
- Heat 2/10 Low 7 d/yr ≥99°F today · 15 d/yr by 30 yrs out
- Wind 2/10 Low
- Air quality 2/10 Low 1 unhealthy d/yr today · 1 by 30 yrs out
Nearby sold comps map
Loading sold comps map…
Walkable amenities ~0.75 mi
Loading nearby amenities…
Taxation est. · year 1
- Rental income
- $18,526
- − Mortgage interest
- −$5,036
- − Property taxes
- −$1,348
- − Insurance
- −$450
- − Repairs & maintenance
- −$1,482
- − Management
- −$1,482
- − Depreciation
- −$2,615
- Taxable income
- $6,113
- Est. tax owed @ 24.0%
- −$1,467
- After-tax cash flow
- $5,713/yr
For passive investors: Depreciation is non-cash, so a rental often shows a tax loss while cash-flowing — sheltering income. Rental losses are passive: they offset passive income freely, and up to $25,000/yr can offset ordinary (W-2) income if you actively participate and your MAGI is under $100k (phasing out to $0 by $150k); unused losses carry forward. On sale, claimed depreciation is recaptured at up to 25%, and gains may owe capital-gains tax (a 1031 exchange can defer both). Figures are a year-1 estimate at your 24.0% rate — not tax advice; consult a CPA.
Condition & rehab AI · 12 photos
This home has average physical condition and requires moderate renovations to improve its value. The kitchen and bathrooms are in average condition and can be updated to increase both resale and rental value.
Repairs flagged
- Minor kitchen cabinets — existing condition
- Minor bathroom vanity — existing condition
- Moderate HVAC system — existing condition
Value-add opportunities
- Both kitchen renovation — modernizing the kitchen can increase both resale and rental value
- Both bathroom renovation — modernizing the bathrooms can increase both resale and rental value
- Both HVAC system upgrade — upgrading the HVAC system can improve comfort and energy efficiency, increasing both resale and rental value
Renovation cost estimate screening
| Repair item | Severity | Est. cost |
|---|---|---|
| kitchen cabinets · existing condition | Minor | $500–3,000 |
| bathroom vanity · existing condition | Minor | $500–3,000 |
| HVAC system · existing condition | Moderate | $3,000–15,000 |
| Total estimated repair cost · 3 items | $4,000–21,000 |
Value-add ROI direction
- Both kitchen renovation — modernizing the kitchen can increase both resale and rental value ↑
- Both bathroom renovation — modernizing the bathrooms can increase both resale and rental value ↑
- Both HVAC system upgrade — upgrading the HVAC system can improve comfort and energy efficiency, increasing both resale and rental value ↑
ⓘ Cost ranges are severity-bucket heuristics (US national rule-of-thumb). Get contractor quotes + a written scope before underwriting a rehab budget.
Schools (NCES district)
- District
- Luverne Public School District
- NCES district ID
- 2718330
- Math proficiency
- 55% ▼ -14.00%
- Reading proficiency
- 58% ▼ -2.00%
- Median HH income
- $48,225
- Composite
- 48.0/100
- National rank
- #2198
- State rank
- #64 of 301 in MN
Livability — Luverne
- Score
- 86/100
- State rank
- #14
- US rank
- #455
Category grades
Schools grade is shown separately in the Schools card above.
Census & demographics
- Census place
- Luverne, MN
- Population (ZIP)
- 6,398
Population outlook (Rock County) Hauer SSP2
- Today (2025)
- 9,476 people
- By 2030
- 9,326 · -1.6%
- By 2040
- 9,006 · -5.0%
- By 2050
- 8,662 · -8.6%
- By 2075
- 7,973 · -15.9%
- By 2100
- 7,033 · -25.8%
Race, ethnicity, and origin ACS 2023
- Neighborhood character
- Predominantly White (92%)
- Race & ethnicity
- White 92% Two or more races 4% Hispanic / Latino 3%
- Common ancestry
- Portuguese 16% Iranian 14% Slovak 2%
- Foreign-born
- 2% · Canada
- Languages at home
- 97% English-only · Spanish 2% Other Asian/Pacific 1%
Political lean MEDSL · Rock
- 2024 margin
- Solid R (+39.3) · D 29.6% · R 68.8% · Other 1.6%
- 2008→2024 swing
- -25.3pp toward R · 2008: -14.0pp · 2024: -39.3pp
- All cycles
- 2024: R+39.3 2020: R+38.7 2016: R+35.7 2012: R+17.9 2008: R+14.0
Not yet ingested
- Civics
- —
Market trends
- HPI YoY
- ▼ -189.55%
- Current HPI
- 211.0729
- Rent YoY
- —
- Metro
- —
- State GDP YoY
- ▲ 2.41%
- F500 in state
- 34
Industry mix (Fortune 500 HQ in MN)
| Industry | F500 HQs | Revenue |
|---|---|---|
| Healthcare | 2 | $407B |
|
||
| Retail | 2 | $150B |
|
||
| Consumer Goods | 2 | $32B |
|
||
| Industrial Machinery | 2 | $6B |
|
||
| Agriculture | 1 | $40B |
|
||
| Healthcare / Medical Devices | 1 | $32B |
|
||
Price history
-23.1% since first listed4 events — show timeline
- 2026-04-30 Price Changed $99,900 REALTOR® Association of the Sioux Empire
- 2026-03-15 Price Changed $109,900 REALTOR® Association of the Sioux Empire
- 2026-01-23 Price Changed $119,900 REALTOR® Association of the Sioux Empire
- 2025-12-11 Listed $129,900 REALTOR® Association of the Sioux Empire
Cash-flow waterfall
monthlySold comps — $/sqft
last 12 mo · ≤1 miLoading sold comps…