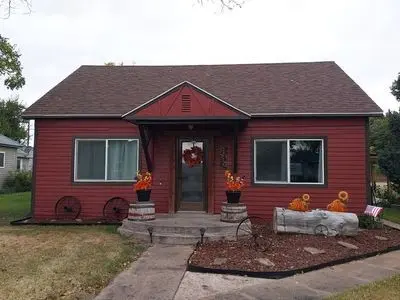
842 1st St · Chappell, NE
Flood risk 1/10 · Minimal
- FEMA flood zone
- —
- Chance of flooding over 30 yrs
- 0.0%
- Est. flood insurance / yr
- —
Fire risk 4/10 · Minor
- Est. fire insurance / yr
- $1,161 – $2,155
Heat risk 3/10 · Minor
- Hot days now (above 97°F)
- 7 days/yr
- Hot days in 30 yrs
- 18 days/yr
Wind risk 2/10 · Minimal
- Chance of severe wind over 30 yrs
- —
Air-quality risk 2/10 · Minimal
- Unhealthy air days now
- 1 days/yr
- Unhealthy air days in 30 yrs
- 1 days/yr
Risk factors via First Street. Map © Google.
Why this score? — see what drove the D grade
The composite is a weighted blend of 9 inputs, each scored 0–100. Each bar is that input's sub-score; the figure is the points it added to the 100-point composite (weight × sub-score).
- Cash flow +9.9/30.0
- Appreciation +8.7/10.0
- ARV discount +7.5/15.0
- Schools +3.7/10.0
- Livability +3.7/5.0
- DSCR +2.8/10.0
- Rent growth +2.5/5.0
- Condition / age +2.5/5.0
- 1% rule +1.7/10.0
$160,000
🖨 Deal sheet 📄 Offer letter ✓ Due diligence
Listing remarks
Beautiful 1300sq ft updated home located in the heart of Chappell, NE. Within walking distance to Chappell& apos; s many amenities, this home features 2 bedrooms and 1 large bath with shower/soaking tub combo. The homes interior remodel was completed in 2021. The kitchen offers a large island, plenty of storage and stainless steel appliances. 9ft ceilings throughout and open concept living make this home ideal for everyday living and entertaining. The outdoor patio provides a large outdoor living area and had a complete remodel in 2025. Roof was completely done with Malarkey Shingles in 2025. Senville Aura/33,000BTU Mini-Split was installed in 2025. Exterior was painted in 2023. A sma
Key facts
- Interior remodel
- Plenty of storage
- Large island
Tags
Neighborhood map
What this means for you Summary
Snapshot
- This is a 2-bed/1.0-bath single-family listed at $160k.
Deal economics
- At list price, monthly cash flow is $-99 ($-1k/yr) — negative.
- To cash-flow at today's rent, offer at most $143k (10.9% below list).
- To meet the 1% rule (rent ≥ 1% of price), the offer needs to be $107k (33.3% below list).
- Recommended offer: $107k (33.3% below list) — sets the bar for 1% rule.
Location & tenants
- Location reads 73/100 on livability (#142 in NE) — a middle-class / working-renter tenant base. Strengths: cost of living A+, housing A+, health & safety A+; Watch: schools C-, employment C-, amenities F.
- Creek Valley Schools (rural): math 40% / reading 40% proficiency, ranked #208 of 245 in NE (top 85%) — families likely to look elsewhere, expect single-tenant / working-renter base with shorter leases.
- Market conditions: 1 active listings in the ZIP; 3 units permitted in Deuel County in 2024 (0 in 5+ unit buildings).
Forward outlook
- In year one you build about $13k of equity ($1k loan paydown + $12k appreciation (7.4% local appreciation)).
- Deuel County population projected at +22% by 2050 — long-run rental-demand tailwind backs the buy-and-hold thesis.
- By year 3, paydown + projected appreciation supports a ~$32k cash-out refi (75% LTV) — recoverable capital for the next deal without selling this one.
Negotiation context
- Only 9 days on market — expect competitive offers; lowballing is unlikely to land.
- Current owner paid $70k; list at $160k implies a 129% gain — meaningful room to come down on a strong offer.
Risks & watch-outs
- Watch-outs: built in 1905 — expect roof / HVAC / electrical / plumbing capex.
Questions for the listing agent
- What do current leases actually rent for vs. the listed asking? Can we see a recent rent roll and the last 12 months of T-12 income?
- Built in 1905 — when were the roof, HVAC, electrical panel, plumbing, and water heater last replaced?
- Is there a deadline driving the sale (1031 exchange, divorce, estate, relocation)? That informs how much negotiation room exists.
- The area grade is low — what's the realistic commute time and amenity access for the typical tenant pool here? Any planned neighborhood developments (good or bad) we should know about?
- What's the average days-on-market for RENTAL listings here right now (not sales)? A rising rental-DOM trend means longer vacancies and softer asking-rent achievability than the comps imply.
- What's the recent tenant-quality profile in this submarket — average credit score on applications, eviction rate, late-payment / NSF rate, and stable-employment percentage? A property-management company in the area should have these aggregated.
- How much new for-sale + rental construction is in the pipeline within 1–3 miles? Heavy new supply typically softens prices + rents 12–24 months out; constrained supply supports both.
Investment metrics
- 1% rule
- 0.67% ✗
- Cap rate
- 5.55%
- Cash-on-cash
- -2.65%
- DSCR
- 0.88
- GRM
- 12.5
CMA / ARV
No comps found within radius.
Projected returns pro-forma
7.41% appreciation · 3.0% rent growth · sell at horizon
- IRR
- 16.6%
- Equity multiple
- 2.20×
- Total profit
- $53,586
- Equity at exit
- $115,235
- IRR
- 16.1%
- Equity multiple
- 4.57×
- Total profit
- $159,991
- Equity at exit
- $222,961
Cash invested: $44,800 (down + closing). Projections, not guarantees.
Landlord ↔ Tenant lean methodology
- Overall (STATE)
- 83 Strongly Landlord-Friendly
- State Nebraska
- 83 Strongly Landlord-Friendly · R+13
- County
- — inherits STATE
- City
- — inherits STATE
ZIP-level market 69129
- Home prices YoY
- 3.9%
- Active inventory
- 1
- Price-to-rent
- 12.5×
Monthly cashflow live
- Estimated rent
- $1,067 medium interval (Pro) →
- Mortgage (P&I)
- −$839
- Tax from tax record
- −$36 /mo · $430/yr
- Insurance
- −$67
- HOA
- −$0
- Vacancy / Maint / Mgmt
- −$224
- Net cashflow
- $-99
Break-even live
UW: 25.0% down · 7.5% · 30yr · 1.5% tax · 5.0% vac · 8.0% maint · 8.0% mgmt
Financing live
Cash to close
- Down payment
- $40,000
- Closing costs
- $4,800
- Reserves months
- —
- Total cash needed
- —
Loan-product check · same deal, 3 products live
Conventional
25% down · 7.5% · 30yr
- Down + closing
- —
- Monthly P&I
- —
- Monthly cashflow
- —
- DSCR
- —
- Eligible?
- —
Personal DTI + credit; lowest rate.
DSCR
20% down · 8.5% · 30yr
- Down + closing
- —
- Monthly P&I
- —
- Monthly cashflow
- —
- DSCR
- —
- Eligible?
- —
No personal income docs; deal must DSCR.
Hard money
10% down · 12.0% · 12mo
- Down + closing
- —
- Monthly P&I
- —
- Monthly cashflow
- —
- DSCR
- —
- Eligible?
- —
Short-term bridge; refi at stabilization.
Listing history 8 events
-
2026-06-18days on market $160,000 Active 9 DOM
-
2026-06-17days on market $160,000 Active 8 DOM
-
2026-06-16days on market $160,000 Active 7 DOM
-
2026-06-15days on market $160,000 Active 6 DOM
-
2026-06-13days on market $160,000 Active 4 DOM
-
2026-06-12days on market $160,000 Active 3 DOM
-
2026-06-09remarks 695-char remark
-
2026-06-09$160,000 Active 1 DOM
ⓘ Source: listings_history table (triggers on properties + properties_extension) + one-shot
backfill from property_details.listing_events for pre-trigger history.
Tax reassessment forecast NE · Resets to sale price
- Current annual tax
- $430 · $36/mo
- Projected year-2 tax
- $2,768 · $231/mo
- Expected delta
- +$2,338/yr (+$195/mo · 543.7%)
ⓘ Screening estimate from a state-policy table — verify with the county assessor before closing.
Climate risk First Street
- Flood 1/10 Low 0% chance over 30 yrs
- Wildfire 4/10 Moderate
- Heat 3/10 Moderate 7 d/yr ≥97°F today · 18 d/yr by 30 yrs out
- Wind 2/10 Low
- Air quality 2/10 Low 1 unhealthy d/yr today · 1 by 30 yrs out
Nearby sold comps map
Loading sold comps map…
Walkable amenities ~0.75 mi
Loading nearby amenities…
Taxation est. · year 1
- Rental income
- $12,800
- − Mortgage interest
- −$8,962
- − Property taxes
- −$430
- − Insurance
- −$800
- − Repairs & maintenance
- −$1,024
- − Management
- −$1,024
- − Depreciation
- −$4,655
- Taxable loss
- −$4,095
- Est. tax savings @ 24.0%
- +$983
- After-tax cash flow
- $-204/yr
For passive investors: Depreciation is non-cash, so a rental often shows a tax loss while cash-flowing — sheltering income. Rental losses are passive: they offset passive income freely, and up to $25,000/yr can offset ordinary (W-2) income if you actively participate and your MAGI is under $100k (phasing out to $0 by $150k); unused losses carry forward. On sale, claimed depreciation is recaptured at up to 25%, and gains may owe capital-gains tax (a 1031 exchange can defer both). Figures are a year-1 estimate at your 24.0% rate — not tax advice; consult a CPA.
Schools (NCES district)
- District
- Creek Valley Schools
- NCES district ID
- 3100140
- Math proficiency
- 40% ▼ -5.00%
- Reading proficiency
- 40% ▼ -10.00%
- Median HH income
- $46,745
- Composite
- 36.61/100
- National rank
- #9261
- State rank
- #208 of 245 in NE
Livability — Chappell
- Score
- 73/100
- State rank
- #142
- US rank
- #5169
Category grades
Schools grade is shown separately in the Schools card above.
Census & demographics
- Census place
- Chappell, NE
- Population (ZIP)
- 1,241
Population outlook (Deuel County) Hauer SSP2
- Today (2025)
- 1,975 people
- By 2030
- 2,034 · +3.0%
- By 2040
- 2,193 · +11.0%
- By 2050
- 2,400 · +21.5%
- By 2075
- 3,332 · +68.7%
- By 2100
- 4,138 · +109.5%
Race, ethnicity, and origin ACS 2023
- Neighborhood character
- Predominantly White (89%)
- Race & ethnicity
- White 89% Hispanic / Latino 9% Two or more races 7%
- Hispanic origin (detail)
- Mexican 8%
- Common ancestry
- Romanian 2% Iranian 2% Portuguese 2%
- Foreign-born
- 0%
- Languages at home
- 98% English-only · Spanish 2%
Political lean MEDSL · Deuel
- 2024 margin
- Solid R (+68.4) · D 14.9% · R 83.3% · Other 1.8%
- 2008→2024 swing
- -19.1pp toward R · 2008: -49.2pp · 2024: -68.4pp
- All cycles
- 2024: R+68.4 2020: R+70.6 2016: R+70.5 2012: R+54.1 2008: R+49.2
Not yet ingested
- Civics
- —
Market trends
- HPI YoY
- ▲ 7.41%
- Current HPI
- 199.1443
- Rent YoY
- —
- Metro
- —
- State GDP YoY
- ▲ 0.68%
- F500 in state
- 2
Industry mix (Fortune 500 HQ in NE)
| Industry | F500 HQs | Revenue |
|---|---|---|
| Conglomerate | 1 | $371B |
|
||
Price history
+1393.2% since first listed4 events — show timeline
- 2026-06-09 Listed $160,000 FSBO.com
- 2021-12-07 Sold (Public Records) $70,000 Public Records
- 2019-03-05 Sold (Public Records) $28,500 Public Records
- 2004-07-20 Sold (Public Records) $10,715 Public Records
Property tax history
-1.0%/yrLatest (2025): $430 · +4.1% YoY. Source: county tax records.
Cash-flow waterfall
monthlySold comps — $/sqft
last 12 mo · ≤1 miLoading sold comps…