80 Gareth Way · King Arthur Park, MT
Flood risk 1/10 · Minimal
- FEMA flood zone
- X (unshaded)
- Chance of flooding over 30 yrs
- 0.0%
- Est. flood insurance / yr
- $507 – $1,088
Fire risk 4/10 · Minor
- Est. fire insurance / yr
- $918 – $1,706
Heat risk 2/10 · Minimal
- Hot days now (above 88°F)
- 7 days/yr
- Hot days in 30 yrs
- 17 days/yr
Wind risk 1/10 · Minimal
- Chance of severe wind over 30 yrs
- —
Air-quality risk 5/10 · Moderate
- Unhealthy air days now
- 8 days/yr
- Unhealthy air days in 30 yrs
- 8 days/yr
Risk factors via First Street. Map © Google.
Why this score? — see what drove the B grade
The composite is a weighted blend of 9 inputs, each scored 0–100. Each bar is that input's sub-score; the figure is the points it added to the 100-point composite (weight × sub-score).
- Cash flow +30.0/30.0
- 1% rule +10.0/10.0
- DSCR +10.0/10.0
- ARV discount +7.5/15.0
- Schools +5.2/10.0
- Livability +3.9/5.0
- Rent growth +2.3/5.0
- Condition / age +2.0/5.0
- Appreciation +0.0/10.0
$100,000
🖨 Deal sheet (PDF) 📄 Offer letter ✓ Due diligence
Key facts
- Fenced yard
- Private deck area
- Updated flooring
Tags
Neighborhood map
What this means for you Summary
Snapshot
- This is a 3-bed/2.0-bath other listed at $100k. Condition is rated fair.
Deal economics
- At list price, monthly cash flow is $1k ($17k/yr) — positive.
- The deal already cash-flows at list — no discount required.
- Meets the 1% rule at list price ($3k rent vs $100k).
- Recommended offer: $98k (1.5% below list) — sets the bar for market timing.
- Cap rate 23.5% vs local median 2.8% in King Arthur Park — top-decile yield for the area; either an underpriced asset or a hidden risk that comps aren't pricing in. Stress-test before assuming the spread holds.
Location & tenants
- Location reads 78/100 on livability (#18 in MT, #2,457 nationally) — a middle-class / working-renter tenant base. Strengths: crime A+, employment A+, housing A+; Watch: health & safety C-, amenities F.
- Bozeman Elementary (town): math 56% / reading 66% proficiency, ranked #7 of 116 in MT (top 6%) — acceptable for families but not a draw, mixed tenant base, ~2y average lease; only 18% free/reduced lunch — higher-income household profile.
- Zoned schools: Meadowlark Elementary (math 64% / reading 64%, grade B, #32 of 293 statewide, top 11%, 495 students, 0% FRL); Sacajawea Middle School (math 49% / reading 67%, grade B, #11 of 146 statewide, top 7%, 826 students, 0% FRL); Bozeman High School (math 50% / reading 81%, grade B, #3 of 132 statewide, top 2%, 1,280 students, 0% FRL) — zoned schools average 0% FRL vs 18% district-wide (18 pts lower); this property's tenant base skews higher-income than the district average.
- Market conditions: Rents soft (-0.6%/yr); 522 active listings in the ZIP; 6 comparable units currently listed for rent nearby; rentals at typical pace (median 23d on market — plan ~3-4 weeks tenant-placement turnaround); solid renter incomes; 1,706 units permitted in Gallatin County in 2024 (533 in 5+ unit buildings).
- This rent runs 33% of the median local income ($99k/yr) — at the standard rent-burdened threshold; future hikes will face affordability resistance.
Forward outlook
- Local home prices are declining (-3.0%/yr); year-one equity from $691 of loan paydown is wiped out by about $3k of value loss. Plan a longer hold.
- Gallatin County population projected at +61% by 2050 — long-run rental-demand tailwind backs the buy-and-hold thesis.
- At projected returns (-3.0% appreciation + 0.0% rent growth), your $28k cash investment doubles in ~2 years — after that, you're playing with house money.
Negotiation context
- It's been on market 22 days — a 2% lower offer ($98k) is reasonable based on typical stale-listing flexibility.
Questions for the listing agent
- Have any recent inspections been done? Can we get a copy of the seller's disclosures and any deferred-maintenance estimates?
- Built in 1977 — when were the roof, HVAC, electrical panel, plumbing, and water heater last replaced?
- Is there a deadline driving the sale (1031 exchange, divorce, estate, relocation)? That informs how much negotiation room exists.
- Schools are D-rated, which usually means shorter tenancies and higher turnover. Who's the typical renter profile here, and what's been the actual vacancy rate?
- What's the average days-on-market for RENTAL listings here right now (not sales)? A rising rental-DOM trend means longer vacancies and softer asking-rent achievability than the comps imply.
- What's the recent tenant-quality profile in this submarket — average credit score on applications, eviction rate, late-payment / NSF rate, and stable-employment percentage? A property-management company in the area should have these aggregated.
- How much new for-sale + rental construction is in the pipeline within 1–3 miles? Heavy new supply typically softens prices + rents 12–24 months out; constrained supply supports both.
Investment metrics
- 1% rule
- 2.69% ✓
- Cap rate
- 23.48%
- Cash-on-cash
- 61.39%
- DSCR
- 3.73
- GRM
- 3.1
CMA / ARV
No comps found within radius.
Projected returns pro-forma
-3.0% appreciation · 0.0% rent growth · sell at horizon
- IRR
- 56.8%
- Equity multiple
- 3.40×
- Total profit
- $67,193
- Equity at exit
- $14,910
- IRR
- 60.6%
- Equity multiple
- 6.20×
- Total profit
- $145,711
- Equity at exit
- $8,646
Cash invested: $28,000 (down + closing). Projections, not guarantees.
Landlord ↔ Tenant lean methodology
- Overall (STATE)
- 82 Strongly Landlord-Friendly
- State Montana
- 82 Strongly Landlord-Friendly · R+11
- County
- — inherits STATE
- City
- — inherits STATE
ZIP-level market 59718
- Rents YoY
- -0.6%
- Active inventory
- 522
- Price-to-rent
- 3.1×
Monthly cashflow live
- Estimated rent
- $2,688 high interval (Pro) →
- Mortgage (P&I)
- −$524
- Tax est. 1.5%
- −$125 /mo · $1,500/yr
- Insurance
- −$42
- HOA
- −$0
- Vacancy / Maint / Mgmt
- −$564
- Net cashflow
- $1,432
Break-even live
Sensitivity live
| Price | -10% $1,502 | -5% $1,467 | +0% $1,432 | +5% $1,398 | +10% $1,363 |
|---|---|---|---|---|---|
| Rent | -10% $1,220 | -5% $1,326 | +0% $1,432 | +5% $1,539 | +10% $1,645 |
| Rate | -1.0pp $1,483 | -0.5pp $1,458 | base $1,432 | +0.5pp $1,407 | +1.0pp $1,380 |
UW: 25.0% down · 7.5% · 30yr · 1.5% tax · 5.0% vac · 8.0% maint · 8.0% mgmt
Financing live
Cash to close
- Down payment
- $25,000
- Closing costs
- $3,000
- Reserves months
- —
- Total cash needed
- —
Loan-product check · same deal, 3 products live
Conventional
25% down · 7.5% · 30yr
- Down + closing
- —
- Monthly P&I
- —
- Monthly cashflow
- —
- DSCR
- —
- Eligible?
- —
Personal DTI + credit; lowest rate.
DSCR
20% down · 8.5% · 30yr
- Down + closing
- —
- Monthly P&I
- —
- Monthly cashflow
- —
- DSCR
- —
- Eligible?
- —
No personal income docs; deal must DSCR.
Hard money
10% down · 12.0% · 12mo
- Down + closing
- —
- Monthly P&I
- —
- Monthly cashflow
- —
- DSCR
- —
- Eligible?
- —
Short-term bridge; refi at stabilization.
Rent comps 6 comps
| Address | Beds | Baths | Sqft | Rent | $/sqft | DOM | Units | Dist |
|---|---|---|---|---|---|---|---|---|
| 5242 Fallon St Bozeman, MT | 2.0 | 1.0–2.0 | 996 | $1,862 | $1.87 | 22d | 6 | 0.87mi |
| 1620 Victory St Bozeman, MT | 3.0 | 2.0 | 1190 | $3,325 | $2.79 | 22d | 1 | 0.91mi |
| 4650 W Garfield St Bozeman, MT | 1.0–3.0 | 1.0–2.0 | 920 | $3,206 | $3.48 | 22d | 18 | 1.03mi |
| 228 S Cottonwood Rd Bozeman, MT | 2.0 | 1.0–1.5 | 1050 | $2,125 | $2.02 | 22d | 2 | 1.25mi |
| 106 S Cottonwood Rd Bozeman, MT | 2.0 | 1.0–2.0 | 909 | $1,872 | $2.06 | 22d | 11 | 1.31mi |
| 4555 Fallon St Bozeman, MT | 1.0–3.0 | 1.0–2.0 | 987 | $3,342 | $3.39 | 22d | 25 | 1.31mi |
Listing history 16 events
-
2026-06-21days on market $100,000 Active 22 DOM
-
2026-06-19days on market $100,000 Active 20 DOM
-
2026-06-18days on market $100,000 Active 19 DOM
-
2026-06-17days on market $100,000 Active 18 DOM
-
2026-06-16days on market $100,000 Active 17 DOM
-
2026-06-15days on market $100,000 Active 16 DOM
-
2026-06-14days on market $100,000 Active 14 DOM
-
2026-06-13days on market $100,000 Active 13 DOM
-
2026-06-10days on market $100,000 Active 11 DOM
-
2026-06-09days on market $100,000 Active 10 DOM
-
2026-06-08days on market $100,000 Active 9 DOM
-
2026-06-07days on market $100,000 Active 8 DOM
-
2026-06-05days on market $100,000 Active 5 DOM
-
2026-06-02days on market $100,000 Active 3 DOM
-
2026-06-01days on market $100,000 Active 2 DOM
-
2026-05-31$100,000 Active 1 DOM
ⓘ Source: listings_history table (triggers on properties + properties_extension) + one-shot
backfill from property_details.listing_events for pre-trigger history.
Climate risk First Street
- Flood 1/10 Low FEMA zone X (unshaded) · 0% chance over 30 yrs
- Wildfire 4/10 Moderate
- Heat 2/10 Low 7 d/yr ≥88°F today · 17 d/yr by 30 yrs out
- Wind 1/10 Low
- Air quality 5/10 Major 8 unhealthy d/yr today · 8 by 30 yrs out
Nearby sold comps map
Loading sold comps map…
Walkable amenities ~0.75 mi
Loading nearby amenities…
Taxation est. · year 1
- Rental income
- $32,256
- − Mortgage interest
- −$5,602
- − Property taxes
- −$1,500
- − Insurance
- −$500
- − Repairs & maintenance
- −$2,581
- − Management
- −$2,581
- − Depreciation
- −$2,909
- Taxable income
- $16,585
- Est. tax owed @ 24.0%
- −$3,980
- After-tax cash flow
- $13,209/yr
For passive investors: Depreciation is non-cash, so a rental often shows a tax loss while cash-flowing — sheltering income. Rental losses are passive: they offset passive income freely, and up to $25,000/yr can offset ordinary (W-2) income if you actively participate and your MAGI is under $100k (phasing out to $0 by $150k); unused losses carry forward. On sale, claimed depreciation is recaptured at up to 25%, and gains may owe capital-gains tax (a 1031 exchange can defer both). Figures are a year-1 estimate at your 24.0% rate — not tax advice; consult a CPA.
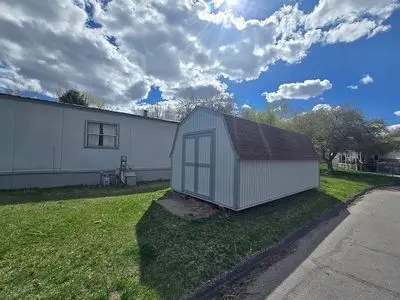
Condition & rehab AI · 1 photo
This property requires significant repairs and maintenance, including siding, roof, flooring, and interior walls. Immediate action is needed to improve its condition and value.
Repairs flagged
- Major siding — Significant wear and tear
- Major roof — Worn shingles
- Major flooring — Worn carpet
- Major interior walls — Painted walls with potential cracks
Value-add opportunities
- Both repair and replace siding — Improves curb appeal and structural integrity
- Both repair and replace roof — Prevents water damage and enhances structural integrity
- Both repair and replace flooring — Enhances comfort and aesthetic appeal
- Both paint interior walls — Enhances interior aesthetics and value
- Both replace carpet — Enhances comfort and aesthetic appeal
Renovation cost estimate screening
| Repair item | Severity | Est. cost |
|---|---|---|
| siding · Significant wear and tear | Major | $15,000–50,000 |
| roof · Worn shingles | Major | $15,000–50,000 |
| flooring · Worn carpet | Major | $15,000–50,000 |
| interior walls · Painted walls with potential cracks | Major | $15,000–50,000 |
| Total estimated repair cost · 4 items | $60,000–200,000 |
Value-add ROI direction
- Both repair and replace siding — Improves curb appeal and structural integrity ↑
- Both repair and replace roof — Prevents water damage and enhances structural integrity ↑
- Both repair and replace flooring — Enhances comfort and aesthetic appeal ↑
- Both paint interior walls — Enhances interior aesthetics and value ↑
- Both replace carpet — Enhances comfort and aesthetic appeal ↑
ⓘ Cost ranges are severity-bucket heuristics (US national rule-of-thumb). Get contractor quotes + a written scope before underwriting a rehab budget.
Schools (NCES district)
- District
- Bozeman Elementary
- NCES district ID
- 3004560
- Math proficiency
- 56% ▼ -5.00%
- Reading proficiency
- 66% ▼ -4.00%
- Median HH income
- $51,664
- Composite
- 52.03/100
- National rank
- #1635
- State rank
- #7 of 116 in MT
Livability — King Arthur Park
- Score
- 78/100
- State rank
- #18
- US rank
- #2457
Category grades
Schools grade is shown separately in the Schools card above.
Census & demographics
- Census place
- King Arthur Park, MT
- County
- Gallatin County · 108,510 people
- Metro
- Bozeman, MT
- Population (ZIP)
- 44,585
- Household income
- $99,123
- Rent vs Own
- Severe rent burden
- 1786.0
Population outlook (Gallatin County) Hauer SSP2
- Today (2025)
- 129,625 people
- By 2030
- 144,940 · +11.8%
- By 2040
- 176,266 · +36.0%
- By 2050
- 209,250 · +61.4%
- By 2075
- 294,207 · +127.0%
- By 2100
- 360,558 · +178.2%
Race, ethnicity, and origin ACS 2023
- Neighborhood character
- Predominantly White (89%)
- Race & ethnicity
- White 89% Two or more races 5% Hispanic / Latino 5% Asian 1%
- Common ancestry
- Portuguese 7% Slovak 4% Italian 3%
- Foreign-born
- 4% · Canada, China
- Languages at home
- 95% English-only · Spanish 3% Chinese 1%
Political lean MEDSL · Gallatin
- 2024 margin
- Toss-up / Even · D 50.0% · R 46.8% · Other 3.2%
- 2008→2024 swing
- -0.2pp no change · 2008: 3.4pp · 2024: 3.2pp
- All cycles
- 2024: D+3.2 2020: D+7.5 2016: D+1.0 2012: R+5.3 2008: D+3.4
Not yet ingested
- Civics
- —
Market trends
- HPI YoY
- ▼ -316.82%
- Current HPI
- 272.8072
- Rent YoY
- ▼ -0.61%
- Metro
- Bozeman, MT
- State GDP YoY
- ▲ 3.41%
- F500 in state
- 2
Industry mix (Fortune 500 HQ in MT)
| Industry | F500 HQs | Revenue |
|---|---|---|
| Technology / Analytics | 1 | $2B |
|
||
Price history
1 event — show timeline
- 2026-05-31 Listed $100,000 FSBO.com
Cash-flow waterfall
monthlySold comps — $/sqft
last 12 mo · ≤1 miLoading sold comps…