 Multi-family
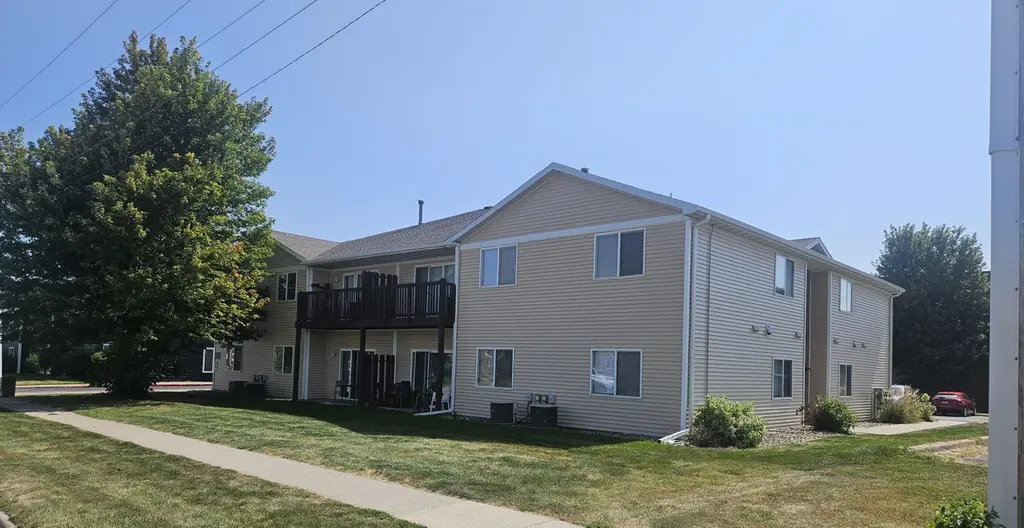
4524 Steinbeck St · Ames, IA
Flood risk 1/10 · Minimal
- FEMA flood zone
- X (unshaded)
- Chance of flooding over 30 yrs
- 0.0%
- Est. flood insurance / yr
- $507 – $1,088
Fire risk 4/10 · Minor
- Est. fire insurance / yr
- $902 – $1,676
Heat risk 3/10 · Minor
- Hot days now (above 102°F)
- 7 days/yr
- Hot days in 30 yrs
- 15 days/yr
Wind risk 2/10 · Minimal
- Chance of severe wind over 30 yrs
- —
Air-quality risk 1/10 · Minimal
- Unhealthy air days now
- 0 days/yr
- Unhealthy air days in 30 yrs
- 0 days/yr
Risk factors via First Street. Map © Google.
Why this score? — see what drove the D grade
The composite is a weighted blend of 9 inputs, each scored 0–100. Each bar is that input's sub-score; the figure is the points it added to the 100-point composite (weight × sub-score).
- Cash flow +11.5/30.0
- ARV discount +6.3/15.0
- Schools +5.9/10.0
- Livability +4.7/5.0
- Condition / age +3.8/5.0
- DSCR +3.4/10.0
- Rent growth +3.4/5.0
- 1% rule +3.3/10.0
- Appreciation +0.0/10.0
$1,200,000
🖨 Deal sheet (PDF) 📄 Offer letter ✓ Due diligence
Multi-family units
County records classify this as Multi-Family (5+ Unit). Listing-text estimate: 1 unit. estimate disagrees with records
5+ unit building — per-unit beds/baths from public records are typically unavailable; the breakdown below (if shown) is an estimate from the listing text.
Listing remarks MLS
Modern & Spacious 8-Plex in West Ames. Outstanding investment opportunity in West Ames! This well-maintained 8-plex features eight 3-bedroom, 2-bathroom units, each offering a spacious and functional layout. Lower-level units include patios, while upper-level units feature decks and vaulted ceilings, adding a sense of openness. All units are equipped with in-unit laundry for added tenant convenience and appeal. Recent updates in 2024 include a new roof and siding, along with select window, sliding door, and A/C unit replacements reducing future maintenance needs and enhancing property value. Located in a desirable rental area with strong demand, this property is a solid addition to any investment portfolio.
Key facts
- New siding
- In unit laundry
- Well maintained
Tags
Neighborhood map
What this means for you Summary
Snapshot
- This is a multifamily listed at $1.20M. Condition is rated good.
Deal economics
- At list price, monthly cash flow is $-395 ($-5k/yr) — negative.
- To cash-flow at today's rent, offer at most $1.14M (4.8% below list).
- To meet the 1% rule (rent ≥ 1% of price), the offer needs to be $1000k (16.7% below list).
- Recommended offer: $1000k (16.7% below list) — sets the bar for 1% rule.
- Cap rate 5.9% vs local median 2.2% in Ames — top-decile yield for the area; either an underpriced asset or a hidden risk that comps aren't pricing in. Stress-test before assuming the spread holds.
Location & tenants
- Location reads 93/100 on livability (#2 in IA, #21 nationally) — a professional / high-income tenant draw. Strengths: amenities A+, commute A+, cost of living A+; Watch: employment C-.
- Ames Community School District (urban): math 70% / reading 72% proficiency, ranked #147 of 289 in IA (top 51%) — strong family-tenant draw, lease renewals of 3-5y typical.
- Zoned schools: Edwards Elementary School (math 72% / reading 67%, grade A-, #224 of 616 statewide, top 42%, 450 students, 38% FRL); Ames Middle School (math 71% / reading 70%, grade A, #111 of 246 statewide, top 45%, 1,002 students, 31% FRL); Ames High School (math 69% / reading 77%, grade B+, #114 of 336 statewide, top 34%, 1,403 students, 30% FRL).
- Market conditions: Rents rising (+3.7%/yr); 199 active listings in the ZIP; 196 units permitted in Story County in 2024 (34 in 5+ unit buildings).
- At $9,998/mo this rent would consume 198% of the median local household income ($61k/yr) (locally 2646% of renters already pay >50% of income on rent) — very limited rent-growth headroom before tenants either downsize or default.
Forward outlook
- Local home prices are declining (-3.0%/yr); year-one equity from $8k of loan paydown is wiped out by about $36k of value loss. Plan a longer hold.
- Story County population projected at +54% by 2050 — long-run rental-demand tailwind backs the buy-and-hold thesis.
Negotiation context
- It's been on market 261 days — a 12% lower offer ($1.06M) is reasonable based on typical stale-listing flexibility.
- 4 sale attempts since 2y ago with the ask held roughly flat each time — persistent listings suggest the price (not the market) is what's stuck; bring a comps-based counter.
Questions for the listing agent
- What do current leases actually rent for vs. the listed asking? Can we see a recent rent roll and the last 12 months of T-12 income?
- It's been on market 261 days. Have you received any prior offers? Is the seller open to a 17% concession, seller financing, or rate buy-down credit?
- Why hasn't it sold? Are there any deal-killer items the seller is aware of (foundation, flood, title, zoning, code violations)?
- Is there a deadline driving the sale (1031 exchange, divorce, estate, relocation)? That informs how much negotiation room exists.
- Schools are A-rated — typically a magnet for longer-tenancy family renters. What's the average tenant stay here, and is there a school-zone premium baked into asking?
- The area grade is low — what's the realistic commute time and amenity access for the typical tenant pool here? Any planned neighborhood developments (good or bad) we should know about?
- What's the average days-on-market for RENTAL listings here right now (not sales)? A rising rental-DOM trend means longer vacancies and softer asking-rent achievability than the comps imply.
- What's the recent tenant-quality profile in this submarket — average credit score on applications, eviction rate, late-payment / NSF rate, and stable-employment percentage? A property-management company in the area should have these aggregated.
- How much new apartment / multifamily construction is in the pipeline within 1–3 miles? Heavy new supply (>2% of stock underway) typically softens rents 12–24 months out; light construction supports rent growth.
Investment metrics
- 1% rule
- 0.83% ✗
- Cap rate
- 5.90%
- Cash-on-cash
- -1.41%
- DSCR
- 0.94
- GRM
- 10.0
CMA / ARV
- ARV (median comp)
- $1,168,924
- List price
- $1,200,000
- Delta
- 2.66%
- Verdict
- FAIR
- Comps
- 1 within 2.0 mi
Projected returns pro-forma
-3.0% appreciation · 3.67% rent growth · sell at horizon
- IRR
- -17.9%
- Equity multiple
- 0.37×
- Total profit
- $-212,643
- Equity at exit
- $178,924
- IRR
- -8.8%
- Equity multiple
- 0.44×
- Total profit
- $-188,684
- Equity at exit
- $103,754
Cash invested: $336,000 (down + closing). Projections, not guarantees.
Landlord ↔ Tenant lean methodology
- Overall (STATE)
- 83 Strongly Landlord-Friendly
- State Iowa
- 83 Strongly Landlord-Friendly · R+6
- County
- — inherits STATE
- City
- — inherits STATE
ZIP-level market 50014
- Rents YoY
- 3.7%
- Active inventory
- 199
- Price-to-rent
- 80.0×
Monthly cashflow live
- Estimated rent
- $9,998 high interval (Pro) →
- Mortgage (P&I)
- −$6,293
- Tax est. 1.5%
- −$1,500 /mo · $18,000/yr
- Insurance
- −$500
- HOA
- −$0
- Vacancy / Maint / Mgmt
- −$2,100
- Net cashflow
- $-395
Break-even live
Sensitivity live
| Price | -10% $435 | -5% $20 | +0% $-395 | +5% $-809 | +10% $-1,224 |
|---|---|---|---|---|---|
| Rent | -10% $-1,184 | -5% $-789 | +0% $-395 | +5% $0 | +10% $395 |
| Rate | -1.0pp $210 | -0.5pp $-89 | base $-395 | +0.5pp $-705 | +1.0pp $-1,022 |
8-unit breakdown (identical units grouped — click to expand)
| Units | Beds | Baths | Est. rent |
|---|---|---|---|
| 8× units | 3 | 2 | $10,000 |
| #1 | 3 | 2 | $1,250 |
| #2 | 3 | 2 | $1,250 |
| #3 | 3 | 2 | $1,250 |
| #4 | 3 | 2 | $1,250 |
| #5 | 3 | 2 | $1,250 |
| #6 | 3 | 2 | $1,250 |
| #7 | 3 | 2 | $1,250 |
| #8 | 3 | 2 | $1,250 |
| Total (8 units) | $9,998 | ||
UW: 25.0% down · 7.5% · 30yr · 1.5% tax · 5.0% vac · 8.0% maint · 8.0% mgmt
Financing live
Cash to close
- Down payment
- $300,000
- Closing costs
- $36,000
- Reserves months
- —
- Total cash needed
- —
Loan-product check · same deal, 3 products live
Conventional
25% down · 7.5% · 30yr
- Down + closing
- —
- Monthly P&I
- —
- Monthly cashflow
- —
- DSCR
- —
- Eligible?
- —
Personal DTI + credit; lowest rate.
DSCR
20% down · 8.5% · 30yr
- Down + closing
- —
- Monthly P&I
- —
- Monthly cashflow
- —
- DSCR
- —
- Eligible?
- —
No personal income docs; deal must DSCR.
Hard money
10% down · 12.0% · 12mo
- Down + closing
- —
- Monthly P&I
- —
- Monthly cashflow
- —
- DSCR
- —
- Eligible?
- —
Short-term bridge; refi at stabilization.
Listing history 10 events
-
2026-05-31days on market $1,200,000 Active 261 DOM
-
2026-05-30days on market $1,200,000 Active 260 DOM
-
2025-09-11$1,200,000 Active 722-char remark
Show marketing remark (722 chars)
Modern & Spacious 8-Plex in West Ames. Outstanding investment opportunity in West Ames! This well-maintained 8-plex features eight 3-bedroom, 2-bathroom units, each offering a spacious and functional layout. Lower-level units include patios, while upper-level units feature decks and vaulted ceilings, adding a sense of openness. All units are equipped with in-unit laundry for added tenant convenience and appeal. Recent updates in 2024 include a new roof and siding, along with select window, sliding door, and A/C unit replacements reducing future maintenance needs and enhancing property value. Located in a desirable rental area with strong demand, this property is a solid addition to any investment portfolio.
-
2024-08-07historical $1,100
-
2024-07-30$1,100
-
2024-04-10historical $1,100
-
2024-03-30price $1,100
-
2024-03-27historical $1,200
-
2024-03-24$1,200
-
2024-03-13$1,200
ⓘ Source: listings_history table (triggers on properties + properties_extension) + one-shot
backfill from property_details.listing_events for pre-trigger history.
Climate risk First Street
- Flood 1/10 Low FEMA zone X (unshaded) · 0% chance over 30 yrs
- Wildfire 4/10 Moderate
- Heat 3/10 Moderate 7 d/yr ≥102°F today · 15 d/yr by 30 yrs out
- Wind 2/10 Low
- Air quality 1/10 Low 0 unhealthy d/yr today · 0 by 30 yrs out
Nearby sold comps map
Loading sold comps map…
Walkable amenities ~0.75 mi
Loading nearby amenities…
Taxation est. · year 1
- Rental income
- $119,976
- − Mortgage interest
- −$67,219
- − Property taxes
- −$18,000
- − Insurance
- −$6,000
- − Repairs & maintenance
- −$9,598
- − Management
- −$9,598
- − Depreciation
- −$34,909
- Taxable loss
- −$25,348
- Est. tax savings @ 24.0%
- +$6,083
- After-tax cash flow
- $1,349/yr
For passive investors: Depreciation is non-cash, so a rental often shows a tax loss while cash-flowing — sheltering income. Rental losses are passive: they offset passive income freely, and up to $25,000/yr can offset ordinary (W-2) income if you actively participate and your MAGI is under $100k (phasing out to $0 by $150k); unused losses carry forward. On sale, claimed depreciation is recaptured at up to 25%, and gains may owe capital-gains tax (a 1031 exchange can defer both). Figures are a year-1 estimate at your 24.0% rate — not tax advice; consult a CPA.
Condition & rehab AI · 3 photos
This 8-plex in West Ames is in good condition with recent updates, including a new roof and siding. It offers spacious units with in-unit laundry and is located in a desirable rental area with strong demand. Potential buyers and renters will appreciate the recent updates and the property's curb appeal.
Value-add opportunities
- Both Painting the exterior and interior — Fresh paint can enhance the curb appeal and interior aesthetics, making the property more attractive to both buyers and renters.
- Both Landscaping improvements — Enhancing the landscaping can improve the property's curb appeal and make it more inviting for potential tenants and buyers.
- Both Updating the HVAC system — A modern and efficient HVAC system can improve comfort and energy efficiency, making the property more attractive to tenants and buyers.
- Both Upgrading the kitchen and bathrooms — Modernizing the kitchen and bathrooms can significantly increase the property's value and appeal to both buyers and renters.
Renovation cost estimate screening
Value-add ROI direction
- Both Painting the exterior and interior — Fresh paint can enhance the curb appeal and interior aesthetics, making the property more attractive to both buyers and renters. ↑
- Both Landscaping improvements — Enhancing the landscaping can improve the property's curb appeal and make it more inviting for potential tenants and buyers. ↑
- Both Updating the HVAC system — A modern and efficient HVAC system can improve comfort and energy efficiency, making the property more attractive to tenants and buyers. ↑
- Both Upgrading the kitchen and bathrooms — Modernizing the kitchen and bathrooms can significantly increase the property's value and appeal to both buyers and renters. ↑
ⓘ Cost ranges are severity-bucket heuristics (US national rule-of-thumb). Get contractor quotes + a written scope before underwriting a rehab budget.
Schools (NCES district)
- District
- Ames Community School District
- NCES district ID
- 1903540
- Math proficiency
- 70% ▼ -5.00%
- Reading proficiency
- 72% ▼ -1.00%
- Median HH income
- $39,790
- Composite
- 59.22/100
- National rank
- #941
- State rank
- #147 of 289 in IA
Livability — Ames
- Score
- 93/100
- State rank
- #2
- US rank
- #21
Category grades
Schools grade is shown separately in the Schools card above.
Census & demographics
- Census place
- Ames, IA
- County
- Story County · 66,757 people
- City population
- 66,757
- Metro
- Ames, IA
- Population (ZIP)
- 32,958
- Household income
- $60,731
- Rent vs Own
- Severe rent burden
- 2646.0
Population outlook (Story County) Hauer SSP2
- Today (2025)
- 115,493 people
- By 2030
- 126,820 · +9.8%
- By 2040
- 150,771 · +30.5%
- By 2050
- 177,915 · +54.0%
- By 2075
- 255,370 · +121.1%
- By 2100
- 316,429 · +174.0%
Race, ethnicity, and origin ACS 2023
- Neighborhood character
- Predominantly White (76%)
- Race & ethnicity
- White 76% Asian 12% Two or more races 5% Black 3% Hispanic / Latino 3%
- Common ancestry
- Portuguese 6% Romanian 2% Iranian 2%
- Foreign-born
- 13% · China, Canada, South Korea
- Languages at home
- 84% English-only · Other Indo-European 4% Other Asian/Pacific 2% Korean 2%
Political lean MEDSL · Story
- 2024 margin
- D (+10.4) · D 54.4% · R 44.0% · Other 1.6%
- 2008→2024 swing
- -5.8pp toward R · 2008: 16.2pp · 2024: 10.4pp
- All cycles
- 2024: D+10.4 2020: D+17.3 2016: D+12.2 2012: D+13.7 2008: D+16.2
Not yet ingested
- Civics
- —
Market trends
- HPI YoY
- ▼ -113.94%
- Current HPI
- 174.8142
- Rent YoY
- ▲ 3.67%
- Metro
- Ames, IA
- State GDP YoY
- ▲ 2.48%
- F500 in state
- 4
Industry mix (Fortune 500 HQ in IA)
| Industry | F500 HQs | Revenue |
|---|---|---|
| Financial Services | 1 | $16B |
|
||
| Retail / Convenience | 1 | $15B |
|
||
Price history
+99900.0% since first listed8 events — show timeline
- 2025-09-11 Listed $1,200,000 CIBOR
- 2024-08-07 Rental Removed $1,100 RENT.
- 2024-07-30 Listed for Rent $1,100 RENT.
- 2024-04-10 Rental Removed $1,100 APPFOLIO
- 2024-03-30 Price Changed $1,100 APPFOLIO
- 2024-03-27 Rental Removed $1,200 APPFOLIO
- 2024-03-24 Listed for Rent $1,200 APPFOLIO
- 2024-03-13 Listed for Rent $1,200 APPFOLIO
Cash-flow waterfall
monthlySold comps — $/sqft
last 12 mo · ≤1 miLoading sold comps…