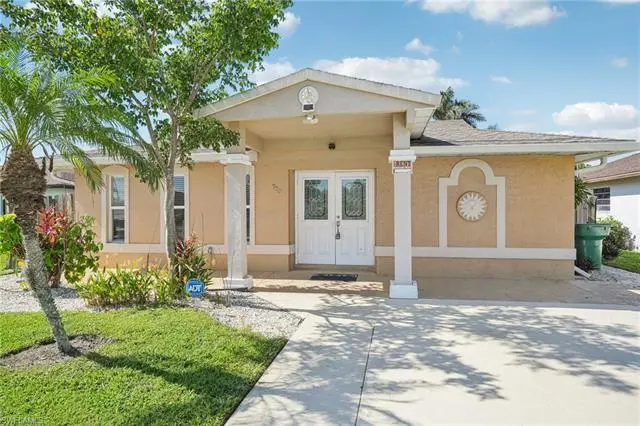
770 93rd Ave N · Naples Park, FL
Flood risk 6/10 · Moderate
- FEMA flood zone
- X (shaded)
- Chance of flooding over 30 yrs
- 0.57%
- Est. flood insurance / yr
- $507 – $1,088
Fire risk 1/10 · Minimal
- Est. fire insurance / yr
- $947 – $1,759
Heat risk 10/10 · Severe
- Hot days now (above 107°F)
- 7 days/yr
- Hot days in 30 yrs
- 31 days/yr
Wind risk 10/10 · Severe
- Chance of severe wind over 30 yrs
- 99.0%
Air-quality risk 2/10 · Minimal
- Unhealthy air days now
- 1 days/yr
- Unhealthy air days in 30 yrs
- 1 days/yr
Risk factors via First Street. Map © Google.
Why this score? — see what drove the C- grade
The composite is a weighted blend of 9 inputs, each scored 0–100. Each bar is that input's sub-score; the figure is the points it added to the 100-point composite (weight × sub-score).
- Cash flow +18.3/30.0
- ARV discount +7.5/15.0
- DSCR +5.8/10.0
- Schools +5.0/10.0
- Rent growth +4.7/5.0
- 1% rule +4.0/10.0
- Livability +3.2/5.0
- Condition / age +2.5/5.0
- Appreciation +0.0/10.0
$825,000
🖨 Deal sheet 📄 Offer letter ✓ Due diligence
Listing remarks
Here is the updated version incorporating the fully fenced yard and ADT system: Prime opportunity in the highly sought-after Naples Park neMercatoood just minutes from Vanderbilt Beach and Delnor-Wiggins Pass State Park. This beautifully updated turnkey 5-bedroom, 2-bath residence offers exceptional value in one of Naples’ fastest-growing coastal communities. Designed for both comfort and entertaining, the home features tile flooring throughout and a fully upgraded kitchen with modern finishes. Multiple sliding glass doors enhance the indoor-outdoor living experience, including direct access from two bedrooms to the pool deck and an additional kitchen sliding door leading to the spac
Key facts
- Investment property
- Vanderbilt beach
- 8,712 sq ft lot
Tags
Property features AI
Finance
- Other: No RV allowed (restriction); Lot is approximately 0.20 acres (regular lot); Irrigation: central; View: see remarks
- Financial info: No investor or income/expense details provided
- HOA & community: No HOA maintenance or amenities; Non-gated community
Exterior
- Parking: No parking details provided
- Security: Security system
- Utilities: Central water; Central sewer; Cable available
- Home design: Single-family residential; 1 story ranch; Rear exposure faces south
- Construction: Concrete block construction; Stucco exterior; Shingle roof; Built in 1977
- Exterior features: Private below-ground pool; Fence; Impact resistant windows
Interior
- Kitchen: Electric cooktop; Dishwasher; Disposal; Microwave; Refrigerator/Freezer; Pantry
- Bedrooms: 5 bedrooms
- Flooring: Tile flooring
- Bathrooms: Master bathroom with separate tub and shower; 2 full bathrooms
- Heating & cooling: Central electric heat; Central electric cooling
- Interior features: Pantry; Dining area open to family room; Screened lanai/porch; Security system; Furnished
- Laundry & utility: Washer; Dryer; Laundry in residence
Neighborhood map
What this means for you Summary
Snapshot
- This is a 5-bed/2.0-bath single-family listed at $825k.
Deal economics
- At list price, monthly cash flow is $761 ($9k/yr) — positive.
- The deal already cash-flows at list — no discount required.
- To meet the 1% rule (rent ≥ 1% of price), the offer needs to be $740k (10.4% below list).
- Recommended offer: $740k (10.4% below list) — sets the bar for 1% rule.
Location & tenants
- Location reads 64/100 on livability (#696 in FL) — a middle-class / working-renter tenant base. Strengths: crime A+, housing A-, employment B+; Watch: health & safety D, schools F, amenities F.
- Collier (suburban): math 60% / reading 56% proficiency, ranked #16 of 73 in FL (top 22%) — acceptable for families but not a draw, mixed tenant base, ~2y average lease.
- Market conditions: Rents rising fast (+8.7%/yr); 679 active listings in the ZIP; 20 comparable units currently listed for rent nearby; rentals at typical pace (median 24d on market — plan ~3-4 weeks tenant-placement turnaround); high-income renter base; 3,520 units permitted in Collier County in 2024 (959 in 5+ unit buildings).
- At $7,396/mo this rent would consume 74% of the median local household income ($119k/yr) (locally 237% of renters already pay >50% of income on rent) — very limited rent-growth headroom before tenants either downsize or default.
Forward outlook
- Local home prices are declining (-3.0%/yr); year-one equity from $6k of loan paydown is wiped out by about $25k of value loss. Plan a longer hold.
- Collier County population projected at +30% by 2050 — long-run rental-demand tailwind backs the buy-and-hold thesis.
- At projected returns (-3.0% appreciation + 8.0% rent growth), your $231k cash investment doubles in ~10 years — after that, you're playing with house money.
Negotiation context
- It's been on market 77 days — a 6% lower offer ($776k) is reasonable based on typical stale-listing flexibility.
- 7 sale attempts since 16y ago; this cycle's ask has dropped $134k (14%) from the opening price — seller is motivated, your offer sets the floor, not the list.
- Current owner paid $177k; list at $825k implies a 366% gain — meaningful room to come down on a strong offer.
Risks & watch-outs
- Climate carrying-cost: major flood risk; severe wind risk, 99% chance of damaging wind over 30y; extreme-heat days projected 7→31/yr by 2055 (HVAC capex compounding) — expect insurance premiums to compound above CPI over the hold.
Questions for the listing agent
- It's been on market 77 days. Have you received any prior offers? Is the seller open to a 10% concession, seller financing, or rate buy-down credit?
- Built in 1977 — when were the roof, HVAC, electrical panel, plumbing, and water heater last replaced?
- Why hasn't it sold? Are there any deal-killer items the seller is aware of (foundation, flood, title, zoning, code violations)?
- Is there a deadline driving the sale (1031 exchange, divorce, estate, relocation)? That informs how much negotiation room exists.
- Schools are F-rated, which usually means shorter tenancies and higher turnover. Who's the typical renter profile here, and what's been the actual vacancy rate?
- What's the average days-on-market for RENTAL listings here right now (not sales)? A rising rental-DOM trend means longer vacancies and softer asking-rent achievability than the comps imply.
- What's the recent tenant-quality profile in this submarket — average credit score on applications, eviction rate, late-payment / NSF rate, and stable-employment percentage? A property-management company in the area should have these aggregated.
- How much new for-sale + rental construction is in the pipeline within 1–3 miles? Heavy new supply typically softens prices + rents 12–24 months out; constrained supply supports both.
Investment metrics
- 1% rule
- 0.90% ✗
- Cap rate
- 7.40%
- Cash-on-cash
- 3.95%
- DSCR
- 1.18
- GRM
- 9.3
CMA / ARV
No comps found within radius.
Projected returns pro-forma
-3.0% appreciation · 8.0% rent growth · sell at horizon
- IRR
- -5.2%
- Equity multiple
- 0.80×
- Total profit
- $-46,421
- Equity at exit
- $123,010
- IRR
- 9.3%
- Equity multiple
- 1.86×
- Total profit
- $198,767
- Equity at exit
- $71,331
Cash invested: $231,000 (down + closing). Projections, not guarantees.
Landlord ↔ Tenant lean methodology
- Overall (STATE)
- 87 Strongly Landlord-Friendly
- State Florida
- 87 Strongly Landlord-Friendly · R+3
- County
- — inherits STATE
- City
- — inherits STATE
ZIP-level market 34108
- Rents YoY
- 8.7%
- Active inventory
- 679
- Price-to-rent
- 9.3×
Monthly cashflow live
- Estimated rent
- $7,396 medium interval (Pro) →
- Mortgage (P&I)
- −$4,326
- Tax from tax record
- −$412 /mo · $4,945/yr
- Insurance
- −$344
- HOA
- −$0
- Vacancy / Maint / Mgmt
- −$1,553
- Net cashflow
- $761
Break-even live
UW: 25.0% down · 7.5% · 30yr · 1.5% tax · 5.0% vac · 8.0% maint · 8.0% mgmt
Financing live
Cash to close
- Down payment
- $206,250
- Closing costs
- $24,750
- Reserves months
- —
- Total cash needed
- —
Loan-product check · same deal, 3 products live
Conventional
25% down · 7.5% · 30yr
- Down + closing
- —
- Monthly P&I
- —
- Monthly cashflow
- —
- DSCR
- —
- Eligible?
- —
Personal DTI + credit; lowest rate.
DSCR
20% down · 8.5% · 30yr
- Down + closing
- —
- Monthly P&I
- —
- Monthly cashflow
- —
- DSCR
- —
- Eligible?
- —
No personal income docs; deal must DSCR.
Hard money
10% down · 12.0% · 12mo
- Down + closing
- —
- Monthly P&I
- —
- Monthly cashflow
- —
- DSCR
- —
- Eligible?
- —
Short-term bridge; refi at stabilization.
Rent comps 20 comps
| Address | Beds | Baths | Sqft | Rent | $/sqft | DOM | Units | Dist |
|---|---|---|---|---|---|---|---|---|
| 819 91st Ave N Naples, FL | 4.0 | 4.0 | 1926 | $25,000 | $12.98 | 23d | 1 | 0.15mi |
| 837 91st Ave N Naples, FL | 4.0 | 3.0 | 2200 | $5,500 | $2.50 | 23d | 1 | 0.19mi |
| 837 99th Ave N Naples, FL | 4.0 | 3.0 | 2100 | $18,000 | $8.57 | 23d | 1 | 0.43mi |
| 551 91st Ave N Unit 1504170P Naples, FL | 4.0 | 2.0 | 1679 | $8,133 | $4.84 | 23d | 1 | 0.57mi |
| 670 101st Ave N Naples, FL | 4.0 | 3.0 | 2208 | $15,000 | $6.79 | 23d | 1 | 0.57mi |
| 551 97th Ave N Naples, FL | 4.0 | 3.0 | 2090 | $20,000 | $9.57 | 13d | 1 | 0.63mi |
| 575 101st Ave N Naples, FL | 4.0 | 2.0 | 1800 | $12,500 | $6.94 | 23d | 1 | 0.74mi |
| 645 103rd Ave N Unit 1534775P Naples, FL | 4.0 | 2.0 | 1840 | $8,513 | $4.63 | 21d | 1 | 0.74mi |
| 822 105th Ave N Naples, FL | 4.0 | 3.0 | 2200 | $19,000 | $8.64 | 23d | 1 | 0.74mi |
| 693 105th Ave N Naples, FL | 4.0 | 3.0 | 2014 | $10,500 | $5.21 | 23d | 1 | 0.81mi |
| 630 105th Ave N Naples, FL | 4.0 | 2.0 | 2119 | $3,950 | $1.86 | 23d | 1 | 0.83mi |
| 698 107th Ave N Naples, FL | 4.0 | 3.0 | 1487 | $3,800 | $2.56 | 23d | 1 | 0.89mi |
| 523 103rd Ave N Naples, FL | 4.0 | 2.5 | 1974 | $5,200 | $2.63 | 23d | 1 | 0.91mi |
| 685 107th Ave N Unit 1504184P Naples, FL | 4.0 | 3.0 | 2238 | $8,819 | $3.94 | 21d | 1 | 0.93mi |
| 625 107th Ave N Unit 1534807P Naples, FL | 4.0 | 2.5 | 2012 | $8,779 | $4.36 | 23d | 1 | 0.98mi |
| 734 109th Ave N Naples, FL | 5.0 | 3.0 | 2208 | $23,000 | $10.42 | 23d | 1 | 0.99mi |
| 828 110th Ave N Unit 1504175P Naples, FL | 4.0 | 4.0 | 2152 | $11,370 | $5.28 | 21d | 1 | 1.05mi |
| 510 106th Ave N Unit 1387169P Naples, FL | 4.0 | 2.0 | 1646 | $7,553 | $4.59 | 13d | 1 | 1.05mi |
| 663 110th Ave N Naples, FL | 4.0 | 3.0 | 1936 | $8,500 | $4.39 | 23d | 1 | 1.13mi |
| 610 111th Ave N Unit 1534774P Naples, FL | 4.0 | 2.5 | 1905 | $6,664 | $3.50 | 13d | 1 | 1.19mi |
Listing history 39 events
-
2026-06-18days on market $825,000 Active 77 DOM
-
2026-06-17days on market $825,000 Active 76 DOM
-
2026-06-16days on market $825,000 Active 75 DOM
-
2026-06-15days on market $825,000 Active 74 DOM
-
2026-06-14days on market $825,000 Active 72 DOM
-
2026-06-10days on market $825,000 Active 69 DOM
-
2026-06-09days on market $825,000 Active 68 DOM
-
2026-06-08days on market $825,000 Active 67 DOM
-
2026-06-07days on market $825,000 Active 66 DOM
-
2026-06-03days on market $825,000 Active 62 DOM
-
2026-06-02days on market $825,000 Active 61 DOM
-
2026-06-01days on market $825,000 Active 60 DOM
-
2026-06-01price $825,000 Active 59 DOM
-
2026-05-31days on market $959,000 Active 59 DOM
-
2026-05-30days on market $959,000 Active 58 DOM
-
2026-04-02$959,000 Active
-
2026-02-28historical
-
2025-10-09price $900,000
-
2025-06-23$999,000 Active
-
2025-06-16historical
-
2025-05-07price $1,050,000
-
2025-02-05price $1,140,000
-
2024-12-27price $1,190,000
-
2024-12-17$1,100,000 Active
-
2020-11-23historical
-
2020-09-16price $549,900
-
2020-09-01price $595,000
-
2020-08-26price $486,000
-
2020-08-17status Active
-
2020-08-11status Pending With Contingencies
-
2020-08-05status Active
-
2020-07-31historical
-
2020-07-18price $485,000
-
2020-03-19price $499,900
-
2020-01-29price $524,000
-
2020-01-18$529,000 Active
-
2010-08-06soldstatus $177,000
-
2010-06-21$183,900
-
1996-03-28soldstatus $115,000
ⓘ Source: listings_history table (triggers on properties + properties_extension) + one-shot
backfill from property_details.listing_events for pre-trigger history.
Tax reassessment forecast FL · Resets to sale price
- Current annual tax
- $4,945 · $412/mo
- Projected year-2 tax
- $6,848 · $571/mo
- Expected delta
- +$1,903/yr (+$159/mo · 38.5%)
ⓘ Screening estimate from a state-policy table — verify with the county assessor before closing.
Climate risk First Street
- Flood 6/10 Major FEMA zone X (shaded) · 57% chance over 30 yrs
- Wildfire 1/10 Low
- Heat 10/10 Extreme 7 d/yr ≥107°F today · 31 d/yr by 30 yrs out
- Wind 10/10 Extreme 99% chance of damaging wind over 30 yrs
- Air quality 2/10 Low 1 unhealthy d/yr today · 1 by 30 yrs out
Nearby sold comps map
Loading sold comps map…
Walkable amenities ~0.75 mi
Loading nearby amenities…
Taxation est. · year 1
- Rental income
- $88,752
- − Mortgage interest
- −$46,213
- − Property taxes
- −$4,945
- − Insurance
- −$4,125
- − Repairs & maintenance
- −$7,100
- − Management
- −$7,100
- − Depreciation
- −$24,000
- Taxable loss
- −$4,730
- Est. tax savings @ 24.0%
- +$1,135
- After-tax cash flow
- $10,263/yr
For passive investors: Depreciation is non-cash, so a rental often shows a tax loss while cash-flowing — sheltering income. Rental losses are passive: they offset passive income freely, and up to $25,000/yr can offset ordinary (W-2) income if you actively participate and your MAGI is under $100k (phasing out to $0 by $150k); unused losses carry forward. On sale, claimed depreciation is recaptured at up to 25%, and gains may owe capital-gains tax (a 1031 exchange can defer both). Figures are a year-1 estimate at your 24.0% rate — not tax advice; consult a CPA.
Schools (NCES district)
- District
- Collier
- NCES district ID
- 1200330
- Math proficiency
- 60% ▼ -4.00%
- Reading proficiency
- 56% ▼ -2.00%
- Median HH income
- $58,275
- Composite
- 50.23/100
- National rank
- #1892
- State rank
- #16 of 73 in FL
Livability — Naples Park
- Score
- 64/100
- State rank
- #696
- US rank
- #14564
Category grades
Schools grade is shown separately in the Schools card above.
Census & demographics
- Census place
- Naples Park, FL
- County
- Collier County · 396,295 people
- Metro
- Naples-Marco Island, FL
- Population (ZIP)
- 16,237
- Household income
- $119,212
- Rent vs Own
- Severe rent burden
- 237.0
Population outlook (Collier County) Hauer SSP2
- Today (2025)
- 420,858 people
- By 2030
- 450,054 · +6.9%
- By 2040
- 502,232 · +19.3%
- By 2050
- 544,932 · +29.5%
- By 2075
- 627,203 · +49.0%
- By 2100
- 659,015 · +56.6%
Race, ethnicity, and origin ACS 2023
- Neighborhood character
- Predominantly White (87%)
- Race & ethnicity
- White 87% Hispanic / Latino 8% Two or more races 7% Asian 1% Black 1%
- Hispanic origin (detail)
- Mexican 2% Cuban 3%
- Common ancestry
- Romanian 5% Lithuanian 3% Slovak 3%
- Foreign-born
- 16% · Canada, Dominican Republic, South Korea
- Languages at home
- 86% English-only · Spanish 6% Russian/Polish/Slavic 2% Other Indo-European 2%
Political lean MEDSL · Collier
- 2024 margin
- Solid R (+33.1) · D 33.1% · R 66.2%
- 2008→2024 swing
- -10.6pp toward R · 2008: -22.5pp · 2024: -33.1pp
- All cycles
- 2024: R+33.1 2020: R+24.7 2016: R+26.0 2012: R+30.1 2008: R+22.5
Not yet ingested
- Civics
- —
Market trends
- HPI YoY
- ▼ -587.97%
- Current HPI
- 275.1872
- Rent YoY
- ▲ 8.74%
- Metro
- Naples-Marco Island, FL
- State GDP YoY
- ▲ 3.28%
- F500 in state
- 36
Industry mix (Fortune 500 HQ in FL)
| Industry | F500 HQs | Revenue |
|---|---|---|
| Industrial Technology | 2 | $29B |
|
||
| Insurance | 2 | $17B |
|
||
| Retail | 1 | $60B |
|
||
| Technology Distribution | 1 | $58B |
|
||
| Homebuilding | 1 | $35B |
|
||
| Technology Manufacturing | 1 | $35B |
|
||
Price history
+733.9% since first listed24 events — show timeline
- 2026-04-02 Listed $959,000 NAPLESMLS
- 2026-02-28 Listing Removed — NAPLESMLS
- 2025-10-09 Price Changed $900,000 NAPLESMLS
- 2025-06-23 Listed $999,000 NAPLESMLS
- 2025-06-16 Listing Removed — NAPLESMLS
- 2025-05-07 Price Changed $1,050,000 NAPLESMLS
- 2025-02-05 Price Changed $1,140,000 NAPLESMLS
- 2024-12-27 Price Changed $1,190,000 NAPLESMLS
- 2024-12-17 Listed $1,100,000 NAPLESMLS
- 2020-11-23 Listing Removed — NAPLESMLS
- 2020-09-16 Price Changed $549,900 NAPLESMLS
- 2020-09-01 Price Changed $595,000 NAPLESMLS
- 2020-08-26 Price Changed $486,000 NAPLESMLS
- 2020-08-17 Relisted — NAPLESMLS
- 2020-08-11 Pending — NAPLESMLS
- 2020-08-05 Relisted — NAPLESMLS
- 2020-07-31 Listing Removed — NAPLESMLS
- 2020-07-18 Price Changed $485,000 NAPLESMLS
- 2020-03-19 Price Changed $499,900 NAPLESMLS
- 2020-01-29 Price Changed $524,000 NAPLESMLS
- 2020-01-18 Listed $529,000 NAPLESMLS
- 2010-08-06 Sold (MLS) $177,000 NAPLESMLS
- 2010-06-21 Listed $183,900 NAPLESMLS
- 1996-03-28 Sold (Public Records) $115,000 Public Records
Property tax history
+7.4%/yrLatest (2025): $4,945 · -7.8% YoY. Source: county tax records.
Cash-flow waterfall
monthlySold comps — $/sqft
last 12 mo · ≤1 miLoading sold comps…