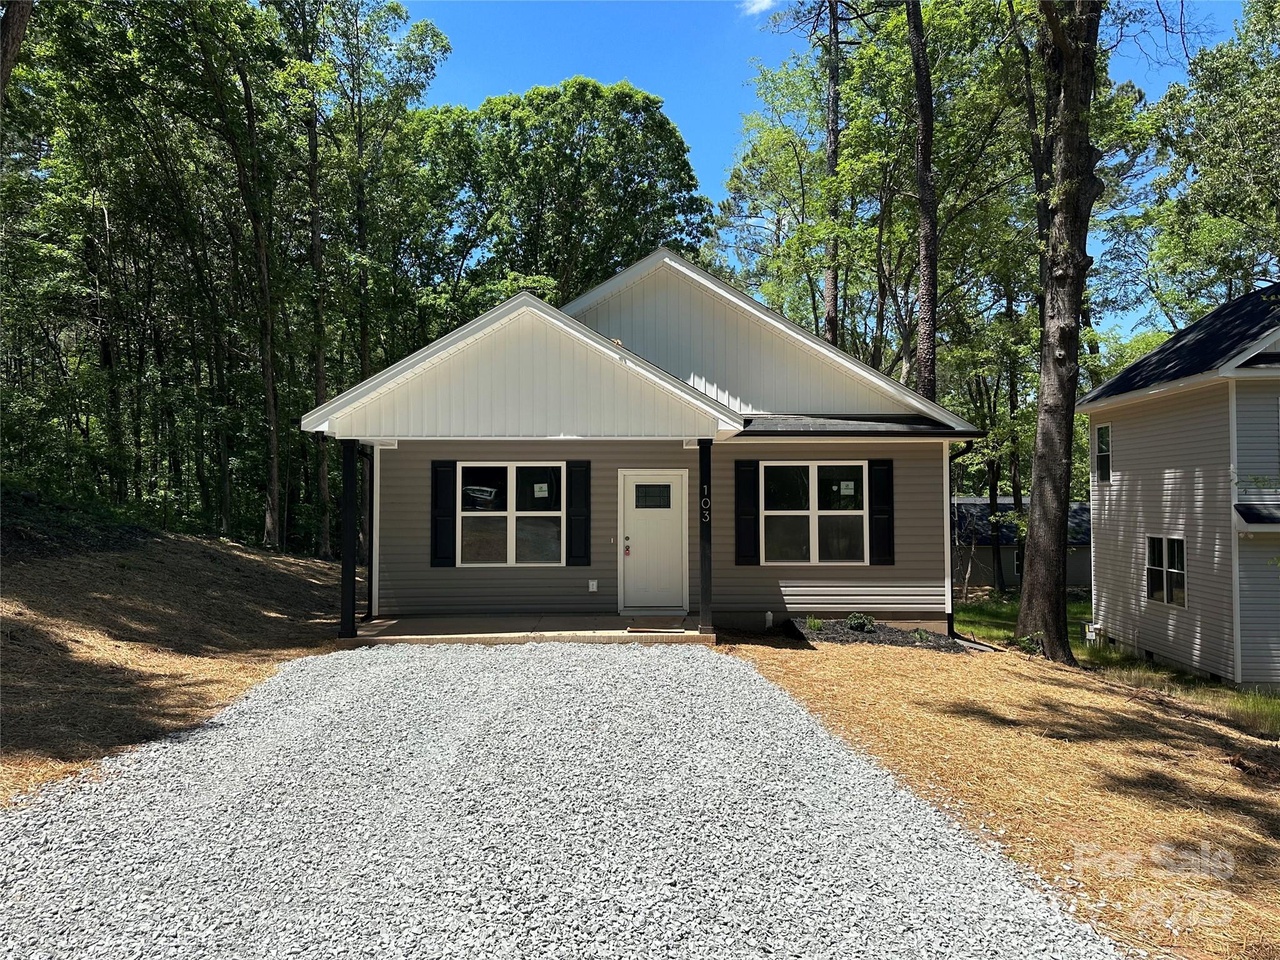
36 West St · Wadesboro, NC
Flood risk 1/10 · Minimal
- FEMA flood zone
- X (unshaded)
- Chance of flooding over 30 yrs
- 0.0%
- Est. flood insurance / yr
- $507 – $1,088
Fire risk 3/10 · Minor
- Est. fire insurance / yr
- $906 – $1,684
Heat risk 6/10 · Moderate
- Hot days now (above 106°F)
- 7 days/yr
- Hot days in 30 yrs
- 16 days/yr
Wind risk 6/10 · Moderate
- Chance of severe wind over 30 yrs
- 55.0%
Air-quality risk 2/10 · Minimal
- Unhealthy air days now
- 1 days/yr
- Unhealthy air days in 30 yrs
- 2 days/yr
Risk factors via First Street. Map © Google.
Why this score? — see what drove the D+ grade
The composite is a weighted blend of 9 inputs, each scored 0–100. Each bar is that input's sub-score; the figure is the points it added to the 100-point composite (weight × sub-score).
- Cash flow +12.9/30.0
- Appreciation +10.0/10.0
- ARV discount +7.5/15.0
- DSCR +3.9/10.0
- 1% rule +3.7/10.0
- Rent growth +2.5/5.0
- Condition / age +2.5/5.0
- Schools +2.1/10.0
- Livability +2.1/5.0
$199,999
🖨 Deal sheet 📄 Offer letter ✓ Due diligence
Listing remarks
Welcome to one of the final opportunities to own a brand-new home in Anson County’s newest and most desirable community. This thoughtfully designed 3-bedroom, 2-bathroom home offers 1,232 square feet of stylish living with soaring 9-foot ceilings that create an open, airy feel. The floor plan maximizes every inch, providing comfort, functionality, and charm. With quality finishes throughout and a layout perfect for both daily living and entertaining, this home is a standout. Don’t miss your chance to call this beautiful new construction your own!
Key facts
- 9,583 sq ft lot
- Built 2025
- Listed 392 days
Property features AI
Finance
- Other: Zoned R-6; Lot roughly 0.22 acres; Proposed development status
- HOA & community: No HOA
Exterior
- Parking: Driveway
- Utilities: City water; Public sewer
- Home design: Single-family residence; One-story layout; New construction (proposed completion: 2026-02-14)
- Construction: Site-built construction; Vinyl exterior; Slab foundation
- Exterior features: Private-maintained road access; Gravel and dirt road surface
Interior
- Kitchen: Dishwasher
- Bedrooms: Three bedrooms on the main level (one room approx. 14' x 14')
- Bathrooms: Two full bathrooms on the main level
- Heating & cooling: Central heating; Central air conditioning
- Interior features: Open floor plan with 1 main living room
- Laundry & utility: Mud room laundry area
Neighborhood map
What this means for you Summary
Snapshot
- This is a 3-bed/2.0-bath single-family listed at $200k.
Deal economics
- At list price, monthly cash flow is $-15 ($-180/yr) — negative.
- To cash-flow at today's rent, offer at most $198k (1.1% below list).
- To meet the 1% rule (rent ≥ 1% of price), the offer needs to be $173k (13.5% below list).
- Recommended offer: $173k (13.5% below list) — sets the bar for 1% rule.
Location & tenants
- Location reads 41/100 on livability (#728 in NC) — a working-class tenant base; expect higher turnover. Strengths: cost of living A+; Watch: housing C-, schools F, crime F.
- Anson County Schools (rural): math 20% / reading 32% proficiency, ranked #159 of 178 in NC (top 89%) — low school quality limits family demand, transient renter base, plan for 1-2y turnover; 67% free/reduced lunch — lower-income household profile, screen leases tightly.
- Market conditions: 85 active listings in the ZIP; 55 units permitted in Anson County in 2024 (0 in 5+ unit buildings).
Forward outlook
- In year one you build about $21k of equity ($1k loan paydown + $20k appreciation (10.0% local appreciation)).
- Anson County population projected at -24% by 2050 — secular population decline; favor cash flow + early exit over multi-decade hold.
- At projected returns (10.0% appreciation + 3.0% rent growth), your $56k cash investment doubles in ~3 years — after that, you're playing with house money.
- By year 2, paydown + projected appreciation supports a ~$34k cash-out refi (75% LTV) — recoverable capital for the next deal without selling this one.
Negotiation context
- It's been on market 392 days — a 12% lower offer ($176k) is reasonable based on typical stale-listing flexibility.
Risks & watch-outs
- Climate carrying-cost: major wind risk, 55% chance of damaging wind over 30y; extreme-heat days projected 7→16/yr by 2055 (HVAC capex compounding) — expect insurance premiums to compound above CPI over the hold.
Questions for the listing agent
- What do current leases actually rent for vs. the listed asking? Can we see a recent rent roll and the last 12 months of T-12 income?
- It's been on market 392 days. Have you received any prior offers? Is the seller open to a 13% concession, seller financing, or rate buy-down credit?
- Why hasn't it sold? Are there any deal-killer items the seller is aware of (foundation, flood, title, zoning, code violations)?
- Is there a deadline driving the sale (1031 exchange, divorce, estate, relocation)? That informs how much negotiation room exists.
- Schools are F-rated, which usually means shorter tenancies and higher turnover. Who's the typical renter profile here, and what's been the actual vacancy rate?
- Crime grade is F in this area — have there been break-ins, vandalism, or insurance claims at this property in the last 3 years? What carrier currently insures it and at what premium?
- The area grade is low — what's the realistic commute time and amenity access for the typical tenant pool here? Any planned neighborhood developments (good or bad) we should know about?
- What's the average days-on-market for RENTAL listings here right now (not sales)? A rising rental-DOM trend means longer vacancies and softer asking-rent achievability than the comps imply.
- What's the recent tenant-quality profile in this submarket — average credit score on applications, eviction rate, late-payment / NSF rate, and stable-employment percentage? A property-management company in the area should have these aggregated.
- How much new for-sale + rental construction is in the pipeline within 1–3 miles? Heavy new supply typically softens prices + rents 12–24 months out; constrained supply supports both.
Investment metrics
- 1% rule
- 0.87% ✗
- Cap rate
- 6.20%
- Cash-on-cash
- -0.32%
- DSCR
- 0.99
- GRM
- 9.6
CMA / ARV
- ARV (on-the-fly)
- $114,576
- Comps found
- 7
Show comp detail 7 sales within ~0.75 mi
| Address | Dist | Beds/Ba | Sqft | Sold | Price | $/sf | Match |
|---|---|---|---|---|---|---|---|
| 200 Bradley St | 0.36mi | 3/2.0 | 1,232 (0%) | 6mo | $209,999 | $170 | 78 |
| 610 N Pine Ln | 0.34mi | 3/1.0 | 1,284 (+4%) | 12mo | $156,000 | $121 | 62 |
| 1003 Camden Rd | 0.51mi | 3/1.0 | 1,276 (+4%) | 13mo | $70,000 | $55 | 55 |
| 203 Wheeler St | 0.56mi | 3/1.0 | 1,084 (-12%) | 7mo | $37,000 | $34 | 44 |
| 614 Morven Rd | 0.51mi | 3/1.5 | 1,100 (-11%) | 15mo | $102,000 | $93 | 44 |
| 65 Chappel St | 0.63mi | 3/1.0 | 1,360 (+10%) | 18mo | $75,000 | $55 | 34 |
| 305 E Burnsville St | 0.58mi | 2/1.0 (-1) | 1,061 (-14%) | 8mo | $156,000 | $147 | 34 |
Match score weights: distance 35% · size 25% · config 20% · recency 20%. Top-matched comps best support the ARV.
Projected returns pro-forma
10.0% appreciation · 3.0% rent growth · sell at horizon
- IRR
- 24.1%
- Equity multiple
- 2.93×
- Total profit
- $107,997
- Equity at exit
- $180,175
- IRR
- 21.3%
- Equity multiple
- 6.69×
- Total profit
- $318,835
- Equity at exit
- $388,554
Cash invested: $56,000 (down + closing). Projections, not guarantees.
Landlord ↔ Tenant lean methodology
- Overall (STATE)
- 85 Strongly Landlord-Friendly
- State North Carolina
- 85 Strongly Landlord-Friendly · R+3
- County
- — inherits STATE
- City
- — inherits STATE
ZIP-level market 28170
- Home prices YoY
- 5.8%
- Active inventory
- 85
- Price-to-rent
- 9.6×
Monthly cashflow live
- Estimated rent
- $1,731 medium interval (Pro) →
- Mortgage (P&I)
- −$1,049
- Tax est. 1.5%
- −$250 /mo · $3,000/yr
- Insurance
- −$83
- HOA
- −$0
- Vacancy / Maint / Mgmt
- −$363
- Net cashflow
- $-15
Break-even live
UW: 25.0% down · 7.5% · 30yr · 1.5% tax · 5.0% vac · 8.0% maint · 8.0% mgmt
Financing live
Cash to close
- Down payment
- $50,000
- Closing costs
- $6,000
- Reserves months
- —
- Total cash needed
- —
Loan-product check · same deal, 3 products live
Conventional
25% down · 7.5% · 30yr
- Down + closing
- —
- Monthly P&I
- —
- Monthly cashflow
- —
- DSCR
- —
- Eligible?
- —
Personal DTI + credit; lowest rate.
DSCR
20% down · 8.5% · 30yr
- Down + closing
- —
- Monthly P&I
- —
- Monthly cashflow
- —
- DSCR
- —
- Eligible?
- —
No personal income docs; deal must DSCR.
Hard money
10% down · 12.0% · 12mo
- Down + closing
- —
- Monthly P&I
- —
- Monthly cashflow
- —
- DSCR
- —
- Eligible?
- —
Short-term bridge; refi at stabilization.
Listing history 10 events
-
2026-06-09status $199,999 Active 392 DOM
-
2026-06-08days on market $199,999 Active Under Contract 392 DOM
-
2026-06-07days on market $199,999 Active Under Contract 391 DOM
-
2026-06-07days on market $199,999 Active Under Contract 390 DOM
-
2026-06-04days on market $199,999 Active Under Contract 387 DOM
-
2026-06-02days on market $199,999 Active Under Contract 386 DOM
-
2026-06-01days on market $199,999 Active Under Contract 385 DOM
-
2026-05-31days on market $199,999 Active Under Contract 384 DOM
-
2025-05-30historical Active Under Contract
-
2025-05-12$199,999 Active
ⓘ Source: listings_history table (triggers on properties + properties_extension) + one-shot
backfill from property_details.listing_events for pre-trigger history.
Climate risk First Street
- Flood 1/10 Low FEMA zone X (unshaded) · 0% chance over 30 yrs
- Wildfire 3/10 Moderate
- Heat 6/10 Major 7 d/yr ≥106°F today · 16 d/yr by 30 yrs out
- Wind 6/10 Major 55% chance of damaging wind over 30 yrs
- Air quality 2/10 Low 1 unhealthy d/yr today · 2 by 30 yrs out
Nearby sold comps map
Loading sold comps map…
Walkable amenities ~0.75 mi
Loading nearby amenities…
Taxation est. · year 1
- Rental income
- $20,767
- − Mortgage interest
- −$11,203
- − Property taxes
- −$3,000
- − Insurance
- −$1,000
- − Repairs & maintenance
- −$1,661
- − Management
- −$1,661
- − Depreciation
- −$5,818
- Taxable loss
- −$3,577
- Est. tax savings @ 24.0%
- +$858
- After-tax cash flow
- $679/yr
For passive investors: Depreciation is non-cash, so a rental often shows a tax loss while cash-flowing — sheltering income. Rental losses are passive: they offset passive income freely, and up to $25,000/yr can offset ordinary (W-2) income if you actively participate and your MAGI is under $100k (phasing out to $0 by $150k); unused losses carry forward. On sale, claimed depreciation is recaptured at up to 25%, and gains may owe capital-gains tax (a 1031 exchange can defer both). Figures are a year-1 estimate at your 24.0% rate — not tax advice; consult a CPA.
Schools (NCES district)
- District
- Anson County Schools
- NCES district ID
- 3700180
- Math proficiency
- 20% ▼ -7.00%
- Reading proficiency
- 32% ▼ -1.00%
- Median HH income
- $34,961
- Composite
- 21.41/100
- National rank
- #8348
- State rank
- #159 of 178 in NC
Livability — Wadesboro
- Score
- 41/100
- State rank
- #728
- US rank
- #27112
Category grades
Schools grade is shown separately in the Schools card above.
Census & demographics
- Census place
- Wadesboro, NC
- Population (ZIP)
- 9,595
Population outlook (Anson County) Hauer SSP2
- Today (2025)
- 23,572 people
- By 2030
- 22,384 · -5.0%
- By 2040
- 19,976 · -15.3%
- By 2050
- 17,803 · -24.5%
- By 2075
- 13,839 · -41.3%
- By 2100
- 10,890 · -53.8%
Race, ethnicity, and origin ACS 2023
- Neighborhood character
- Diverse neighborhood (Simpson 0.57)
- Race & ethnicity
- Black 53% White 38% Two or more races 4% Asian 3% Hispanic / Latino 2%
- Common ancestry
- Slovak 1% Russian 1% Serbian 1%
- Foreign-born
- 4% · Canada, South Korea
- Languages at home
- 95% English-only · Spanish 2% Other Asian/Pacific 1% Korean 1%
Political lean MEDSL · Anson
- 2024 margin
- Toss-up / Even · D 48.4% · R 50.9%
- 2008→2024 swing
- -23.5pp toward R · 2008: 20.9pp · 2024: -2.5pp
- All cycles
- 2024: R+2.5 2020: D+4.2 2016: D+12.6 2012: D+25.0 2008: D+20.9
Not yet ingested
- Civics
- —
Market trends
- HPI YoY
- ▲ 12.62%
- Current HPI
- 228.7798
- Rent YoY
- —
- Metro
- —
- State GDP YoY
- ▲ 3.28%
- F500 in state
- 26
Industry mix (Fortune 500 HQ in NC)
| Industry | F500 HQs | Revenue |
|---|---|---|
| Financial Services | 2 | $213B |
|
||
| Retail | 2 | $95B |
|
||
| Industrial Conglomerate | 1 | $38B |
|
||
| Metals / Steel | 1 | $35B |
|
||
| Utilities | 1 | $30B |
|
||
| Industrial Machinery | 1 | $19B |
|
||
Price history
2 events — show timeline
- 2025-05-30 Contingent — CANOPYMLS as Distributed by MLS Grid
- 2025-05-12 Listed $199,999 CANOPYMLS as Distributed by MLS Grid
Cash-flow waterfall
monthlySold comps — $/sqft
last 12 mo · ≤1 miLoading sold comps…