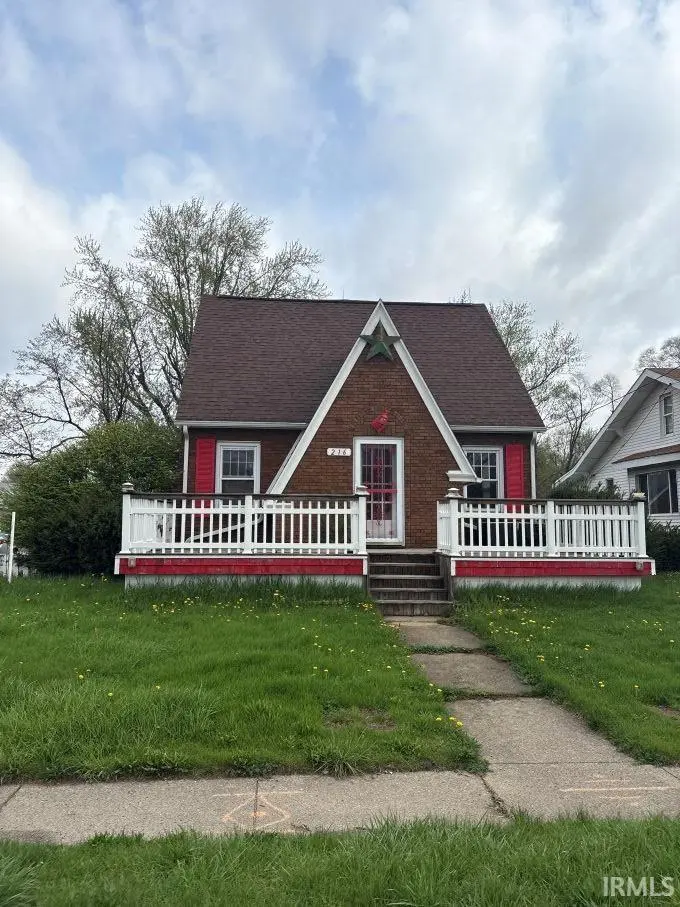
216 W Lincolnway St · Osceola, IN
Flood risk 1/10 · Minimal
- FEMA flood zone
- X (unshaded)
- Chance of flooding over 30 yrs
- 0.0%
- Est. flood insurance / yr
- $473 – $860
Fire risk 1/10 · Minimal
- Est. fire insurance / yr
- $717 – $1,331
Heat risk 3/10 · Minor
- Hot days now (above 101°F)
- 7 days/yr
- Hot days in 30 yrs
- 16 days/yr
Wind risk 2/10 · Minimal
- Chance of severe wind over 30 yrs
- —
Air-quality risk 3/10 · Minor
- Unhealthy air days now
- 2 days/yr
- Unhealthy air days in 30 yrs
- 3 days/yr
Risk factors via First Street. Map © Google.
Why this score? — see what drove the D+ grade
The composite is a weighted blend of 9 inputs, each scored 0–100. Each bar is that input's sub-score; the figure is the points it added to the 100-point composite (weight × sub-score).
- ARV discount +15.0/15.0
- Cash flow +12.9/30.0
- Schools +5.1/10.0
- DSCR +3.8/10.0
- Livability +3.5/5.0
- 1% rule +2.9/10.0
- Rent growth +2.5/5.0
- Condition / age +2.5/5.0
- Appreciation +0.0/10.0
$180,000
🖨 Deal sheet (PDF) 📄 Offer letter ✓ Due diligence
Listing remarks MLS
* Unapproved short sale * Check out this charming 3-bedroom home full of potential! With a little TLC, this property can truly shine. This home is being sold As-Is, Where Is. —don’t miss the opportunity to make it your own or add it to your investment portfolio.
Key facts
- 9,075 sq ft lot
- 2 garage spots
- Built 1930
Neighborhood map
What this means for you Summary
Snapshot
- This is a 2-bed/2.0-bath single-family listed at $180k.
Deal economics
- At list price, monthly cash flow is $-14 ($-173/yr) — negative.
- To cash-flow at today's rent, offer at most $177k (1.4% below list).
- To meet the 1% rule (rent ≥ 1% of price), the offer needs to be $142k (21.4% below list).
- Recommended offer: $142k (21.4% below list) — sets the bar for 1% rule.
- Cap rate 6.2% vs local median 3.4% in Osceola — top-decile yield for the area; either an underpriced asset or a hidden risk that comps aren't pricing in. Stress-test before assuming the spread holds.
Location & tenants
- Location reads 70/100 on livability (#144 in IN) — a middle-class / working-renter tenant base. Strengths: crime A+, cost of living A+, housing A+; Watch: amenities F, commute F, health & safety D-.
- Penn-Harris-Madison School Corporation (suburban): math 54% / reading 64% proficiency, ranked #19 of 301 in IN (top 6%) — acceptable for families but not a draw, mixed tenant base, ~2y average lease.
- Market conditions: 113 active listings in the ZIP; 754 units permitted in St. Joseph County in 2024 (460 in 5+ unit buildings).
Forward outlook
- Local home prices are declining (-3.0%/yr); year-one equity from $1k of loan paydown is wiped out by about $5k of value loss. Plan a longer hold.
Negotiation context
- It's been on market 66 days — a 6% lower offer ($169k) is reasonable based on typical stale-listing flexibility.
- 6 sale attempts since 13y ago; this cycle's ask has dropped $10k (5%) from the opening price — seller is motivated, your offer sets the floor, not the list.
Risks & watch-outs
- Watch-outs: built in 1930 — expect roof / HVAC / electrical / plumbing capex.
Questions for the listing agent
- What do current leases actually rent for vs. the listed asking? Can we see a recent rent roll and the last 12 months of T-12 income?
- It's been on market 66 days. Have you received any prior offers? Is the seller open to a 21% concession, seller financing, or rate buy-down credit?
- Built in 1930 — when were the roof, HVAC, electrical panel, plumbing, and water heater last replaced?
- Why hasn't it sold? Are there any deal-killer items the seller is aware of (foundation, flood, title, zoning, code violations)?
- Is there a deadline driving the sale (1031 exchange, divorce, estate, relocation)? That informs how much negotiation room exists.
- The area grade is low — what's the realistic commute time and amenity access for the typical tenant pool here? Any planned neighborhood developments (good or bad) we should know about?
- What's the average days-on-market for RENTAL listings here right now (not sales)? A rising rental-DOM trend means longer vacancies and softer asking-rent achievability than the comps imply.
- What's the recent tenant-quality profile in this submarket — average credit score on applications, eviction rate, late-payment / NSF rate, and stable-employment percentage? A property-management company in the area should have these aggregated.
- How much new for-sale + rental construction is in the pipeline within 1–3 miles? Heavy new supply typically softens prices + rents 12–24 months out; constrained supply supports both.
Investment metrics
- 1% rule
- 0.79% ✗
- Cap rate
- 6.20%
- Cash-on-cash
- -0.34%
- DSCR
- 0.98
- GRM
- 10.6
CMA / ARV
- ARV (median comp)
- $216,424
- List price
- $180,000
- Delta
- -16.83%
- Verdict
- UNDERPRICED
- Comps
- 20 within 1.0 mi
Show comp detail 12 sales within ~0.75 mi
| Address | Dist | Beds/Ba | Sqft | Sold | Price | $/sf | Match |
|---|---|---|---|---|---|---|---|
| 418 W Superior St | 0.16mi | 3/2.0 (+1) | 1,752 (-4%) | 5mo | $237,000 | $135 | 76 |
| 310 E Adams St | 0.40mi | 3/2.0 (+1) | 1,818 (-0%) | 6mo | $259,000 | $142 | 71 |
| 502 W Adams St | 0.24mi | 3/2.0 (+1) | 2,016 (+10%) | 5mo | $264,000 | $131 | 62 |
| 304 S Beech Rd | 0.37mi | 3/1.5 (+1) | 1,588 (-13%) | 9mo | $250,000 | $157 | 46 |
| 10249 Charles St | 0.75mi | 3/2.0 (+1) | 1,899 (+4%) | 9mo | $299,000 | $157 | 46 |
| 56449 Eastvue Dr | 0.74mi | 2/1.0 | 1,714 (-6%) | 10mo | $475,000 | $277 | 43 |
| 1404 Wilderness Trl | 0.73mi | 3/2.0 (+1) | 1,635 (-10%) | 2mo | $382,000 | $234 | 42 |
| 56934 Ash Rd | 0.72mi | 3/2.0 (+1) | 2,000 (+10%) | 4mo | $150,000 | $75 | 42 |
| 10425 Appletree Ln | 0.65mi | 3/2.0 (+1) | 1,641 (-10%) | 11mo | $195,000 | $119 | 39 |
| 10310 Lindwood Ct | 0.73mi | 3/2.0 (+1) | 1,636 (-10%) | 11mo | $315,000 | $193 | 35 |
| 536 Garfield St | 0.68mi | 3/2.0 (+1) | 2,080 (+14%) | 10mo | $300,000 | $144 | 31 |
| 1409 Wilderness Trl | 0.74mi | 3/2.0 (+1) | 1,580 (-13%) | 10mo | $375,000 | $237 | 30 |
Match score weights: distance 35% · size 25% · config 20% · recency 20%. Top-matched comps best support the ARV.
Projected returns pro-forma
-3.0% appreciation · 3.0% rent growth · sell at horizon
- IRR
- -16.9%
- Equity multiple
- 0.40×
- Total profit
- $-30,135
- Equity at exit
- $26,839
- IRR
- -8.8%
- Equity multiple
- 0.45×
- Total profit
- $-27,617
- Equity at exit
- $15,563
Cash invested: $50,400 (down + closing). Projections, not guarantees.
Landlord ↔ Tenant lean methodology
- Overall (STATE)
- 90 Strongly Landlord-Friendly
- State Indiana
- 90 Strongly Landlord-Friendly · R+11
- County
- — inherits STATE
- City
- — inherits STATE
ZIP-level market 46561
- Home prices YoY
- -27.2%
- Active inventory
- 113
- Price-to-rent
- 10.6×
Monthly cashflow live
- Estimated rent
- $1,415 medium interval (Pro) →
- Mortgage (P&I)
- −$944
- Tax from tax record
- −$114 /mo · $1,365/yr
- Insurance
- −$75
- HOA
- −$0
- Vacancy / Maint / Mgmt
- −$297
- Net cashflow
- $-14
Break-even live
Sensitivity live
| Price | -10% $87 | -5% $36 | +0% $-14 | +5% $-65 | +10% $-116 |
|---|---|---|---|---|---|
| Rent | -10% $-126 | -5% $-70 | +0% $-14 | +5% $41 | +10% $97 |
| Rate | -1.0pp $76 | -0.5pp $31 | base $-14 | +0.5pp $-61 | +1.0pp $-109 |
UW: 25.0% down · 7.5% · 30yr · 1.5% tax · 5.0% vac · 8.0% maint · 8.0% mgmt
Financing live
Cash to close
- Down payment
- $45,000
- Closing costs
- $5,400
- Reserves months
- —
- Total cash needed
- —
Loan-product check · same deal, 3 products live
Conventional
25% down · 7.5% · 30yr
- Down + closing
- —
- Monthly P&I
- —
- Monthly cashflow
- —
- DSCR
- —
- Eligible?
- —
Personal DTI + credit; lowest rate.
DSCR
20% down · 8.5% · 30yr
- Down + closing
- —
- Monthly P&I
- —
- Monthly cashflow
- —
- DSCR
- —
- Eligible?
- —
No personal income docs; deal must DSCR.
Hard money
10% down · 12.0% · 12mo
- Down + closing
- —
- Monthly P&I
- —
- Monthly cashflow
- —
- DSCR
- —
- Eligible?
- —
Short-term bridge; refi at stabilization.
Listing history 33 events
-
2026-06-21days on market $180,000 Active 66 DOM
-
2026-06-18days on market $180,000 Active 63 DOM
-
2026-06-17days on market $180,000 Active 62 DOM
-
2026-06-16days on market $180,000 Active 61 DOM
-
2026-06-15days on market $180,000 Active 60 DOM
-
2026-06-14days on market $180,000 Active 58 DOM
-
2026-06-13days on market $180,000 Active 57 DOM
-
2026-06-10days on market $180,000 Active 55 DOM
-
2026-06-09days on market $180,000 Active 54 DOM
-
2026-06-08days on market $180,000 Active 53 DOM
-
2026-06-07days on market $180,000 Active 52 DOM
-
2026-06-02days on market $180,000 Active 47 DOM
-
2026-06-01days on market $180,000 Active 46 DOM
-
2026-05-31days on market $180,000 Active 45 DOM
-
2026-05-30days on market $180,000 Active 44 DOM
-
2026-05-03historical Active Under Contract 275-char remark
Show marketing remark (275 chars)
* Unapproved short sale * Check out this charming 3-bedroom home full of potential! With a little TLC, this property can truly shine. This home is being sold As-Is, Where Is. —don’t miss the opportunity to make it your own or add it to your investment portfolio.
-
2026-05-03price $155,000 275-char remark
Show marketing remark (275 chars)
* Unapproved short sale * Check out this charming 3-bedroom home full of potential! With a little TLC, this property can truly shine. This home is being sold As-Is, Where Is. —don’t miss the opportunity to make it your own or add it to your investment portfolio.
-
2026-04-24price $175,000 275-char remark
Show marketing remark (275 chars)
* Unapproved short sale * Check out this charming 3-bedroom home full of potential! With a little TLC, this property can truly shine. This home is being sold As-Is, Where Is. —don’t miss the opportunity to make it your own or add it to your investment portfolio.
-
2026-04-16$190,000 Active 275-char remark
Show marketing remark (275 chars)
* Unapproved short sale * Check out this charming 3-bedroom home full of potential! With a little TLC, this property can truly shine. This home is being sold As-Is, Where Is. —don’t miss the opportunity to make it your own or add it to your investment portfolio.
-
2024-11-05status Active
-
2024-07-02status Pending
-
2024-06-03status Active
-
2024-05-01historical
-
2023-09-10price $199,900
-
2023-09-01price $202,500
-
2023-08-21$205,000 Active
-
2022-11-29soldstatus $185,000 Closed
-
2022-09-09status Pending
-
2022-09-06price $185,000
-
2022-08-16price $189,900
-
2022-07-01$199,900 Active
-
2014-07-24soldstatus $69,000
-
2013-10-09$75,500
ⓘ Source: listings_history table (triggers on properties + properties_extension) + one-shot
backfill from property_details.listing_events for pre-trigger history.
Tax reassessment forecast IN · Partial reset (capped growth)
- Current annual tax
- $1,365 · $114/mo
- Projected year-2 tax
- $1,447 · $121/mo
- Expected delta
- +$83/yr (+$7/mo · 6.1%)
ⓘ Screening estimate from a state-policy table — verify with the county assessor before closing.
Climate risk First Street
- Flood 1/10 Low FEMA zone X (unshaded) · 0% chance over 30 yrs
- Wildfire 1/10 Low
- Heat 3/10 Moderate 7 d/yr ≥101°F today · 16 d/yr by 30 yrs out
- Wind 2/10 Low
- Air quality 3/10 Moderate 2 unhealthy d/yr today · 3 by 30 yrs out
Nearby sold comps map
Loading sold comps map…
Walkable amenities ~0.75 mi
Loading nearby amenities…
Taxation est. · year 1
- Rental income
- $16,986
- − Mortgage interest
- −$10,083
- − Property taxes
- −$1,365
- − Insurance
- −$900
- − Repairs & maintenance
- −$1,359
- − Management
- −$1,359
- − Depreciation
- −$5,236
- Taxable loss
- −$3,316
- Est. tax savings @ 24.0%
- +$796
- After-tax cash flow
- $622/yr
For passive investors: Depreciation is non-cash, so a rental often shows a tax loss while cash-flowing — sheltering income. Rental losses are passive: they offset passive income freely, and up to $25,000/yr can offset ordinary (W-2) income if you actively participate and your MAGI is under $100k (phasing out to $0 by $150k); unused losses carry forward. On sale, claimed depreciation is recaptured at up to 25%, and gains may owe capital-gains tax (a 1031 exchange can defer both). Figures are a year-1 estimate at your 24.0% rate — not tax advice; consult a CPA.
Schools (NCES district)
- District
- Penn-Harris-Madison School Corporation
- NCES district ID
- 1808760
- Math proficiency
- 54% ▼ -11.00%
- Reading proficiency
- 64% ▼ -6.00%
- Median HH income
- $59,421
- Composite
- 51.11/100
- National rank
- #1764
- State rank
- #19 of 301 in IN
Livability — Osceola
- Score
- 70/100
- State rank
- #144
- US rank
- #7375
Category grades
Schools grade is shown separately in the Schools card above.
Census & demographics
- Census place
- Osceola, IN
- City population
- 14,499
- Population (ZIP)
- 14,499
Population outlook (St. Joseph County) Hauer SSP2
- Today (2025)
- 273,186 people
- By 2030
- 273,594 · +0.1%
- By 2040
- 271,641 · -0.6%
- By 2050
- 269,187 · -1.5%
- By 2075
- 263,136 · -3.7%
- By 2100
- 245,659 · -10.1%
Race, ethnicity, and origin ACS 2023
- Neighborhood character
- Predominantly White (87%)
- Race & ethnicity
- White 87% Hispanic / Latino 9% Two or more races 7% Black 2% Asian 1%
- Hispanic origin (detail)
- Mexican 4% Puerto Rican 4%
- Common ancestry
- Romanian 5% Italian 2% Lithuanian 1%
- Foreign-born
- 3% · Canada
- Languages at home
- 95% English-only · Spanish 3% Arabic 1% Korean 1%
Political lean MEDSL · St. Joseph
- 2024 margin
- Toss-up / Even · D 50.0% · R 48.5% · Other 1.5%
- 2008→2024 swing
- -15.6pp toward R · 2008: 17.1pp · 2024: 1.5pp
- All cycles
- 2024: D+1.5 2020: D+5.8 2016: D+0.2 2012: D+3.5 2008: D+17.1
Not yet ingested
- Civics
- —
Market trends
- HPI YoY
- ▼ -81.38%
- Current HPI
- 217.644
- Rent YoY
- —
- Metro
- —
- State GDP YoY
- ▲ 2.90%
- F500 in state
- 18
Industry mix (Fortune 500 HQ in IN)
| Industry | F500 HQs | Revenue |
|---|---|---|
| Industrial Machinery | 2 | $37B |
|
||
| Healthcare | 1 | $177B |
|
||
| Pharmaceuticals | 1 | $45B |
|
||
| Metals / Steel | 1 | $18B |
|
||
| Agriculture | 1 | $17B |
|
||
| Packaging | 1 | $12B |
|
||
Price history
+105.3% since first listed18 events — show timeline
- 2026-05-03 Contingent — IRMLS
- 2026-05-03 Price Changed $155,000 IRMLS
- 2026-04-24 Price Changed $175,000 IRMLS
- 2026-04-16 Listed $190,000 IRMLS
- 2024-11-05 Relisted — IRMLS
- 2024-07-02 Pending — IRMLS
- 2024-06-03 Relisted — IRMLS
- 2024-05-01 Coming Soon — IRMLS
- 2023-09-10 Price Changed $199,900 IRMLS
- 2023-09-01 Price Changed $202,500 IRMLS
- 2023-08-21 Listed $205,000 IRMLS
- 2022-11-29 Sold (MLS) $185,000 IRMLS
- 2022-09-09 Pending — IRMLS
- 2022-09-06 Price Changed $185,000 IRMLS
- 2022-08-16 Price Changed $189,900 IRMLS
- 2022-07-01 Listed $199,900 IRMLS
- 2014-07-24 Sold (MLS) $69,000 IRMLS
- 2013-10-09 Listed $75,500 IRMLS
Property tax history
-2.6%/yrLatest (2023): $1,365 · -0.9% YoY. Source: county tax records.
Cash-flow waterfall
monthlySold comps — $/sqft
last 12 mo · ≤1 miLoading sold comps…