1770 Gualandri Ln · Westfield, IN
Flood risk No data
- FEMA flood zone
- —
- Chance of flooding over 30 yrs
- —
- Est. flood insurance / yr
- —
Fire risk No data
- Est. fire insurance / yr
- —
Heat risk No data
- Hot days now (above threshold)
- —
- Hot days in 30 yrs
- —
Wind risk No data
- Chance of severe wind over 30 yrs
- —
Air-quality risk No data
- Unhealthy air days now
- —
- Unhealthy air days in 30 yrs
- —
Risk factors via First Street. Map © Google.
Why this score? — see what drove the D- grade
The composite is a weighted blend of 9 inputs, each scored 0–100. Each bar is that input's sub-score; the figure is the points it added to the 100-point composite (weight × sub-score).
- ARV discount +15.0/15.0
- Cash flow +6.4/30.0
- Schools +5.5/10.0
- Rent growth +3.6/5.0
- Livability +3.6/5.0
- Condition / age +2.5/5.0
- 1% rule +1.6/10.0
- DSCR +0.7/10.0
- Appreciation +0.0/10.0
$417,035
🖨 Deal sheet 📄 Offer letter ✓ Due diligence
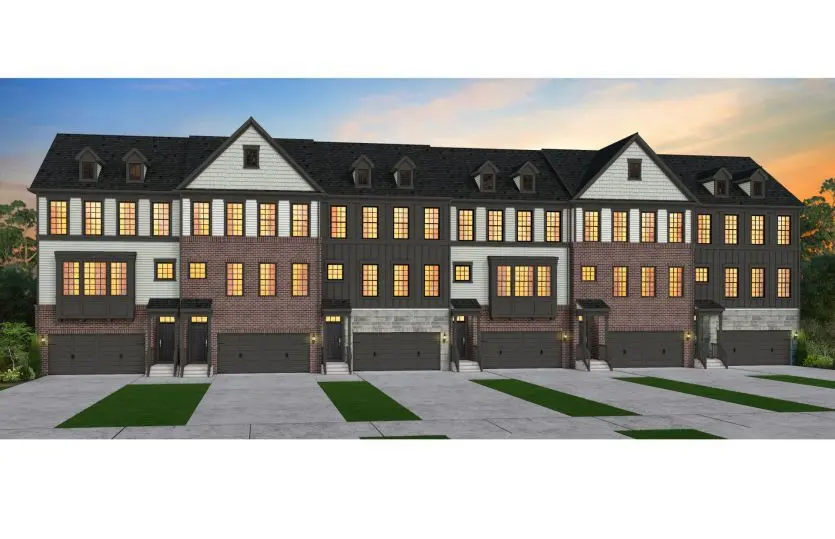
Listing remarks
Finishing this June, this practical Isleton home is waiting for you! With two outdoor living spaces, this home is ready for the perfect Summer Party. You'll love the open main level and private bedrooms on the third floor.
Key facts
- Open main level
- Private bedrooms
- Built 2026
Tags
Neighborhood map
What this means for you Summary
Snapshot
- This is a 3-bed/3.0-bath townhouse listed at $417k.
Deal economics
- At list price, monthly cash flow is $-718 ($-9k/yr) — negative.
- To cash-flow at today's rent, offer at most $313k (24.9% below list).
- To meet the 1% rule (rent ≥ 1% of price), the offer needs to be $274k (34.3% below list).
- Recommended offer: $274k (34.3% below list) — sets the bar for 1% rule.
- Cap rate 4.2% vs local median 3.0% in Westfield — top-decile yield for the area; either an underpriced asset or a hidden risk that comps aren't pricing in. Stress-test before assuming the spread holds.
Location & tenants
- Location reads 71/100 on livability (#140 in IN) — a middle-class / working-renter tenant base. Strengths: crime A+, employment A+, housing A+; Watch: amenities F, commute F, health & safety F.
- Westfield-Washington Schools (suburban): math 58% / reading 64% proficiency, ranked #10 of 301 in IN (top 3%) — acceptable for families but not a draw, mixed tenant base, ~2y average lease; only 14% free/reduced lunch — higher-income household profile.
- Market conditions: Rents rising fast (+4.3%/yr); 801 active listings in the ZIP; 11 comparable units currently listed for rent nearby; rentals lingering (median 44d on market — plan ~5-8 weeks vacancy on turnover, expect pricing pressure); 55% of comp listings sitting > 30 days — soft ceiling on asking rent; high-income renter base; 4,661 units permitted in Hamilton County in 2024 (1,528 in 5+ unit buildings).
Forward outlook
- Local home prices are declining (-3.0%/yr); year-one equity from $3k of loan paydown is wiped out by about $13k of value loss. Plan a longer hold.
- Hamilton County population projected at +44% by 2050 — long-run rental-demand tailwind backs the buy-and-hold thesis.
Negotiation context
- It's been on market 30 days — a 2% lower offer ($411k) is reasonable based on typical stale-listing flexibility.
Questions for the listing agent
- What do current leases actually rent for vs. the listed asking? Can we see a recent rent roll and the last 12 months of T-12 income?
- Is there a deadline driving the sale (1031 exchange, divorce, estate, relocation)? That informs how much negotiation room exists.
- Schools are A-rated — typically a magnet for longer-tenancy family renters. What's the average tenant stay here, and is there a school-zone premium baked into asking?
- The area grade is low — what's the realistic commute time and amenity access for the typical tenant pool here? Any planned neighborhood developments (good or bad) we should know about?
- What's the average days-on-market for RENTAL listings here right now (not sales)? A rising rental-DOM trend means longer vacancies and softer asking-rent achievability than the comps imply.
- What's the recent tenant-quality profile in this submarket — average credit score on applications, eviction rate, late-payment / NSF rate, and stable-employment percentage? A property-management company in the area should have these aggregated.
- How much new for-sale + rental construction is in the pipeline within 1–3 miles? Heavy new supply typically softens prices + rents 12–24 months out; constrained supply supports both.
Investment metrics
- 1% rule
- 0.66% ✗
- Cap rate
- 4.23%
- Cash-on-cash
- -7.38%
- DSCR
- 0.67
- GRM
- 12.7
CMA / ARV
- ARV (median comp)
- $546,752
- List price
- $417,035
- Delta
- -23.72%
- Verdict
- UNDERPRICED
- Comps
- 20 within 1.0 mi
Show comp detail 12 sales within ~0.75 mi
| Address | Dist | Beds/Ba | Sqft | Sold | Price | $/sf | Match |
|---|---|---|---|---|---|---|---|
| 16854 Brinkman Rd | 0.03mi | 3/3.0 | 2,378 (-0%) | 3mo | $420,000 | $177 | 96 |
| 16758 Brinkman Rd | 0.09mi | 3/3.0 | 2,378 (-0%) | 4mo | $418,000 | $176 | 92 |
| 16786 Brinkman Rd | 0.07mi | 3/3.0 | 2,378 (-0%) | 6mo | $380,000 | $160 | 91 |
| 16832 Brinkman Rd | 0.03mi | 4/3.5 (+1) | 2,378 (-0%) | 3mo | $422,000 | $177 | 88 |
| 16752 Brinkman Rd | 0.09mi | 4/3.5 (+1) | 2,378 (-0%) | 3mo | $404,000 | $170 | 86 |
| 168 Midland Trace Loop | 0.52mi | 3/3.5 | 2,477 (+4%) | 0mo | $734,048 | $296 | 67 |
| 192 Midland Trace Loop | 0.53mi | 3/3.5 | 2,477 (+4%) | 10mo | $655,643 | $265 | 59 |
| 182 Midland Trace Loop | 0.52mi | 3/3.5 | 2,497 (+5%) | 10mo | $678,794 | $272 | 58 |
| 367 S Cherry St | 0.52mi | 3/3.5 | 2,106 (-12%) | 1mo | $484,000 | $230 | 54 |
| 187 Midland Trace Loop | 0.51mi | 3/3.5 | 2,068 (-13%) | 1mo | $484,000 | $234 | 51 |
| 379 S Cherry St | 0.51mi | 3/3.5 | 2,106 (-12%) | 8mo | $529,000 | $251 | 48 |
| 373 S Cherry St | 0.51mi | 3/3.5 | 2,062 (-14%) | 7mo | $487,000 | $236 | 46 |
Match score weights: distance 35% · size 25% · config 20% · recency 20%. Top-matched comps best support the ARV.
Projected returns pro-forma
-3.0% appreciation · 4.26% rent growth · sell at horizon
- IRR
- -27.8%
- Equity multiple
- 0.06×
- Total profit
- $-109,735
- Equity at exit
- $62,181
- IRR
- -22.2%
- Equity multiple
- -0.19×
- Total profit
- $-139,448
- Equity at exit
- $36,058
Cash invested: $116,770 (down + closing). Projections, not guarantees.
Landlord ↔ Tenant lean methodology
- Overall (STATE)
- 90 Strongly Landlord-Friendly
- State Indiana
- 90 Strongly Landlord-Friendly · R+11
- County
- — inherits STATE
- City
- — inherits STATE
ZIP-level market 46074
- Rents YoY
- 4.3%
- Active inventory
- 801
- Price-to-rent
- 12.7×
Monthly cashflow live
- Estimated rent
- $2,740 high interval (Pro) →
- Mortgage (P&I)
- −$2,187
- Tax est. 1.5%
- −$521 /mo · $6,256/yr
- Insurance
- −$174
- HOA
- −$0
- Vacancy / Maint / Mgmt
- −$575
- Net cashflow
- $-718
Break-even live
UW: 25.0% down · 7.5% · 30yr · 1.5% tax · 5.0% vac · 8.0% maint · 8.0% mgmt
Financing live
Cash to close
- Down payment
- $104,259
- Closing costs
- $12,511
- Reserves months
- —
- Total cash needed
- —
Loan-product check · same deal, 3 products live
Conventional
25% down · 7.5% · 30yr
- Down + closing
- —
- Monthly P&I
- —
- Monthly cashflow
- —
- DSCR
- —
- Eligible?
- —
Personal DTI + credit; lowest rate.
DSCR
20% down · 8.5% · 30yr
- Down + closing
- —
- Monthly P&I
- —
- Monthly cashflow
- —
- DSCR
- —
- Eligible?
- —
No personal income docs; deal must DSCR.
Hard money
10% down · 12.0% · 12mo
- Down + closing
- —
- Monthly P&I
- —
- Monthly cashflow
- —
- DSCR
- —
- Eligible?
- —
Short-term bridge; refi at stabilization.
Rent comps 11 comps
| Address | Beds | Baths | Sqft | Rent | $/sqft | DOM | Units | Dist |
|---|---|---|---|---|---|---|---|---|
| 16838 Brinkman Rd Westfield, IN | 3.0 | 2.5 | 2387 | $2,700 | $1.13 | 17d | 1 | 0.02mi |
| 16848 Brinkman Rd Westfield, IN | 4.0 | 3.5 | 2378 | $2,850 | $1.20 | 43d | 1 | 0.02mi |
| 620 Southridge Ct Unit 1303752P Westfield, IN | 4.0 | 2.5 | 1797 | $5,460 | $3.04 | 14d | 1 | 0.30mi |
| 218 W Main St Westfield, IN | 4.0 | 2.5 | 1872 | $2,495 | $1.33 | 43d | 1 | 0.79mi |
| 16026 Coleman Dr Westfield, IN | 3.0 | 2.5 | 2400 | $3,000 | $1.25 | 43d | 1 | 0.94mi |
| 16325 Bay Meadow Cir Westfield, IN | 4.0 | 3.0 | 2042 | $1,995 | $0.98 | 12d | 1 | 1.04mi |
| 3517 Buckner Dr Westfield, IN | 3.0 | 2.5 | 1836 | $2,500 | $1.36 | 17d | 1 | 1.21mi |
| 3541 Buckner Dr Westfield, IN | 3.0 | 2.5 | 1836 | $2,600 | $1.42 | 17d | 1 | 1.23mi |
| 459 Vernon Pl Westfield, IN | 4.0 | 2.5 | 1968 | $3,750 | $1.91 | 43d | 1 | 1.26mi |
| 16271 Ambia Cir Westfield, IN | 3.0 | 2.5 | 3074 | $3,300 | $1.07 | 43d | 1 | 1.27mi |
| 404 E Pine Ridge Dr Westfield, IN | 3.0 | 2.5 | 1726 | $3,250 | $1.88 | 43d | 1 | 1.40mi |
Listing history 2 events
-
2026-05-31days on market $417,035 Active 30 DOM
-
2026-05-01$417,035 Active 222-char remark
ⓘ Source: listings_history table (triggers on properties + properties_extension) + one-shot
backfill from property_details.listing_events for pre-trigger history.
Nearby sold comps map
Loading sold comps map…
Walkable amenities ~0.75 mi
Loading nearby amenities…
Taxation est. · year 1
- Rental income
- $32,875
- − Mortgage interest
- −$23,360
- − Property taxes
- −$6,256
- − Insurance
- −$2,085
- − Repairs & maintenance
- −$2,630
- − Management
- −$2,630
- − Depreciation
- −$12,132
- Taxable loss
- −$16,218
- Est. tax savings @ 24.0%
- +$3,892
- After-tax cash flow
- $-4,721/yr
For passive investors: Depreciation is non-cash, so a rental often shows a tax loss while cash-flowing — sheltering income. Rental losses are passive: they offset passive income freely, and up to $25,000/yr can offset ordinary (W-2) income if you actively participate and your MAGI is under $100k (phasing out to $0 by $150k); unused losses carry forward. On sale, claimed depreciation is recaptured at up to 25%, and gains may owe capital-gains tax (a 1031 exchange can defer both). Figures are a year-1 estimate at your 24.0% rate — not tax advice; consult a CPA.
Schools (NCES district)
- District
- Westfield-Washington Schools
- NCES district ID
- 1813080
- Math proficiency
- 58% ▼ -9.00%
- Reading proficiency
- 64% ▼ -3.00%
- Median HH income
- $82,682
- Composite
- 55.01/100
- National rank
- #1295
- State rank
- #10 of 301 in IN
Livability — Westfield
- Score
- 71/100
- State rank
- #140
- US rank
- #7263
Category grades
Schools grade is shown separately in the Schools card above.
Census & demographics
- Census place
- Westfield, IN
- County
- Hamilton County · 337,479 people
- City population
- 48,901
- Metro
- Indianapolis-Carmel-Anderson, IN
- Population (ZIP)
- 48,901
- Household income
- $126,724
- Rent vs Own
- Severe rent burden
- 742.0
Population outlook (Hamilton County) Hauer SSP2
- Today (2025)
- 381,938 people
- By 2030
- 417,496 · +9.3%
- By 2040
- 486,684 · +27.4%
- By 2050
- 549,805 · +44.0%
- By 2075
- 687,078 · +79.9%
- By 2100
- 754,495 · +97.5%
Race, ethnicity, and origin ACS 2023
- Neighborhood character
- Predominantly White (74%)
- Race & ethnicity
- White 74% Two or more races 10% Hispanic / Latino 9% Asian 8% Black 3%
- Hispanic origin (detail)
- Mexican 4% Puerto Rican 1%
- Common ancestry
- Romanian 4% Italian 4% Lithuanian 2%
- Foreign-born
- 12% · Canada, China, South Korea
- Languages at home
- 84% English-only · Spanish 5% Arabic 3% Chinese 2%
Political lean MEDSL · Hamilton
- 2024 margin
- Lean R (+6.1) · D 46.0% · R 52.1% · Other 1.9%
- 2008→2024 swing
- +16.2pp toward D · 2008: -22.2pp · 2024: -6.1pp
- All cycles
- 2024: R+6.1 2020: R+6.8 2016: R+19.6 2012: R+34.3 2008: R+22.2
Not yet ingested
- Civics
- —
Market trends
- HPI YoY
- ▼ -140.45%
- Current HPI
- 220.9413
- Rent YoY
- ▲ 4.26%
- Metro
- Indianapolis-Carmel-Anderson, IN
- State GDP YoY
- ▲ 2.90%
- F500 in state
- 18
Industry mix (Fortune 500 HQ in IN)
| Industry | F500 HQs | Revenue |
|---|---|---|
| Industrial Machinery | 2 | $37B |
|
||
| Healthcare | 1 | $177B |
|
||
| Pharmaceuticals | 1 | $45B |
|
||
| Metals / Steel | 1 | $18B |
|
||
| Agriculture | 1 | $17B |
|
||
| Packaging | 1 | $12B |
|
||
Cash-flow waterfall
monthlySold comps — $/sqft
last 12 mo · ≤1 miLoading sold comps…