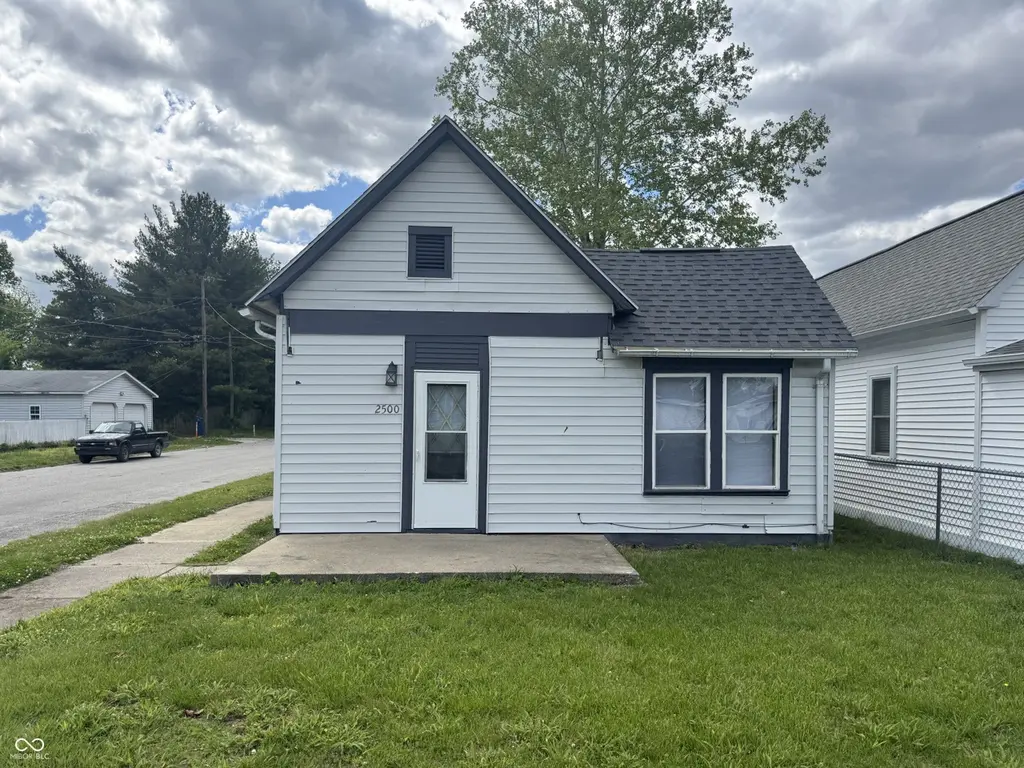
2500 N 6 1/2 St · Terre Haute, IN
Flood risk 1/10 · Minimal
- FEMA flood zone
- X (unshaded)
- Chance of flooding over 30 yrs
- 0.0%
- Est. flood insurance / yr
- $507 – $1,088
Fire risk 3/10 · Minor
- Est. fire insurance / yr
- $717 – $1,331
Heat risk 4/10 · Minor
- Hot days now (above 105°F)
- 7 days/yr
- Hot days in 30 yrs
- 19 days/yr
Wind risk 2/10 · Minimal
- Chance of severe wind over 30 yrs
- 1.0%
Air-quality risk 3/10 · Minor
- Unhealthy air days now
- 3 days/yr
- Unhealthy air days in 30 yrs
- 4 days/yr
Risk factors via First Street. Map © Google.
Why this score? — see what drove the C+ grade
The composite is a weighted blend of 9 inputs, each scored 0–100. Each bar is that input's sub-score; the figure is the points it added to the 100-point composite (weight × sub-score).
- Cash flow +23.5/30.0
- ARV discount +14.9/15.0
- DSCR +7.6/10.0
- 1% rule +5.5/10.0
- Livability +3.8/5.0
- Schools +2.9/10.0
- Rent growth +2.5/5.0
- Condition / age +2.5/5.0
- Appreciation +0.0/10.0
$99,900
🖨 Deal sheet 📄 Offer letter ✓ Due diligence
Listing remarks MLS
Enjoy the practicality of this charming 2-bedroom, 1-bath home situated on a corner lot in a convenient Terre Haute location. Featuring vinyl siding, a 2-year-old shingle roof, fresh paint, some new flooring, and updated electrical, this home offers great curb appeal and thoughtful improvements throughout. Relax on the open front porch before stepping inside to a comfortable living room that flows naturally into the separate dining room, creating an inviting layout for everyday living or entertaining. The large eat-in kitchen provides ample space for meals, storage, and gatherings. A utility room and laundry room add function and convenience, with back-door access to the spacious backyard-perfect for outdoor activities, gardening, pets, or future possibilities. Located close to Collett and Maple Ave Parks, Indiana State University, and Union Hospital, this home also offers easy access to US Hwy 41 and 63.
Key facts
- Updated electrical
- Fresh paint
- New flooring
Tags
Property features AI
Exterior
- Utilities: Public sewer
- Home design: Single Family Residence; Single-story
- Construction: Vinyl siding; Shingle roof
- Exterior features: Porch
Interior
- Kitchen: Electric range; Electric oven
- Flooring: Carpet; Vinyl
- Bathrooms: 1 full bathroom
- Heating & cooling: Electric heating with forced air; Ceiling fan(s); Wall/window unit(s) for cooling
- Interior features: Window coverings; Smoke detector(s)
Neighborhood map
What this means for you Summary
Snapshot
- This is a 2-bed/1.0-bath single-family listed at $100k.
Deal economics
- At list price, monthly cash flow is $187 ($2k/yr) — positive.
- The deal already cash-flows at list — no discount required.
- Meets the 1% rule at list price ($1k rent vs $100k).
- Recommended offer: $97k (3.0% below list) — sets the bar for market timing.
- Cap rate 8.5% vs local median 4.7% in Terre Haute — top-decile yield for the area; either an underpriced asset or a hidden risk that comps aren't pricing in. Stress-test before assuming the spread holds.
Location & tenants
- Location reads 75/100 on livability (#63 in IN, #4,186 nationally) — a middle-class / working-renter tenant base. Strengths: cost of living A+, housing A+, health & safety A+; Watch: crime F, employment F.
- Vigo County School Corporation (urban): math 32% / reading 37% proficiency, ranked #202 of 301 in IN (top 67%) — families likely to look elsewhere, expect single-tenant / working-renter base with shorter leases.
- Zoned schools: Terre Town Elementary School (math 43% / reading 35%, grade F, #530 of 994 statewide, top 54%, 556 students, 82% FRL); Otter Creek Middle School (math 13% / reading 25%, grade F, #274 of 330 statewide, top 83%, 787 students, 65% FRL); Terre Haute North Vigo High School (math 25% / reading 62%, grade F, #191 of 369 statewide, top 52%, 1,507 students, 51% FRL) — zoned schools average 66% FRL vs 47% district-wide (19 pts higher); higher-poverty schools than district average — tighter screening recommended.
- Market conditions: 65 active listings in the ZIP; 8 comparable units currently listed for rent nearby; rentals lingering (median 44d on market — plan ~5-8 weeks vacancy on turnover, expect pricing pressure); 100% of comp listings sitting > 30 days — soft ceiling on asking rent; lower-income renter base — watch delinquency; 60 units permitted in Vigo County in 2024 (0 in 5+ unit buildings).
- This rent runs 31% of the median local income ($41k/yr) — at the standard rent-burdened threshold; future hikes will face affordability resistance.
Forward outlook
- Local home prices are declining (-3.0%/yr); year-one equity from $691 of loan paydown is wiped out by about $3k of value loss. Plan a longer hold.
- Vigo County population projected to shrink 5% by 2050 — rents likely to lag national; underwrite the cash flow, not the appreciation.
Negotiation context
- It's been on market 40 days — a 3% lower offer ($97k) is reasonable based on typical stale-listing flexibility.
- 4 sale attempts with the ask held roughly flat each time — persistent listings suggest the price (not the market) is what's stuck; bring a comps-based counter.
Risks & watch-outs
- Watch-outs: built in 1910 — expect roof / HVAC / electrical / plumbing capex.
Questions for the listing agent
- It's been on market 40 days. Have you received any prior offers? Is the seller open to a 3% concession, seller financing, or rate buy-down credit?
- Built in 1910 — when were the roof, HVAC, electrical panel, plumbing, and water heater last replaced?
- Is there a deadline driving the sale (1031 exchange, divorce, estate, relocation)? That informs how much negotiation room exists.
- Schools are D-rated, which usually means shorter tenancies and higher turnover. Who's the typical renter profile here, and what's been the actual vacancy rate?
- Crime grade is F in this area — have there been break-ins, vandalism, or insurance claims at this property in the last 3 years? What carrier currently insures it and at what premium?
- What's the average days-on-market for RENTAL listings here right now (not sales)? A rising rental-DOM trend means longer vacancies and softer asking-rent achievability than the comps imply.
- What's the recent tenant-quality profile in this submarket — average credit score on applications, eviction rate, late-payment / NSF rate, and stable-employment percentage? A property-management company in the area should have these aggregated.
- How much new for-sale + rental construction is in the pipeline within 1–3 miles? Heavy new supply typically softens prices + rents 12–24 months out; constrained supply supports both.
Investment metrics
- 1% rule
- 1.05% ✓
- Cap rate
- 8.54%
- Cash-on-cash
- 8.03%
- DSCR
- 1.36
- GRM
- 7.9
CMA / ARV
- ARV (median comp)
- $119,513
- List price
- $99,900
- Delta
- -16.41%
- Verdict
- UNDERPRICED
- Comps
- 20 within 1.0 mi
Show comp detail 8 sales within ~0.75 mi
| Address | Dist | Beds/Ba | Sqft | Sold | Price | $/sf | Match |
|---|---|---|---|---|---|---|---|
| 2516 N 14th St | 0.70mi | 2/1.0 | 1,006 (+0%) | 3mo | $122,500 | $122 | 65 |
| 2839 N 11th St | 0.48mi | 2/1.0 | 1,048 (+4%) | 7mo | $105,000 | $100 | 64 |
| 2529 N 11th St | 0.39mi | 2/1.0 | 926 (-8%) | 7mo | $111,000 | $120 | 63 |
| 3112 N 11th St | 0.60mi | 2/1.0 | 1,120 (+11%) | 4mo | $160,000 | $143 | 50 |
| 2435 N 14 St | 0.72mi | 3/2.0 (+1) | 960 (-4%) | 3mo | $114,500 | $119 | 48 |
| 675 Francis Ave Ct | 0.61mi | 2/2.0 | 1,091 (+9%) | 13mo | $149,900 | $137 | 43 |
| 546 Francis Ct | 0.66mi | 2/2.0 | 1,092 (+9%) | 10mo | $140,000 | $128 | 42 |
| 520 Francis Ave Ct | 0.66mi | 2/2.0 | 1,092 (+9%) | 15mo | $142,500 | $130 | 38 |
Match score weights: distance 35% · size 25% · config 20% · recency 20%. Top-matched comps best support the ARV.
Projected returns pro-forma
-3.0% appreciation · 3.0% rent growth · sell at horizon
- IRR
- -4.1%
- Equity multiple
- 0.85×
- Total profit
- $-4,282
- Equity at exit
- $14,895
- IRR
- 5.6%
- Equity multiple
- 1.41×
- Total profit
- $11,563
- Equity at exit
- $8,638
Cash invested: $27,972 (down + closing). Projections, not guarantees.
Landlord ↔ Tenant lean methodology
- Overall (STATE)
- 90 Strongly Landlord-Friendly
- State Indiana
- 90 Strongly Landlord-Friendly · R+11
- County
- — inherits STATE
- City
- — inherits STATE
ZIP-level market 47804
- Home prices YoY
- -24.2%
- Active inventory
- 65
- Price-to-rent
- 7.9×
Monthly cashflow live
- Estimated rent
- $1,049 high interval (Pro) →
- Mortgage (P&I)
- −$524
- Tax from tax record
- −$76 /mo · $908/yr
- Insurance
- −$42
- HOA
- −$0
- Vacancy / Maint / Mgmt
- −$220
- Net cashflow
- $187
Break-even live
UW: 25.0% down · 7.5% · 30yr · 1.5% tax · 5.0% vac · 8.0% maint · 8.0% mgmt
Financing live
Cash to close
- Down payment
- $24,975
- Closing costs
- $2,997
- Reserves months
- —
- Total cash needed
- —
Loan-product check · same deal, 3 products live
Conventional
25% down · 7.5% · 30yr
- Down + closing
- —
- Monthly P&I
- —
- Monthly cashflow
- —
- DSCR
- —
- Eligible?
- —
Personal DTI + credit; lowest rate.
DSCR
20% down · 8.5% · 30yr
- Down + closing
- —
- Monthly P&I
- —
- Monthly cashflow
- —
- DSCR
- —
- Eligible?
- —
No personal income docs; deal must DSCR.
Hard money
10% down · 12.0% · 12mo
- Down + closing
- —
- Monthly P&I
- —
- Monthly cashflow
- —
- DSCR
- —
- Eligible?
- —
Short-term bridge; refi at stabilization.
Rent comps 8 comps
| Address | Beds | Baths | Sqft | Rent | $/sqft | DOM | Units | Dist |
|---|---|---|---|---|---|---|---|---|
| 2250 Garfield Ave Terre Haute, IN | 3.0 | 1.0 | 1500 | $1,375 | $0.92 | 43d | 1 | 0.54mi |
| 2702 N 6 1/2 St Terre Haute, IN | 2.0 | 1.0 | 775 | $1,500 | $1.94 | 43d | 1 | 0.66mi |
| 1723 N 11th St Unit 2 Terre Haute, IN | 1.0 | 1.0 | 700 | $800 | $1.14 | 43d | 1 | 0.79mi |
| 1723 N 11th St Unit 3 Terre Haute, IN | 2.0 | 1.0 | 800 | $800 | $1.00 | 43d | 1 | 0.79mi |
| 3100 N 14th St Terre Haute, IN | 3.0 | 1.5 | 990 | $1,450 | $1.46 | 43d | 1 | 0.87mi |
| 1028 N 9th St Terre Haute, IN | 2.0 | 1.0 | 960 | $1,200 | $1.25 | 43d | 1 | 1.22mi |
| 1432 4th Ave Terre Haute, IN | 3.0 | 1.0 | 1144 | $1,000 | $0.87 | 43d | 1 | 1.34mi |
| 2003 N 22nd St Terre Haute, IN | 1.0 | 1.0 | 846 | $650 | $0.77 | 43d | 1 | 1.41mi |
Listing history 20 events
-
2026-06-19days on market $99,900 Active 40 DOM
-
2026-06-18days on market $99,900 Active 39 DOM
-
2026-06-17days on market $99,900 Active 38 DOM
-
2026-06-16days on market $99,900 Active 37 DOM
-
2026-06-15days on market $99,900 Active 36 DOM
-
2026-06-14days on market $99,900 Active 34 DOM
-
2026-06-13days on market $99,900 Active 33 DOM
-
2026-06-10days on market $99,900 Active 31 DOM
-
2026-06-09days on market $99,900 Active 30 DOM
-
2026-06-08days on market $99,900 Active 29 DOM
-
2026-06-07days on market $99,900 Active 28 DOM
-
2026-06-05days on market $99,900 Active 25 DOM
-
2026-06-02days on market $99,900 Active 23 DOM
-
2026-06-01days on market $99,900 Active 22 DOM
-
2026-05-31days on market $99,900 Active 21 DOM
-
2026-05-30days on market $99,900 Active 20 DOM
-
2026-05-14$99,900 Active 918-char remark
Show marketing remark (918 chars)
Enjoy the practicality of this charming 2-bedroom, 1-bath home situated on a corner lot in a convenient Terre Haute location. Featuring vinyl siding, a 2-year-old shingle roof, fresh paint, some new flooring, and updated electrical, this home offers great curb appeal and thoughtful improvements throughout. Relax on the open front porch before stepping inside to a comfortable living room that flows naturally into the separate dining room, creating an inviting layout for everyday living or entertaining. The large eat-in kitchen provides ample space for meals, storage, and gatherings. A utility room and laundry room add function and convenience, with back-door access to the spacious backyard-perfect for outdoor activities, gardening, pets, or future possibilities. Located close to Collett and Maple Ave Parks, Indiana State University, and Union Hospital, this home also offers easy access to US Hwy 41 and 63.
-
2026-05-10$99,900 Active 918-char remark
-
2026-05-09$99,900 Active
-
2025-08-23$94,900 Active
ⓘ Source: listings_history table (triggers on properties + properties_extension) + one-shot
backfill from property_details.listing_events for pre-trigger history.
Tax reassessment forecast IN · Partial reset (capped growth)
- Current annual tax
- $908 · $76/mo
- Projected year-2 tax
- $908 · $76/mo
- Expected delta
- $0/yr ($0/mo · 0.0%)
ⓘ Screening estimate from a state-policy table — verify with the county assessor before closing.
Climate risk First Street
- Flood 1/10 Low FEMA zone X (unshaded) · 0% chance over 30 yrs
- Wildfire 3/10 Moderate
- Heat 4/10 Moderate 7 d/yr ≥105°F today · 19 d/yr by 30 yrs out
- Wind 2/10 Low 100% chance of damaging wind over 30 yrs
- Air quality 3/10 Moderate 3 unhealthy d/yr today · 4 by 30 yrs out
Nearby sold comps map
Loading sold comps map…
Walkable amenities ~0.75 mi
Loading nearby amenities…
Taxation est. · year 1
- Rental income
- $12,583
- − Mortgage interest
- −$5,596
- − Property taxes
- −$908
- − Insurance
- −$500
- − Repairs & maintenance
- −$1,007
- − Management
- −$1,007
- − Depreciation
- −$2,906
- Taxable income
- $660
- Est. tax owed @ 24.0%
- −$158
- After-tax cash flow
- $2,088/yr
For passive investors: Depreciation is non-cash, so a rental often shows a tax loss while cash-flowing — sheltering income. Rental losses are passive: they offset passive income freely, and up to $25,000/yr can offset ordinary (W-2) income if you actively participate and your MAGI is under $100k (phasing out to $0 by $150k); unused losses carry forward. On sale, claimed depreciation is recaptured at up to 25%, and gains may owe capital-gains tax (a 1031 exchange can defer both). Figures are a year-1 estimate at your 24.0% rate — not tax advice; consult a CPA.
Schools (NCES district)
- District
- Vigo County School Corporation
- NCES district ID
- 1812090
- Math proficiency
- 32% ▼ -10.00%
- Reading proficiency
- 37% ▼ -8.00%
- Median HH income
- $40,100
- Composite
- 28.97/100
- National rank
- #6625
- State rank
- #202 of 301 in IN
Livability — Terre Haute
- Score
- 75/100
- State rank
- #63
- US rank
- #4186
Category grades
Schools grade is shown separately in the Schools card above.
Census & demographics
- Census place
- Terre Haute, IN
- County
- Vigo County · 91,193 people
- City population
- 91,193
- Metro
- Terre Haute, IN
- Population (ZIP)
- 10,553
- Household income
- $40,674
- Rent vs Own
- Severe rent burden
- 414.0
Population outlook (Vigo County) Hauer SSP2
- Today (2025)
- 106,366 people
- By 2030
- 105,674 · -0.7%
- By 2040
- 103,731 · -2.5%
- By 2050
- 101,200 · -4.9%
- By 2075
- 95,674 · -10.1%
- By 2100
- 85,910 · -19.2%
Race, ethnicity, and origin ACS 2023
- Neighborhood character
- Predominantly White (81%)
- Race & ethnicity
- White 81% Hispanic / Latino 7% Black 6% Two or more races 5%
- Hispanic origin (detail)
- Mexican 5% Puerto Rican 1%
- Common ancestry
- Slovak 4% Lithuanian 3% Romanian 2%
- Foreign-born
- 4% · Canada, China
- Languages at home
- 92% English-only · Spanish 7% Chinese 1%
Political lean MEDSL · Vigo
- 2024 margin
- R (+18.1) · D 40.0% · R 58.1% · Other 2.0%
- 2008→2024 swing
- -33.9pp toward R · 2008: 15.8pp · 2024: -18.1pp
- All cycles
- 2024: R+18.1 2020: R+14.7 2016: R+15.2 2012: D+0.8 2008: D+15.8
Not yet ingested
- Civics
- —
Market trends
- HPI YoY
- ▼ -52.33%
- Current HPI
- 164.2961
- Rent YoY
- —
- Metro
- Terre Haute, IN
- State GDP YoY
- ▲ 2.90%
- F500 in state
- 18
Industry mix (Fortune 500 HQ in IN)
| Industry | F500 HQs | Revenue |
|---|---|---|
| Industrial Machinery | 2 | $37B |
|
||
| Healthcare | 1 | $177B |
|
||
| Pharmaceuticals | 1 | $45B |
|
||
| Metals / Steel | 1 | $18B |
|
||
| Agriculture | 1 | $17B |
|
||
| Packaging | 1 | $12B |
|
||
Price history
+5.3% since first listed4 events — show timeline
- 2026-05-14 Listed $99,900 MIBOR as Distributed by MLS Grid
- 2026-05-10 Listed $99,900 THAAR
- 2026-05-09 Listed $99,900 THAAR
- 2025-08-23 Listed $94,900 THAAR
Property tax history
-3.4%/yrLatest (2024): $908 · +3.7% YoY. Source: county tax records.
Cash-flow waterfall
monthlySold comps — $/sqft
last 12 mo · ≤1 miLoading sold comps…