661 Bering Dr #407 · Houston, TX
Flood risk 7/10 · Major
- FEMA flood zone
- X (unshaded)
- Chance of flooding over 30 yrs
- 0.99%
- Est. flood insurance / yr
- $507 – $1,088
Fire risk 1/10 · Minimal
- Est. fire insurance / yr
- $1,222 – $2,270
Heat risk 9/10 · Severe
- Hot days now (above 109°F)
- 7 days/yr
- Hot days in 30 yrs
- 23 days/yr
Wind risk 9/10 · Severe
- Chance of severe wind over 30 yrs
- 99.0%
Air-quality risk 3/10 · Minor
- Unhealthy air days now
- 3 days/yr
- Unhealthy air days in 30 yrs
- 3 days/yr
Risk factors via First Street. Map © Google.
Why this score? — see what drove the D grade
The composite is a weighted blend of 9 inputs, each scored 0–100. Each bar is that input's sub-score; the figure is the points it added to the 100-point composite (weight × sub-score).
- ARV discount +15.0/15.0
- 1% rule +10.0/10.0
- Appreciation +4.4/10.0
- Livability +3.7/5.0
- Schools +2.7/10.0
- Condition / age +2.5/5.0
- Rent growth +2.0/5.0
- Cash flow +0.0/30.0
- DSCR +0.0/10.0
$85,000
🖨 Deal sheet 📄 Offer letter ✓ Due diligence
Listing remarks MLS
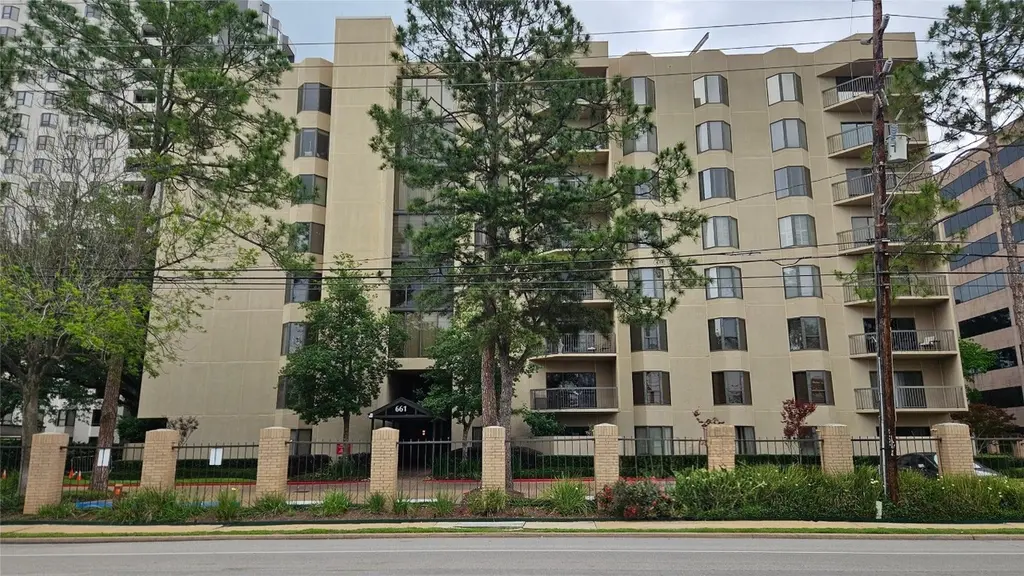
A wonderfully located building in the Galleria/Tanglewood area. The ''Woodway Place Atrium Condo. '' has 24 hr. manned, controlled access, on site management, a lovely pool, spa, outdoor kitchen, lanai, tennis courts and a beautiful atrium lobby. Very near the Galleria and very close to fine restaurants and shopping. Unit # 407 has a great floor plan and would be a fine unit for a buyer to redo to make it their fine Mid-rise home. All the appliances remain. ''As Is'' sale.
Key facts
- Private balcony
- Community amenities
- Secured access
Tags
Property features AI
Finance
- Other: Lot approximately 85,226 square feet
- HOA & community: Association: WPAC 661 Bering; Monthly association fee of $1,296 covering common areas and recreation facilities
Exterior
- Security: Gated community; Guarded community
- Utilities: Public water; Public sewer
- Home design: Residential single-story home; Entry level: First floor; Built in 1980
- Construction: Brick construction; Slab foundation
- Exterior features: Community pool; Gated community; Guarded community
Interior
- Kitchen: Kitchen
- Bedrooms: Primary bedroom (First floor); Bedroom (First floor)
- Bathrooms: 2 full bathrooms
- Heating & cooling: Central heating (electric); Central air conditioning (electric)
- Interior features: Open living room; Dining area
Neighborhood map
What this means for you Summary
Snapshot
- This is a 2-bed/2.0-bath condo listed at $85k.
Deal economics
- At list price, monthly cash flow is $-618 ($-7k/yr) — negative.
- To cash-flow at today's rent, offer at most $24k (71.8% below list).
- Meets the 1% rule at list price ($2k rent vs $85k).
- Recommended offer: $24k (71.8% below list) — sets the bar for cash-flow.
- Cap rate -1.5% vs local median 3.2% in Houston — below-typical yield; the buyer is paying a premium for something (appreciation thesis, condition, location) that the cap rate doesn't capture.
Location & tenants
- Location reads 74/100 on livability (#184 in TX, #4,771 nationally) — a middle-class / working-renter tenant base. Strengths: amenities A+, cost of living A+, housing A+; Watch: crime F.
- Houston ISD (urban): math 27% / reading 35% proficiency, ranked #593 of 826 in TX (top 72%) — families likely to look elsewhere, expect single-tenant / working-renter base with shorter leases; 71% free/reduced lunch — lower-income household profile, screen leases tightly.
- Zoned schools: Briargrove El (math 33% / reading 42%, grade F, #1,744 of 4,322 statewide, top 41%, 836 students, 56% FRL); Tanglewood Middle (math 29% / reading 42%, grade F, #827 of 1,662 statewide, top 51%, 808 students, 62% FRL); Wisdom H S (math 17% / reading 16%, grade F, #1,497 of 1,632 statewide, top 92%, 2,260 students, 97% FRL) — zoned schools at 71% FRL track the district average.
- Market conditions: Rents soft (-1.8%/yr); 389 active listings in the ZIP; 40 comparable units currently listed for rent nearby; rentals at typical pace (median 25d on market — plan ~3-4 weeks tenant-placement turnaround); 45% of comp listings sitting > 30 days — soft ceiling on asking rent; 29,883 units permitted in Harris County in 2024 (8,621 in 5+ unit buildings).
- This rent runs 35% of the median local income ($67k/yr) — at the standard rent-burdened threshold; future hikes will face affordability resistance.
Forward outlook
- Local home prices are declining (-1.2%/yr); year-one equity from $588 of loan paydown is wiped out by about $1k of value loss. Plan a longer hold.
- Harris County population projected at +47% by 2050 — long-run rental-demand tailwind backs the buy-and-hold thesis.
Negotiation context
- It's been on market 55 days — a 3% lower offer ($82k) is reasonable based on typical stale-listing flexibility.
- 3 sale attempts since 9y ago; this cycle's ask has dropped $10k (11%) from the opening price — seller is motivated, your offer sets the floor, not the list.
Risks & watch-outs
- Watch-outs: property tax is 4.3% of price; flood insurance adds $66/mo; HOA is 67% of rent.
- Climate carrying-cost: major flood risk; severe wind risk, 99% chance of damaging wind over 30y; extreme-heat days projected 7→23/yr by 2055 (HVAC capex compounding) — expect insurance premiums to compound above CPI over the hold.
Questions for the listing agent
- What do current leases actually rent for vs. the listed asking? Can we see a recent rent roll and the last 12 months of T-12 income?
- It's been on market 55 days. Have you received any prior offers? Is the seller open to a 72% concession, seller financing, or rate buy-down credit?
- Property tax is high relative to price — has the assessment been appealed recently, and will the sale trigger a re-assessment?
- What's the actual annual flood-insurance premium (NFIP or private), and is the property in a SFHA with mandatory coverage?
- What does the HOA fee cover, when was the last increase, and are there any pending special assessments or reserve-fund shortfalls?
- Any open or pending special assessments — roof, HVAC, plumbing, elevator, façade? What's the per-unit balance and payoff schedule, and is the seller paying it off at close or rolling it to the buyer?
- Is there a deadline driving the sale (1031 exchange, divorce, estate, relocation)? That informs how much negotiation room exists.
- Schools are D-rated, which usually means shorter tenancies and higher turnover. Who's the typical renter profile here, and what's been the actual vacancy rate?
- Crime grade is F in this area — have there been break-ins, vandalism, or insurance claims at this property in the last 3 years? What carrier currently insures it and at what premium?
- The area grade is low — what's the realistic commute time and amenity access for the typical tenant pool here? Any planned neighborhood developments (good or bad) we should know about?
- What's the average days-on-market for RENTAL listings here right now (not sales)? A rising rental-DOM trend means longer vacancies and softer asking-rent achievability than the comps imply.
- What's the recent tenant-quality profile in this submarket — average credit score on applications, eviction rate, late-payment / NSF rate, and stable-employment percentage? A property-management company in the area should have these aggregated.
- How much new apartment / multifamily construction is in the pipeline within 1–3 miles? Heavy new supply (>2% of stock underway) typically softens rents 12–24 months out; light construction supports rent growth.
Investment metrics
- 1% rule
- 2.28% ✓
- Cap rate
- -1.49%
- Cash-on-cash
- -27.80%
- DSCR
- -0.24
- GRM
- 3.7
CMA / ARV
- ARV (median comp)
- $168,138
- List price
- $85,000
- Delta
- -49.45%
- Verdict
- UNDERPRICED
- Comps
- 20 within 1.0 mi
Projected returns pro-forma
-1.23% appreciation · 0.0% rent growth · sell at horizon
- IRR
- -62.7%
- Equity multiple
- -1.16×
- Total profit
- $-51,319
- Equity at exit
- $19,576
- IRR
- -80.9%
- Equity multiple
- -3.51×
- Total profit
- $-107,236
- Equity at exit
- $19,764
Cash invested: $23,800 (down + closing). Projections, not guarantees.
Landlord ↔ Tenant lean methodology
- Overall (STATE)
- 87 Strongly Landlord-Friendly
- State Texas
- 87 Strongly Landlord-Friendly · R+5
- County
- — inherits STATE
- City
- — inherits STATE
ZIP-level market 77057
- Home prices YoY
- -0.7%
- Rents YoY
- -1.8%
- Active inventory
- 389
- Price-to-rent
- 3.7×
Monthly cashflow live
- Estimated rent
- $1,934 high interval (Pro) →
- Mortgage (P&I)
- −$446
- Tax from tax record
- −$302 /mo · $3,628/yr
- Insurance
- −$35
- Flood insurance flood zone
- −$66 /mo · $798/yr
- HOA
- −$1,296
- Vacancy / Maint / Mgmt
- −$406
- Net cashflow
- $-618
Break-even live
UW: 25.0% down · 7.5% · 30yr · 1.5% tax · 5.0% vac · 8.0% maint · 8.0% mgmt
Financing live
Cash to close
- Down payment
- $21,250
- Closing costs
- $2,550
- Reserves months
- —
- Total cash needed
- —
Loan-product check · same deal, 3 products live
Conventional
25% down · 7.5% · 30yr
- Down + closing
- —
- Monthly P&I
- —
- Monthly cashflow
- —
- DSCR
- —
- Eligible?
- —
Personal DTI + credit; lowest rate.
DSCR
20% down · 8.5% · 30yr
- Down + closing
- —
- Monthly P&I
- —
- Monthly cashflow
- —
- DSCR
- —
- Eligible?
- —
No personal income docs; deal must DSCR.
Hard money
10% down · 12.0% · 12mo
- Down + closing
- —
- Monthly P&I
- —
- Monthly cashflow
- —
- DSCR
- —
- Eligible?
- —
Short-term bridge; refi at stabilization.
Rent comps 40 comps
| Address | Beds | Baths | Sqft | Rent | $/sqft | DOM | Units | Dist |
|---|---|---|---|---|---|---|---|---|
| 661 Bering Dr Houston, TX | 3.0 | 2.0 | 1698 | $3,500 | $2.06 | 44d | 1 | 0.01mi |
| 651 Bering Dr Unit 2668 Houston, TX | 2.0 | 2.0 | 1328 | $1,753 | $1.32 | 44d | 1 | 0.04mi |
| 651 Bering Dr Unit 1984 Houston, TX | 2.0 | 2.0 | 1302 | $1,777 | $1.36 | 44d | 1 | 0.04mi |
| 5800 Woodway Dr Houston, TX | 1.0–2.0 | 1.0–2.0 | 1153 | $1,772 | $1.54 | 11d | 14 | 0.12mi |
| 5700 Green Tree Rd Houston, TX | 2.0 | 2.0 | 1168 | $1,700 | $1.46 | 44d | 1 | 0.24mi |
| 824 Bering Dr Unit 2162 Houston, TX | 2.0 | 2.0 | 1724 | $2,415 | $1.40 | 8d | 1 | 0.35mi |
| 824 Bering Dr Unit 2187 Houston, TX | 2.0 | 2.0 | 1724 | $2,407 | $1.40 | 3d | 1 | 0.35mi |
| 824 Bering Dr Unit 861 Houston, TX | 2.0 | 2.0 | 1724 | $2,439 | $1.41 | 11d | 1 | 0.35mi |
| 1100 Augusta Dr Houston, TX | 1.0–2.0 | 1.0 | 909 | $1,550 | $1.71 | 44d | 3 | 0.49mi |
| 1100 Bering Dr Houston, TX | 1.0–2.0 | 1.0–2.0 | 828 | $1,505 | $1.82 | 2d | 9 | 0.50mi |
| 1111 Bering Dr Unit 28 Houston, TX | 2.0 | 2.0 | 1328 | $1,788 | $1.35 | 44d | 1 | 0.51mi |
| 1111 Bering Dr Unit 125 Houston, TX | 1.0 | 1.0 | 898 | $1,145 | $1.28 | 44d | 1 | 0.51mi |
| 1111 Bering Dr Unit 1086 Houston, TX | 2.0 | 2.0 | 1482 | $1,725 | $1.16 | 44d | 1 | 0.51mi |
| 1111 Bering Dr Unit 6252 Houston, TX | 2.0 | 2.0 | 1447 | $2,239 | $1.55 | 44d | 1 | 0.51mi |
| 1111 Bering Dr Unit 1902 Houston, TX | 2.0 | 2.0 | 1318 | $2,100 | $1.59 | 44d | 1 | 0.51mi |
| 1112 Bering Dr #67 Houston, TX | 2.0 | 2.5 | 1610 | $2,200 | $1.37 | 24d | 1 | 0.55mi |
| 1300 Augusta Dr Unit 2-9985 Houston, TX | 1.0 | 1.0 | 898 | $1,225 | $1.36 | 44d | 1 | 0.61mi |
| 1300 Augusta Dr Unit 2958 Houston, TX | 2.0 | 2.0 | 1285 | $1,785 | $1.39 | 44d | 1 | 0.61mi |
| 1300 Augusta Dr Unit 7258 Houston, TX | 2.0 | 2.0 | 1358 | $1,702 | $1.25 | 44d | 1 | 0.61mi |
| 1441 Bering Dr Houston, TX | 2.0 | 2.5 | 1767 | $2,312 | $1.31 | 2d | 3 | 0.68mi |
| 500 Sage Rd Houston, TX | 2.0 | 2.0 | 1265 | $2,775 | $2.19 | 24d | 1 | 0.71mi |
| 5740 San Felipe St Houston, TX | 2.0 | 1.0–2.0 | 933 | $2,848 | $3.05 | 2d | 25 | 0.78mi |
| 1300 Bering Dr Houston, TX | 2.0 | 2.0 | 973 | $1,520 | $1.56 | 24d | 1 | 0.83mi |
| 5665 San Felipe St Houston, TX | 1.0 | 1.0 | 1088 | $2,653 | $2.44 | 24d | 1 | 0.84mi |
| 1617 Fountain View Dr Unit 1674 Houston, TX | 2.0 | 2.0 | 893 | $1,292 | $1.45 | 3d | 1 | 0.84mi |
| 1617 Fountain View Dr Unit 2047 Houston, TX | 2.0 | 2.0 | 893 | $1,335 | $1.49 | 11d | 1 | 0.84mi |
| 1617 Fountain View Dr Unit 2047 Houston, TX | 2.0 | 2.0 | 893 | $1,292 | $1.45 | 19d | 1 | 0.84mi |
| 1000 Yorktown St Houston, TX | 2.0 | 2.0 | 1285 | $1,800 | $1.40 | 44d | 1 | 0.85mi |
| 1801 Bering Dr Houston, TX | 1.0–2.0 | 1.0–2.0 | 819 | $1,535 | $1.87 | 1d | 8 | 0.88mi |
| 5010 Woodway Dr Houston, TX | 1.0–2.0 | 1.0–2.0 | 736 | $1,585 | $2.15 | 44d | 1 | 0.93mi |
| 502 S Post Oak Ln Houston, TX | 1.0–2.0 | 1.0–2.0 | 963 | $1,650 | $1.71 | 3d | 8 | 0.94mi |
| 813 S Post Oak Ln Houston, TX | 3.0 | 2.0 | 1580 | $3,145 | $1.99 | 44d | 1 | 0.97mi |
| 1819 Augusta Dr Houston, TX | 2.0 | 2.0–2.5 | 1167 | $1,487 | $1.27 | 15d | 5 | 0.99mi |
| 1818 Augusta Dr Houston, TX | 2.0 | 1.0 | 995 | $1,575 | $1.58 | 44d | 1 | 1.00mi |
| 807 S Post Oak Ln Houston, TX | 1.0–2.0 | 1.0–2.0 | 970 | $2,460 | $2.54 | 3d | 18 | 1.01mi |
| 1885 Augusta Dr Houston, TX | 2.0 | 2.0 | 1350 | $1,650 | $1.22 | 44d | 1 | 1.05mi |
| 1697 Sage Rd Houston, TX | 2.0 | 2.0 | 1209 | $3,650 | $3.02 | 19d | 1 | 1.06mi |
| 1697 Sage Rd Unit APO2 Houston, TX | 2.0 | 2.0 | 1209 | $3,650 | $3.02 | 24d | 1 | 1.06mi |
| 7 Riverway Houston, TX | 1.0–2.0 | 1.0–2.0 | 1503 | $5,869 | $3.90 | 1d | 7 | 1.06mi |
| 1901 Augusta Dr Houston, TX | 1.0–2.0 | 1.0–2.0 | 934 | $1,715 | $1.84 | 2d | 14 | 1.08mi |
HOA detail condo
- Monthly dues
- $1,296 · $15,552/yr
- Likely covers
- pool
- Assessments
- None detected in remarks — confirm with the listing agent.
Listing history 21 events
-
2026-06-18days on market $85,000 Active 55 DOM
-
2026-06-17days on market $85,000 Active 54 DOM
-
2026-06-16days on market $85,000 Active 53 DOM
-
2026-06-15pricedays on market $85,000 Active 52 DOM
-
2026-06-13days on market $95,000 Active 50 DOM
-
2026-06-10days on market $95,000 Active 46 DOM
-
2026-06-08days on market $95,000 Active 45 DOM
-
2026-06-07days on market $95,000 Active 44 DOM
-
2026-06-04days on market $95,000 Active 41 DOM
-
2026-06-01days on market $95,000 Active 38 DOM
-
2026-05-31days on market $95,000 Active 37 DOM
-
2026-04-24$95,000 Active 527-char remark
-
2024-09-28historical $1,265
-
2024-07-26$1,265
-
2017-03-27soldstatus
-
2017-03-23soldstatus Sold 477-char remark
Show marketing remark (477 chars)
A wonderfully located building in the Galleria/Tanglewood area. The ''Woodway Place Atrium Condo. '' has 24 hr. manned, controlled access, on site management, a lovely pool, spa, outdoor kitchen, lanai, tennis courts and a beautiful atrium lobby. Very near the Galleria and very close to fine restaurants and shopping. Unit # 407 has a great floor plan and would be a fine unit for a buyer to redo to make it their fine Mid-rise home. All the appliances remain. ''As Is'' sale.
-
2017-03-20status Pending 477-char remark
Show marketing remark (477 chars)
A wonderfully located building in the Galleria/Tanglewood area. The ''Woodway Place Atrium Condo. '' has 24 hr. manned, controlled access, on site management, a lovely pool, spa, outdoor kitchen, lanai, tennis courts and a beautiful atrium lobby. Very near the Galleria and very close to fine restaurants and shopping. Unit # 407 has a great floor plan and would be a fine unit for a buyer to redo to make it their fine Mid-rise home. All the appliances remain. ''As Is'' sale.
-
2017-03-13status Option Pending 477-char remark
Show marketing remark (477 chars)
A wonderfully located building in the Galleria/Tanglewood area. The ''Woodway Place Atrium Condo. '' has 24 hr. manned, controlled access, on site management, a lovely pool, spa, outdoor kitchen, lanai, tennis courts and a beautiful atrium lobby. Very near the Galleria and very close to fine restaurants and shopping. Unit # 407 has a great floor plan and would be a fine unit for a buyer to redo to make it their fine Mid-rise home. All the appliances remain. ''As Is'' sale.
-
2017-03-07price $163,750 477-char remark
Show marketing remark (477 chars)
A wonderfully located building in the Galleria/Tanglewood area. The ''Woodway Place Atrium Condo. '' has 24 hr. manned, controlled access, on site management, a lovely pool, spa, outdoor kitchen, lanai, tennis courts and a beautiful atrium lobby. Very near the Galleria and very close to fine restaurants and shopping. Unit # 407 has a great floor plan and would be a fine unit for a buyer to redo to make it their fine Mid-rise home. All the appliances remain. ''As Is'' sale.
-
2017-01-17$169,500 Active 477-char remark
Show marketing remark (477 chars)
A wonderfully located building in the Galleria/Tanglewood area. The ''Woodway Place Atrium Condo. '' has 24 hr. manned, controlled access, on site management, a lovely pool, spa, outdoor kitchen, lanai, tennis courts and a beautiful atrium lobby. Very near the Galleria and very close to fine restaurants and shopping. Unit # 407 has a great floor plan and would be a fine unit for a buyer to redo to make it their fine Mid-rise home. All the appliances remain. ''As Is'' sale.
-
1990-07-25soldstatus
ⓘ Source: listings_history table (triggers on properties + properties_extension) + one-shot
backfill from property_details.listing_events for pre-trigger history.
Tax reassessment forecast TX · Resets to sale price
- Current annual tax
- $3,628 · $302/mo
- Projected year-2 tax
- $3,628 · $302/mo
- Expected delta
- $0/yr ($0/mo · 0.0%)
ⓘ Screening estimate from a state-policy table — verify with the county assessor before closing.
Climate risk First Street
- Flood 7/10 Severe FEMA zone X (unshaded) · 99% chance over 30 yrs
- Wildfire 1/10 Low
- Heat 9/10 Extreme 7 d/yr ≥109°F today · 23 d/yr by 30 yrs out
- Wind 9/10 Extreme 99% chance of damaging wind over 30 yrs
- Air quality 3/10 Moderate 3 unhealthy d/yr today · 3 by 30 yrs out
Nearby sold comps map
Loading sold comps map…
Walkable amenities ~0.75 mi
Loading nearby amenities…
Taxation est. · year 1
- Rental income
- $23,211
- − Mortgage interest
- −$4,761
- − Property taxes
- −$3,628
- − Insurance
- −$1,222
- − Repairs & maintenance
- −$1,857
- − Management
- −$1,857
- − HOA
- −$15,552
- − Depreciation
- −$2,473
- Taxable loss
- −$8,139
- Est. tax savings @ 24.0%
- +$1,953
- After-tax cash flow
- $-5,461/yr
For passive investors: Depreciation is non-cash, so a rental often shows a tax loss while cash-flowing — sheltering income. Rental losses are passive: they offset passive income freely, and up to $25,000/yr can offset ordinary (W-2) income if you actively participate and your MAGI is under $100k (phasing out to $0 by $150k); unused losses carry forward. On sale, claimed depreciation is recaptured at up to 25%, and gains may owe capital-gains tax (a 1031 exchange can defer both). Figures are a year-1 estimate at your 24.0% rate — not tax advice; consult a CPA.
Schools (NCES district)
- District
- Houston ISD
- NCES district ID
- 4823640
- Math proficiency
- 27% ▼ -18.00%
- Reading proficiency
- 35% ▼ -6.00%
- Median HH income
- $46,054
- Composite
- 26.63/100
- National rank
- #7173
- State rank
- #593 of 826 in TX
Livability — Houston
- Score
- 74/100
- State rank
- #184
- US rank
- #4771
Category grades
Schools grade is shown separately in the Schools card above.
Census & demographics
- Census place
- Houston, TX
- County
- Harris County · 4,702,590 people
- City population
- 3,226,434
- Metro
- Houston-The Woodlands-Sugar Land, TX
- Population (ZIP)
- 46,569
- Household income
- $66,971
- Rent vs Own
- Severe rent burden
- 3533.0
Population outlook (Harris County) Hauer SSP2
- Today (2025)
- 5,571,493 people
- By 2030
- 6,089,821 · +9.3%
- By 2040
- 7,142,806 · +28.2%
- By 2050
- 8,185,864 · +46.9%
- By 2075
- 10,574,329 · +89.8%
- By 2100
- 12,109,958 · +117.4%
Race, ethnicity, and origin ACS 2023
- Neighborhood character
- Diverse neighborhood (Simpson 0.69)
- Race & ethnicity
- Hispanic / Latino 38% White 37% Two or more races 22% Black 12% Asian 10% Native American 1%
- Hispanic origin (detail)
- Mexican 13% Cuban 1%
- Common ancestry
- Italian 3% Lithuanian 2% Slovak 1%
- Foreign-born
- 38% · Canada, China, Jamaica
- Languages at home
- 50% English-only · Spanish 33% Other Indo-European 6% Other Asian/Pacific 3%
Political lean MEDSL · Harris
- 2024 margin
- Lean D (+5.5) · D 52.0% · R 46.4% · Other 1.6%
- 2008→2024 swing
- +3.9pp toward D · 2008: 1.6pp · 2024: 5.5pp
- All cycles
- 2024: D+5.5 2020: D+13.3 2016: D+12.4 2012: D+0.1 2008: D+1.6
Not yet ingested
- Civics
- —
Market trends
- HPI YoY
- ▼ -1.23%
- Current HPI
- 167.8863
- Rent YoY
- ▼ -1.83%
- Metro
- Houston-The Woodlands-Sugar Land, TX
- State GDP YoY
- ▲ 3.95%
- F500 in state
- 110
Industry mix (Fortune 500 HQ in TX)
| Industry | F500 HQs | Revenue |
|---|---|---|
| Energy | 16 | $1,198B |
|
||
| Technology | 5 | $198B |
|
||
| Engineering / Construction | 4 | $72B |
|
||
| Energy Services | 3 | $60B |
|
||
| Utilities | 3 | $41B |
|
||
| Healthcare | 2 | $330B |
|
||
Price history
-49.9% since first listed11 events — show timeline
- 2026-06-13 Price Changed $85,000 HARMLS
- 2026-04-24 Listed $95,000 HARMLS
- 2024-09-28 Rental Removed $1,265 SHOWMOJO
- 2024-07-26 Listed for Rent $1,265 SHOWMOJO
- 2017-03-27 Sold (Public Records) — Public Records
- 2017-03-23 Sold (MLS) — HARMLS
- 2017-03-20 Pending — HARMLS
- 2017-03-13 Pending — HARMLS
- 2017-03-07 Price Changed $163,750 HARMLS
- 2017-01-17 Listed $169,500 HARMLS
- 1990-07-25 Sold (Public Records) — Public Records
Property tax history
+4.1%/yrLatest (2025): $3,628 · +7.8% YoY. Source: county tax records.
Cash-flow waterfall
monthlySold comps — $/sqft
last 12 mo · ≤1 miLoading sold comps…