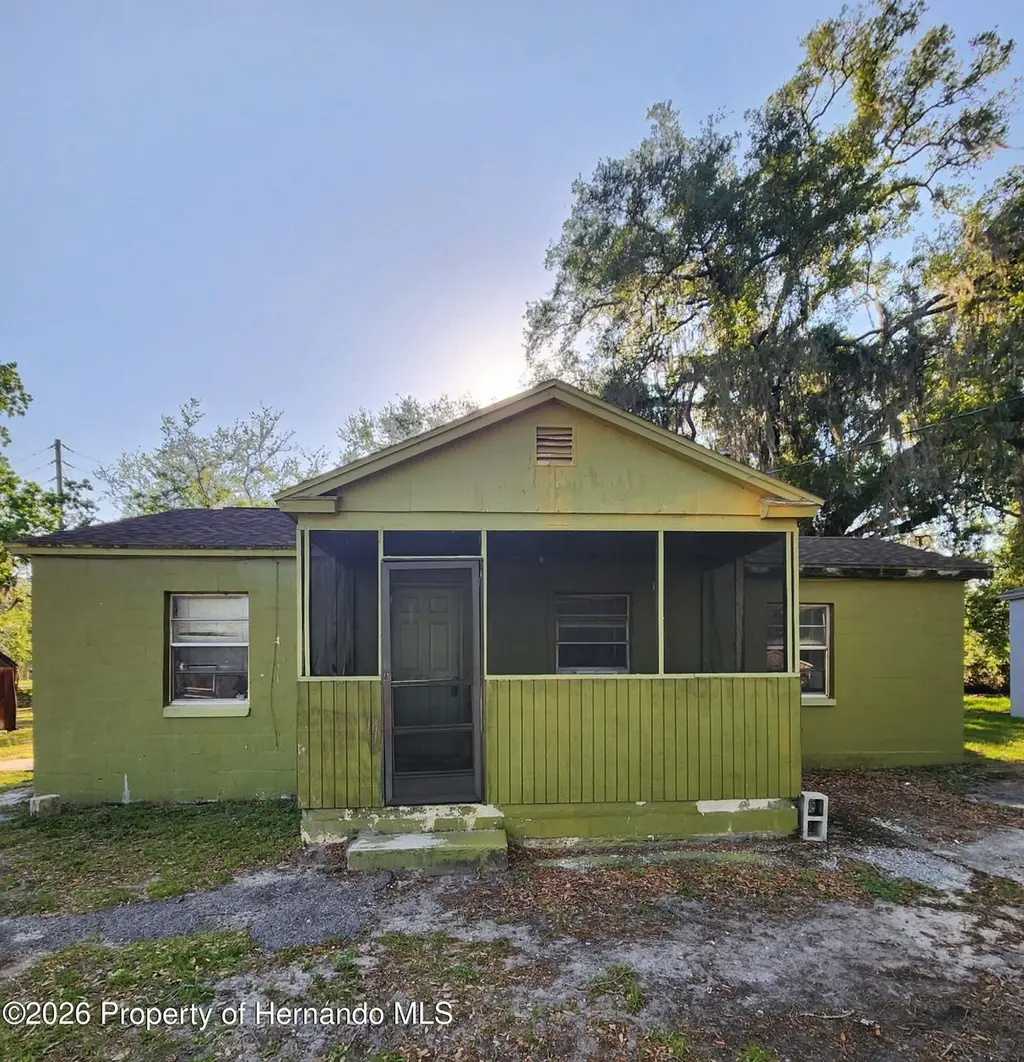
716 Hazel Ave · Brooksville, FL
Flood risk 1/10 · Minimal
- FEMA flood zone
- X (unshaded)
- Chance of flooding over 30 yrs
- 0.0%
- Est. flood insurance / yr
- $507 – $1,088
Fire risk 5/10 · Moderate
- Est. fire insurance / yr
- $947 – $1,759
Heat risk 9/10 · Severe
- Hot days now (above 109°F)
- 7 days/yr
- Hot days in 30 yrs
- 26 days/yr
Wind risk 9/10 · Severe
- Chance of severe wind over 30 yrs
- 99.0%
Air-quality risk 2/10 · Minimal
- Unhealthy air days now
- 1 days/yr
- Unhealthy air days in 30 yrs
- 1 days/yr
Risk factors via First Street. Map © Google.
Why this score? — see what drove the B grade
The composite is a weighted blend of 9 inputs, each scored 0–100. Each bar is that input's sub-score; the figure is the points it added to the 100-point composite (weight × sub-score).
- Cash flow +30.0/30.0
- 1% rule +10.0/10.0
- DSCR +10.0/10.0
- ARV discount +7.5/15.0
- Schools +4.2/10.0
- Livability +3.6/5.0
- Rent growth +2.5/5.0
- Condition / age +2.5/5.0
- Appreciation +0.0/10.0
$75,000
🖨 Deal sheet 📄 Offer letter ✓ Due diligence
Listing remarks
Looking for your next project? This 3/1 Brooksville investment special is ready for a full transformation. Whether you are looking to renovate and hold as a long-term rental or execute a quick flip, 716 Hazel Ave offers the perfect canvas. Conveniently located just 10 minutes from public transit, this home offers great accessibility for future tenants or buyers. Don't miss out on the sister property next door (718 Hazel Ave) also available for purchase. Opportunities like this don't last--schedule your showing today and start crunching the numbers!
Key facts
- 5,761 sq ft lot
- Built 1947
- Listed 15 days
Property features AI
Exterior
- Parking: Other parking
- Utilities: Public water; Public sewer; Electricity available; Sewer connected; Water available
- Home design: Single-family residence; Residential property
- Construction: Block construction; Built on block foundation
- Exterior features: Lot in city limits; Lot features: Other; Subdivision: Shady Brook Park
Interior
- Bathrooms: 1 full bathroom
- Heating & cooling: Electric heat; Wall/window AC units
- Interior features: Wall/window air conditioning units; Electric heating
Neighborhood map
What this means for you Summary
Snapshot
- This is a 2-bed/1.0-bath single-family listed at $75k.
Deal economics
- At list price, monthly cash flow is $505 ($6k/yr) — positive.
- The deal already cash-flows at list — no discount required.
- Meets the 1% rule at list price ($1k rent vs $75k).
- Recommended offer: $74k (1.5% below list) — sets the bar for market timing.
- Cap rate 14.4% vs local median 0.6% in Brooksville — top-decile yield for the area; either an underpriced asset or a hidden risk that comps aren't pricing in. Stress-test before assuming the spread holds.
Location & tenants
- Location reads 71/100 on livability (#377 in FL) — a middle-class / working-renter tenant base. Strengths: cost of living A+, housing A+, health & safety A+; Watch: crime D, amenities F, commute F.
- Hernando (suburban): math 50% / reading 50% proficiency, ranked #38 of 73 in FL (top 52%) — acceptable for families but not a draw, mixed tenant base, ~2y average lease.
- Zoned schools: Moton Elementary School (math 46% / reading 39%, grade F, #1,383 of 2,144 statewide, top 65%, 679 students, 79% FRL); D. S. Parrott Middle School (math 40% / reading 40%, grade F, #368 of 571 statewide, top 65%, 835 students, 67% FRL); Hernando High School (math 42% / reading 42%, grade F, #275 of 667 statewide, top 42%, 1,299 students, 58% FRL).
- Market conditions: Rents flat; 492 active listings in the ZIP; 10 comparable units currently listed for rent nearby; rentals at typical pace (median 25d on market — plan ~3-4 weeks tenant-placement turnaround); 2,505 units permitted in Hernando County in 2024 (318 in 5+ unit buildings).
Forward outlook
- Local home prices are declining (-3.0%/yr); year-one equity from $519 of loan paydown is wiped out by about $2k of value loss. Plan a longer hold.
- Hernando County population projected at +11% by 2050 — modest demand growth; plan on rents tracking national, not racing it.
- At projected returns (-3.0% appreciation + 0.2% rent growth), your $21k cash investment doubles in ~5 years — after that, you're playing with house money.
Negotiation context
- It's been on market 15 days — a 2% lower offer ($74k) is reasonable based on typical stale-listing flexibility.
- Current owner paid $12k; list at $75k implies a 547% gain — meaningful room to come down on a strong offer.
Risks & watch-outs
- Watch-outs: built in 1947 — expect roof / HVAC / electrical / plumbing capex.
- Climate carrying-cost: severe wind risk, 99% chance of damaging wind over 30y; moderate wildfire risk; extreme-heat days projected 7→26/yr by 2055 (HVAC capex compounding) — expect insurance premiums to compound above CPI over the hold.
Questions for the listing agent
- Built in 1947 — when were the roof, HVAC, electrical panel, plumbing, and water heater last replaced?
- Is there a deadline driving the sale (1031 exchange, divorce, estate, relocation)? That informs how much negotiation room exists.
- Crime grade is D in this area — have there been break-ins, vandalism, or insurance claims at this property in the last 3 years? What carrier currently insures it and at what premium?
- What's the average days-on-market for RENTAL listings here right now (not sales)? A rising rental-DOM trend means longer vacancies and softer asking-rent achievability than the comps imply.
- What's the recent tenant-quality profile in this submarket — average credit score on applications, eviction rate, late-payment / NSF rate, and stable-employment percentage? A property-management company in the area should have these aggregated.
- How much new for-sale + rental construction is in the pipeline within 1–3 miles? Heavy new supply typically softens prices + rents 12–24 months out; constrained supply supports both.
Investment metrics
- 1% rule
- 1.73% ✓
- Cap rate
- 14.37%
- Cash-on-cash
- 28.86%
- DSCR
- 2.28
- GRM
- 4.8
CMA / ARV
No comps found within radius.
Projected returns pro-forma
-3.0% appreciation · 0.19% rent growth · sell at horizon
- IRR
- 20.0%
- Equity multiple
- 1.78×
- Total profit
- $16,468
- Equity at exit
- $11,183
- IRR
- 26.2%
- Equity multiple
- 3.00×
- Total profit
- $41,998
- Equity at exit
- $6,485
Cash invested: $21,000 (down + closing). Projections, not guarantees.
Landlord ↔ Tenant lean methodology
- Overall (STATE)
- 87 Strongly Landlord-Friendly
- State Florida
- 87 Strongly Landlord-Friendly · R+3
- County
- — inherits STATE
- City
- — inherits STATE
ZIP-level market 34601
- Home prices YoY
- -29.7%
- Rents YoY
- 0.2%
- Active inventory
- 492
- Price-to-rent
- 4.8×
Monthly cashflow live
- Estimated rent
- $1,299 high interval (Pro) →
- Mortgage (P&I)
- −$393
- Tax from tax record
- −$96 /mo · $1,155/yr
- Insurance
- −$31
- HOA
- −$0
- Vacancy / Maint / Mgmt
- −$273
- Net cashflow
- $505
Break-even live
UW: 25.0% down · 7.5% · 30yr · 1.5% tax · 5.0% vac · 8.0% maint · 8.0% mgmt
Financing live
Cash to close
- Down payment
- $18,750
- Closing costs
- $2,250
- Reserves months
- —
- Total cash needed
- —
Loan-product check · same deal, 3 products live
Conventional
25% down · 7.5% · 30yr
- Down + closing
- —
- Monthly P&I
- —
- Monthly cashflow
- —
- DSCR
- —
- Eligible?
- —
Personal DTI + credit; lowest rate.
DSCR
20% down · 8.5% · 30yr
- Down + closing
- —
- Monthly P&I
- —
- Monthly cashflow
- —
- DSCR
- —
- Eligible?
- —
No personal income docs; deal must DSCR.
Hard money
10% down · 12.0% · 12mo
- Down + closing
- —
- Monthly P&I
- —
- Monthly cashflow
- —
- DSCR
- —
- Eligible?
- —
Short-term bridge; refi at stabilization.
Rent comps 10 comps
| Address | Beds | Baths | Sqft | Rent | $/sqft | DOM | Units | Dist |
|---|---|---|---|---|---|---|---|---|
| 203 D St Brooksville, FL | 3.0 | 1.0 | 748 | $1,600 | $2.14 | 24d | 1 | 0.40mi |
| 932 Freedom Way Brooksville, FL | 1.0–3.0 | 1.0–2.0 | 917 | $1,266 | $1.38 | 24d | 1 | 0.50mi |
| 460 Hale Ave Brooksville, FL | 1.0–2.0 | 1.0 | 767 | $1,225 | $1.60 | 5d | 2 | 0.52mi |
| 253 Dryden Pl Brooksville, FL | 1.0 | 1.0 | 667 | $1,275 | $1.91 | 24d | 1 | 0.69mi |
| 265 Dryden Pl Brooksville, FL | 1.0 | 1.0 | 667 | $1,229 | $1.84 | 24d | 1 | 0.70mi |
| 217 Oakland Ave Unit 217 Brooksville, FL | 1.0 | 1.0 | 506 | $1,250 | $2.47 | 24d | 1 | 0.74mi |
| 222 Dryden Pl Brooksville, FL | 1.0 | 1.0 | 667 | $1,275 | $1.91 | 5d | 1 | 0.75mi |
| 181 Dryden Pl Brooksville, FL | 1.0–2.0 | 1.0 | 714 | $1,395 | $1.95 | 13d | 4 | 0.78mi |
| 20180 Barnett Rd Brooksville, FL | 1.0–2.0 | 1.0–2.0 | 783 | $999 | $1.28 | 10d | 1 | 1.03mi |
| 965 Candlelight Blvd Brooksville, FL | 1.0–2.0 | 1.0–2.0 | 720 | $1,335 | $1.85 | 3d | 10 | 1.29mi |
Listing history 3 events
-
2026-05-15status Pending
-
2026-04-28$75,000 Active
-
1997-08-12soldstatus $11,600
ⓘ Source: listings_history table (triggers on properties + properties_extension) + one-shot
backfill from property_details.listing_events for pre-trigger history.
Tax reassessment forecast FL · Resets to sale price
- Current annual tax
- $1,155 · $96/mo
- Projected year-2 tax
- $1,155 · $96/mo
- Expected delta
- $0/yr ($0/mo · 0.0%)
ⓘ Screening estimate from a state-policy table — verify with the county assessor before closing.
Climate risk First Street
- Flood 1/10 Low FEMA zone X (unshaded) · 0% chance over 30 yrs
- Wildfire 5/10 Major
- Heat 9/10 Extreme 7 d/yr ≥109°F today · 26 d/yr by 30 yrs out
- Wind 9/10 Extreme 99% chance of damaging wind over 30 yrs
- Air quality 2/10 Low 1 unhealthy d/yr today · 1 by 30 yrs out
Nearby sold comps map
Loading sold comps map…
Walkable amenities ~0.75 mi
Loading nearby amenities…
Taxation est. · year 1
- Rental income
- $15,583
- − Mortgage interest
- −$4,201
- − Property taxes
- −$1,155
- − Insurance
- −$375
- − Repairs & maintenance
- −$1,247
- − Management
- −$1,247
- − Depreciation
- −$2,182
- Taxable income
- $5,177
- Est. tax owed @ 24.0%
- −$1,243
- After-tax cash flow
- $4,819/yr
For passive investors: Depreciation is non-cash, so a rental often shows a tax loss while cash-flowing — sheltering income. Rental losses are passive: they offset passive income freely, and up to $25,000/yr can offset ordinary (W-2) income if you actively participate and your MAGI is under $100k (phasing out to $0 by $150k); unused losses carry forward. On sale, claimed depreciation is recaptured at up to 25%, and gains may owe capital-gains tax (a 1031 exchange can defer both). Figures are a year-1 estimate at your 24.0% rate — not tax advice; consult a CPA.
Schools (NCES district)
- District
- Hernando
- NCES district ID
- 1200810
- Math proficiency
- 50% ▼ -8.00%
- Reading proficiency
- 50% ▼ -4.00%
- Median HH income
- $41,985
- Composite
- 42.03/100
- National rank
- #3329
- State rank
- #38 of 73 in FL
Livability — Brooksville
- Score
- 71/100
- State rank
- #377
- US rank
- #6668
Category grades
Schools grade is shown separately in the Schools card above.
Census & demographics
- Census place
- Brooksville, FL
- County
- Hernando County · 169,677 people
- City population
- 57,094
- Metro
- Tampa-St. Petersburg-Clearwater, FL
- Population (ZIP)
- 24,115
- Household income
- $60,440
- Rent vs Own
- Severe rent burden
- 664.0
Population outlook (Hernando County) Hauer SSP2
- Today (2025)
- 189,218 people
- By 2030
- 194,367 · +2.7%
- By 2040
- 203,398 · +7.5%
- By 2050
- 209,589 · +10.8%
- By 2075
- 218,452 · +15.4%
- By 2100
- 205,923 · +8.8%
Race, ethnicity, and origin ACS 2023
- Neighborhood character
- Predominantly White (77%)
- Race & ethnicity
- White 77% Hispanic / Latino 11% Black 8% Two or more races 5%
- Hispanic origin (detail)
- Puerto Rican 4% Cuban 2% Dominican 1%
- Common ancestry
- Slovak 4% Romanian 2% Iranian 2%
- Foreign-born
- 4% · Canada, Jamaica
- Languages at home
- 93% English-only · Spanish 6%
Political lean MEDSL · Hernando
- 2024 margin
- Solid R (+37.0) · D 31.1% · R 68.2%
- 2008→2024 swing
- -33.5pp toward R · 2008: -3.6pp · 2024: -37.0pp
- All cycles
- 2024: R+37.0 2020: R+30.2 2016: R+29.0 2012: R+8.5 2008: R+3.6
Not yet ingested
- Civics
- —
Market trends
- HPI YoY
- ▼ -132.68%
- Current HPI
- 313.4695
- Rent YoY
- ▲ 0.19%
- Metro
- Tampa-St. Petersburg-Clearwater, FL
- State GDP YoY
- ▲ 3.28%
- F500 in state
- 36
Industry mix (Fortune 500 HQ in FL)
| Industry | F500 HQs | Revenue |
|---|---|---|
| Industrial Technology | 2 | $29B |
|
||
| Insurance | 2 | $17B |
|
||
| Retail | 1 | $60B |
|
||
| Technology Distribution | 1 | $58B |
|
||
| Homebuilding | 1 | $35B |
|
||
| Technology Manufacturing | 1 | $35B |
|
||
Price history
+546.6% since first listed3 events — show timeline
- 2026-05-15 Pending — HCAR
- 2026-04-28 Listed $75,000 HCAR
- 1997-08-12 Sold (Public Records) $11,600 Public Records
Property tax history
+9.8%/yrLatest (2025): $1,155 · +21.9% YoY. Source: county tax records.
Cash-flow waterfall
monthlySold comps — $/sqft
last 12 mo · ≤1 miLoading sold comps…