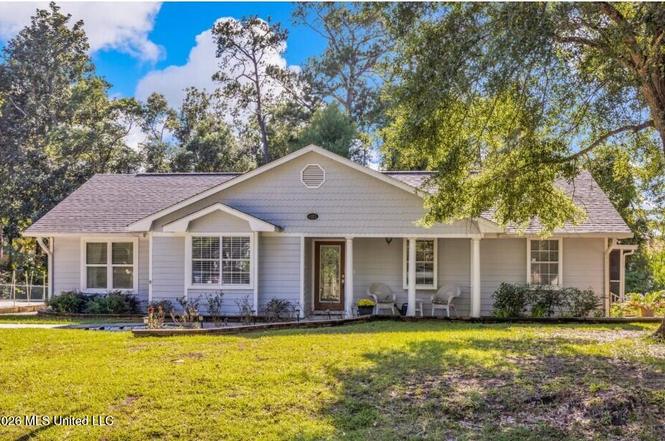
9321 Coconut Dr · Gulf Park Estates, MS
Flood risk 7/10 · Major
- FEMA flood zone
- X (shaded)
- Chance of flooding over 30 yrs
- 0.93%
- Est. flood insurance / yr
- $507 – $1,088
Fire risk 3/10 · Minor
- Est. fire insurance / yr
- $1,241 – $2,305
Heat risk 10/10 · Severe
- Hot days now (above 106°F)
- 7 days/yr
- Hot days in 30 yrs
- 22 days/yr
Wind risk 9/10 · Severe
- Chance of severe wind over 30 yrs
- 99.0%
Air-quality risk 2/10 · Minimal
- Unhealthy air days now
- 1 days/yr
- Unhealthy air days in 30 yrs
- 2 days/yr
Risk factors via First Street. Map © Google.
Why this score? — see what drove the C- grade
The composite is a weighted blend of 9 inputs, each scored 0–100. Each bar is that input's sub-score; the figure is the points it added to the 100-point composite (weight × sub-score).
- Cash flow +19.1/30.0
- ARV discount +7.5/15.0
- DSCR +6.0/10.0
- Schools +5.3/10.0
- 1% rule +3.8/10.0
- Livability +3.5/5.0
- Rent growth +2.8/5.0
- Condition / age +2.5/5.0
- Appreciation +0.0/10.0
$270,000
🖨 Deal sheet 📄 Offer letter ✓ Due diligence
Listing remarks
Welcome home to this beautifully maintained 3-bedroom, 3-bath gem located in the highly desirable Ocean Springs School District! From the moment you arrive, you'll notice the pride of ownership and inviting charm that make this home truly special. Step inside to discover a bright, open layout designed for both comfortable family living and effortless entertaining. The spacious living areas flow seamlessly, creating the perfect setting for gatherings, holidays, or relaxing evenings at home. The well-appointed kitchen offers ample space for cooking and connection, making it the heart of the home. Retreat to the generous primary suite, complete with a private bath and plenty of space to unwind
Key facts
- Screened lanai
- 0.47 acre lot
- Pool
Tags
Property features AI
Finance
- HOA & community: Community offers biking trails, boating, fishing, hiking/walking trails, marina, nearby entertainment and restaurants
Exterior
- Parking: Side-by-side parking with direct access; Concrete and gravel surfaces
- Security: Smoke detectors
- Utilities: Public water; Public sewer; Electricity connected; Cable available; Water and sewer connected
- Home design: Single-family house; One story; Move-in ready; Slab foundation; Shingle roof; Brick veneer and wood siding construction; Corner lot on a cul-de-sac with irregular front yard
- Construction: Built (year source: public records)
- Exterior features: Private in-ground saltwater pool with heater, filter, diving board and screen enclosure; Deck; Enclosed and screened porches (front and rear porch); Fire pit; Garden; Landscaping lights; Exterior lighting; Private yard; Rain gutters; Shed(s); Partial privacy wood fencing in back yard
Interior
- Kitchen: Built-in electric range; Electric cooktop; Induction cooktop; Microwave; Dishwasher; Garbage disposal; Refrigerator; Stainless steel appliances; ENERGY STAR qualified appliances
- Bedrooms: Main-level bedrooms (laundry listed on main level)
- Flooring: Luxury vinyl; Ceramic tile
- Bathrooms: 3 full bathrooms
- Heating & cooling: Central electric heating and cooling; Forced air; Ceiling heating elements; Fireplace heating; Ceiling fans
- Interior features: Cathedral ceilings; Ceiling fans; Entrance foyer; Granite counters; High ceilings; Kitchen island; Open floorplan; Recessed lighting; Soaking tub; Storage; Tray ceilings; Blinds; Double-pane and insulated windows; Storm windows; Deadbolt locks; ENERGY STAR qualified doors; French doors; Mirrored closet doors; Pocket doors; Sliding doors; Has wood-burning fireplace in the living room
- Laundry & utility: Main-level laundry room with washer and electric dryer hookups; Inside laundry
Neighborhood map
What this means for you Summary
Snapshot
- This is a 3-bed/3.0-bath single-family listed at $270k.
Deal economics
- At list price, monthly cash flow is $222 ($3k/yr) — positive.
- The deal already cash-flows at list — no discount required.
- To meet the 1% rule (rent ≥ 1% of price), the offer needs to be $239k (11.6% below list).
- Recommended offer: $239k (11.6% below list) — sets the bar for 1% rule.
- Cap rate 7.6% vs local median 5.2% in Gulf Park Estates — top-decile yield for the area; either an underpriced asset or a hidden risk that comps aren't pricing in. Stress-test before assuming the spread holds.
Location & tenants
- Location reads 70/100 on livability (#43 in MS) — a middle-class / working-renter tenant base. Strengths: crime A+, cost of living A+, housing A+; Watch: schools D+, health & safety D+, amenities F.
- Ocean Springs School District (suburban): math 64% / reading 59% proficiency, ranked #1 of 130 in MS (top 1%) — acceptable for families but not a draw, mixed tenant base, ~2y average lease.
- Market conditions: Rents rising (+1.3%/yr); 714 active listings in the ZIP; 4 comparable units currently listed for rent nearby; rentals leasing fast (median 14d on market — plan ~1-2 weeks tenant-placement turnaround); solid renter incomes; 516 units permitted in Jackson County in 2024 (6 in 5+ unit buildings).
- This rent runs 36% of the median local income ($79k/yr) — at the standard rent-burdened threshold; future hikes will face affordability resistance.
Forward outlook
- Local home prices are declining (-3.0%/yr); year-one equity from $2k of loan paydown is wiped out by about $8k of value loss. Plan a longer hold.
Negotiation context
- It's been on market 81 days — a 6% lower offer ($254k) is reasonable based on typical stale-listing flexibility.
- 9 sale attempts since 21y ago with the ask held roughly flat each time — persistent listings suggest the price (not the market) is what's stuck; bring a comps-based counter.
Risks & watch-outs
- Watch-outs: flood insurance adds $66/mo.
- Climate carrying-cost: major flood risk; severe wind risk, 99% chance of damaging wind over 30y; extreme-heat days projected 7→22/yr by 2055 (HVAC capex compounding) — expect insurance premiums to compound above CPI over the hold.
Questions for the listing agent
- It's been on market 81 days. Have you received any prior offers? Is the seller open to a 12% concession, seller financing, or rate buy-down credit?
- What's the actual annual flood-insurance premium (NFIP or private), and is the property in a SFHA with mandatory coverage?
- Why hasn't it sold? Are there any deal-killer items the seller is aware of (foundation, flood, title, zoning, code violations)?
- Is there a deadline driving the sale (1031 exchange, divorce, estate, relocation)? That informs how much negotiation room exists.
- Schools are D-rated, which usually means shorter tenancies and higher turnover. Who's the typical renter profile here, and what's been the actual vacancy rate?
- What's the average days-on-market for RENTAL listings here right now (not sales)? A rising rental-DOM trend means longer vacancies and softer asking-rent achievability than the comps imply.
- What's the recent tenant-quality profile in this submarket — average credit score on applications, eviction rate, late-payment / NSF rate, and stable-employment percentage? A property-management company in the area should have these aggregated.
- How much new for-sale + rental construction is in the pipeline within 1–3 miles? Heavy new supply typically softens prices + rents 12–24 months out; constrained supply supports both.
Investment metrics
- 1% rule
- 0.88% ✗
- Cap rate
- 7.58%
- Cash-on-cash
- 4.58%
- DSCR
- 1.20
- GRM
- 9.4
CMA / ARV
- ARV (on-the-fly)
- $269,892
- Comps found
- 12
Show comp detail 12 sales within ~0.75 mi
| Address | Dist | Beds/Ba | Sqft | Sold | Price | $/sf | Match |
|---|---|---|---|---|---|---|---|
| 9321 Coconut Dr | 0.00mi | 3/3.0 | 1,836 (0%) | 1mo | $270,000 | $147 | 99 |
| 3301 Pineridge Dr | 0.15mi | 3/2.0 | 2,048 (+12%) | 0mo | $349,000 | $170 | 69 |
| 3717 Tangerine St | 0.38mi | 3/2.0 | 1,752 (-5%) | 2mo | $250,000 | $143 | 69 |
| 9504 Live Oak Ave | 0.37mi | 3/2.0 | 1,761 (-4%) | 5mo | $224,900 | $128 | 68 |
| 3300 N 9th St | 0.58mi | 3/2.0 | 1,858 (+1%) | 2mo | $315,000 | $170 | 65 |
| 3524 N 8th St | 0.54mi | 4/2.0 (+1) | 1,835 (-0%) | 2mo | $275,000 | $150 | 64 |
| 3212 N 5th St | 0.32mi | 3/2.0 | 1,641 (-11%) | 0mo | $249,900 | $152 | 63 |
| 3425 Beachview Dr | 0.35mi | 4/2.0 (+1) | 1,993 (+9%) | 5mo | $279,900 | $140 | 56 |
| 2804 Beachview Dr | 0.73mi | 4/2.5 (+1) | 1,798 (-2%) | 4mo | $235,000 | $131 | 53 |
| 124 Spanish Cove Dr | 0.64mi | 3/2.0 | 1,937 (+6%) | 6mo | $400,000 | $207 | 52 |
| 2808 Hickory Ln | 0.68mi | 3/2.5 | 2,073 (+13%) | 1mo | $269,000 | $130 | 44 |
| 2713 N 6th St | 0.74mi | 3/2.0 | 1,560 (-15%) | 2mo | $205,000 | $131 | 34 |
Match score weights: distance 35% · size 25% · config 20% · recency 20%. Top-matched comps best support the ARV.
Projected returns pro-forma
-3.0% appreciation · 1.31% rent growth · sell at horizon
- IRR
- -12.5%
- Equity multiple
- 0.55×
- Total profit
- $-33,685
- Equity at exit
- $40,258
- IRR
- -6.0%
- Equity multiple
- 0.64×
- Total profit
- $-27,307
- Equity at exit
- $23,345
Cash invested: $75,600 (down + closing). Projections, not guarantees.
Landlord ↔ Tenant lean methodology
- Overall (STATE)
- 90 Strongly Landlord-Friendly
- State Mississippi
- 90 Strongly Landlord-Friendly · R+11
- County
- — inherits STATE
- City
- — inherits STATE
ZIP-level market 39564
- Home prices YoY
- -26.8%
- Rents YoY
- 1.3%
- Active inventory
- 714
- Price-to-rent
- 9.4×
Monthly cashflow live
- Estimated rent
- $2,387 medium interval (Pro) →
- Mortgage (P&I)
- −$1,416
- Tax from tax record
- −$68 /mo · $821/yr
- Insurance
- −$112
- Flood insurance flood zone
- −$66 /mo · $798/yr
- HOA
- −$0
- Vacancy / Maint / Mgmt
- −$501
- Net cashflow
- $222
Break-even live
UW: 25.0% down · 7.5% · 30yr · 1.5% tax · 5.0% vac · 8.0% maint · 8.0% mgmt
Financing live
Cash to close
- Down payment
- $67,500
- Closing costs
- $8,100
- Reserves months
- —
- Total cash needed
- —
Loan-product check · same deal, 3 products live
Conventional
25% down · 7.5% · 30yr
- Down + closing
- —
- Monthly P&I
- —
- Monthly cashflow
- —
- DSCR
- —
- Eligible?
- —
Personal DTI + credit; lowest rate.
DSCR
20% down · 8.5% · 30yr
- Down + closing
- —
- Monthly P&I
- —
- Monthly cashflow
- —
- DSCR
- —
- Eligible?
- —
No personal income docs; deal must DSCR.
Hard money
10% down · 12.0% · 12mo
- Down + closing
- —
- Monthly P&I
- —
- Monthly cashflow
- —
- DSCR
- —
- Eligible?
- —
Short-term bridge; refi at stabilization.
Rent comps 4 comps
| Address | Beds | Baths | Sqft | Rent | $/sqft | DOM | Units | Dist |
|---|---|---|---|---|---|---|---|---|
| 3305 N 8th St Ocean Springs, MS | 4.0 | 2.0 | 1802 | $2,250 | $1.25 | 20d | 1 | 0.51mi |
| 106 Booth Cir Ocean Springs, MS | 4.0 | 2.0 | 2100 | $2,500 | $1.19 | 13d | 1 | 0.78mi |
| 4008 Breezy Hill Ln Ocean Springs, MS | 4.0 | 3.0 | 1600 | $3,200 | $2.00 | 13d | 1 | 1.46mi |
| 9200 Pointe Aux Chenes Rd Unit 1365709P Ocean Springs, MS | 3.0 | 2.0 | 1420 | $5,979 | $4.21 | 13d | 1 | 1.50mi |
Listing history 21 events
-
2026-03-21historical Active Under Contract
-
2026-03-13status Active
-
2026-03-09status Pending
-
2026-03-03$270,000 Active
-
2026-02-16historical
-
2026-01-15$285,000 Active
-
2025-10-15status Pending
-
2025-10-14historical
-
2025-10-08$275,000 Active
-
2025-08-11historical
-
2025-07-09price $290,000
-
2025-06-10$298,900 Active
-
2021-03-03soldstatus
-
2021-02-22soldstatus
-
2021-01-14$200,000
-
2018-07-03soldstatus
-
2018-05-17$174,900
-
2010-08-11soldstatus
-
2010-03-09$145,000
-
2006-01-20soldstatus
-
2005-11-11$169,900
ⓘ Source: listings_history table (triggers on properties + properties_extension) + one-shot
backfill from property_details.listing_events for pre-trigger history.
Tax reassessment forecast MS · Resets to sale price
- Current annual tax
- $821 · $68/mo
- Projected year-2 tax
- $2,133 · $178/mo
- Expected delta
- +$1,312/yr (+$109/mo · 159.9%)
ⓘ Screening estimate from a state-policy table — verify with the county assessor before closing.
Climate risk First Street
- Flood 7/10 Severe FEMA zone X (shaded) · 93% chance over 30 yrs
- Wildfire 3/10 Moderate
- Heat 10/10 Extreme 7 d/yr ≥106°F today · 22 d/yr by 30 yrs out
- Wind 9/10 Extreme 99% chance of damaging wind over 30 yrs
- Air quality 2/10 Low 1 unhealthy d/yr today · 2 by 30 yrs out
Nearby sold comps map
Loading sold comps map…
Walkable amenities ~0.75 mi
Loading nearby amenities…
Taxation est. · year 1
- Rental income
- $28,639
- − Mortgage interest
- −$15,124
- − Property taxes
- −$821
- − Insurance
- −$2,148
- − Repairs & maintenance
- −$2,291
- − Management
- −$2,291
- − Depreciation
- −$7,855
- Taxable loss
- −$1,891
- Est. tax savings @ 24.0%
- +$454
- After-tax cash flow
- $3,119/yr
For passive investors: Depreciation is non-cash, so a rental often shows a tax loss while cash-flowing — sheltering income. Rental losses are passive: they offset passive income freely, and up to $25,000/yr can offset ordinary (W-2) income if you actively participate and your MAGI is under $100k (phasing out to $0 by $150k); unused losses carry forward. On sale, claimed depreciation is recaptured at up to 25%, and gains may owe capital-gains tax (a 1031 exchange can defer both). Figures are a year-1 estimate at your 24.0% rate — not tax advice; consult a CPA.
Schools (NCES district)
- District
- Ocean Springs School District
- NCES district ID
- 2803360
- Math proficiency
- 64% ▼ -3.00%
- Reading proficiency
- 59% ▲ 1.00%
- Median HH income
- $60,485
- Composite
- 53.35/100
- National rank
- #1477
- State rank
- #1 of 130 in MS
Livability — Gulf Park Estates
- Score
- 70/100
- State rank
- #43
- US rank
- #7955
Category grades
Schools grade is shown separately in the Schools card above.
Census & demographics
- Census place
- Gulf Park Estates, MS
- County
- Jackson County · 82,196 people
- Metro
- Gulfport-Biloxi, MS
- Population (ZIP)
- 43,240
- Household income
- $78,596
- Rent vs Own
- Severe rent burden
- 734.0
Population outlook (Jackson County) Hauer SSP2
- Today (2025)
- 146,926 people
- By 2030
- 148,442 · +1.0%
- By 2040
- 149,631 · +1.8%
- By 2050
- 148,723 · +1.2%
- By 2075
- 147,845 · +0.6%
- By 2100
- 144,510 · -1.6%
Race, ethnicity, and origin ACS 2023
- Neighborhood character
- Predominantly White (74%)
- Race & ethnicity
- White 74% Black 10% Hispanic / Latino 8% Two or more races 7% Asian 4%
- Hispanic origin (detail)
- Mexican 3% Puerto Rican 2%
- Common ancestry
- Lithuanian 5% Slovak 4% Romanian 2%
- Foreign-born
- 5% · Canada, South Korea, Vietnam
- Languages at home
- 93% English-only · Spanish 3% Vietnamese 2% Tagalog/Filipino 1%
Political lean MEDSL · Jackson
- 2024 margin
- Solid R (+39.9) · D 29.5% · R 69.4% · Other 1.1%
- 2008→2024 swing
- -6.4pp toward R · 2008: -33.5pp · 2024: -39.9pp
- All cycles
- 2024: R+39.9 2020: R+34.6 2016: R+39.9 2012: R+36.1 2008: R+33.5
Not yet ingested
- Civics
- —
Market trends
- HPI YoY
- ▼ -74.77%
- Current HPI
- 204.2244
- Rent YoY
- ▲ 1.31%
- Metro
- Gulfport-Biloxi, MS
- State GDP YoY
- —
- F500 in state
- 0
Price history
+58.9% since first listed21 events — show timeline
- 2026-03-21 Contingent — MLSU
- 2026-03-13 Relisted — MLSU
- 2026-03-09 Pending — MLSU
- 2026-03-03 Listed $270,000 MLSU
- 2026-02-16 Listing Removed — MLSU
- 2026-01-15 Listed $285,000 MLSU
- 2025-10-15 Pending — MLSU
- 2025-10-14 Listing Removed — MLSU
- 2025-10-08 Listed $275,000 MLSU
- 2025-08-11 Listing Removed — MLSU
- 2025-07-09 Price Changed $290,000 MLSU
- 2025-06-10 Listed $298,900 MLSU
- 2021-03-03 Sold (Public Records) — Public Records
- 2021-02-22 Sold (MLS) — MLSU
- 2021-01-14 Listed $200,000 MLSU
- 2018-07-03 Sold (MLS) — MLSU
- 2018-05-17 Listed $174,900 MLSU
- 2010-08-11 Sold (MLS) — MLSU
- 2010-03-09 Listed $145,000 MLSU
- 2006-01-20 Sold (MLS) — MLSU
- 2005-11-11 Listed $169,900 MLSU
Property tax history
-4.3%/yrLatest (2025): $821 · +0.7% YoY. Source: county tax records.
Cash-flow waterfall
monthlySold comps — $/sqft
last 12 mo · ≤1 miLoading sold comps…