 🏗️ New Construction
Truman 5628-68 Plan · Upper Macungie, PA
Flood risk 8/10 · Major
- FEMA flood zone
- X (unshaded)
- Chance of flooding over 30 yrs
- 0.99%
- Est. flood insurance / yr
- $507 – $1,088
Fire risk 1/10 · Minimal
- Est. fire insurance / yr
- $511 – $949
Heat risk 4/10 · Minor
- Hot days now (above 100°F)
- 7 days/yr
- Hot days in 30 yrs
- 15 days/yr
Wind risk 4/10 · Minor
- Chance of severe wind over 30 yrs
- 17.0%
Air-quality risk 3/10 · Minor
- Unhealthy air days now
- 2 days/yr
- Unhealthy air days in 30 yrs
- 3 days/yr
Risk factors via First Street. Map © Google.
Why this score? — see what drove the B+ grade
The composite is a weighted blend of 9 inputs, each scored 0–100. Each bar is that input's sub-score; the figure is the points it added to the 100-point composite (weight × sub-score).
- Cash flow +30.0/30.0
- 1% rule +10.0/10.0
- DSCR +10.0/10.0
- ARV discount +7.5/15.0
- Schools +5.7/10.0
- Condition / age +4.8/5.0
- Appreciation +4.6/10.0
- Rent growth +3.0/5.0
- Livability +2.5/5.0
$149,900
🖨 Deal sheet 📄 Offer letter ✓ Due diligence
Listing remarks MLS
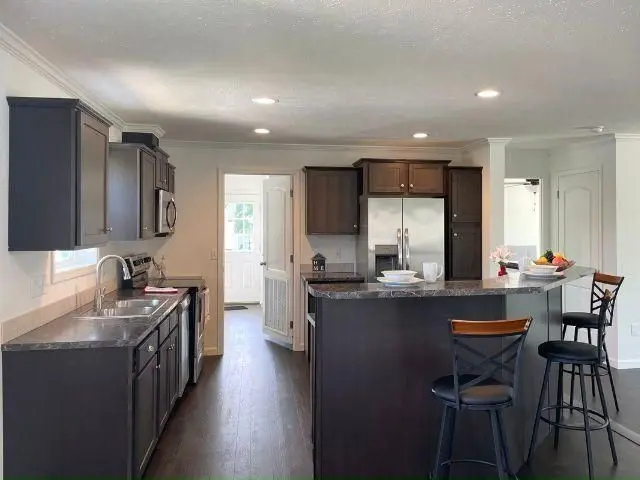
SALE PENDING! This Beautiful home is perfectly set on a corner lot, this is a 2023 Clayton Truman, featuring 3-bedrooms and 2-bathrooms. From the moment you enter, this home is nothing short of AMAZING. It features a spacious floor plan. The living room is warm and inviting, with a bonus family room. You will love the open concept once you walk through the front door with a spacious kitchen hosting a breakfast area that looks out to the dining room. The master bedroom ensuite is large with no lack of storage, including a separate walk-in closet and a utility room attached to the master bathroom. You'll enjoy the front porch both morning and night. Make this house your home today! This home has so many features its best to see this home in person. Call Marleny our sales associate at 484-735-1005 to schedule an appointment, this location is one you just can't recreate! It truly showcases everything a community living has to offer.
Key facts
- Listed 823 days
Neighborhood map
What this means for you Summary
Snapshot
- This is a 3-bed/2.0-bath manufactured listed at $150k. Condition is rated excellent.
Deal economics
- At list price, monthly cash flow is $1k ($17k/yr) — positive.
- The deal already cash-flows at list — no discount required.
- Meets the 1% rule at list price ($3k rent vs $150k).
- Recommended offer: $132k (12.0% below list) — sets the bar for market timing.
Location & tenants
- Location reads: area grade B — affects rentability + tenant quality, not the cash-flow math above.
- Parkland SD (suburban): math 59% / reading 70% proficiency, ranked #40 of 539 in PA (top 7%) — acceptable for families but not a draw, mixed tenant base, ~2y average lease; only 15% free/reduced lunch — higher-income household profile.
- Market conditions: Rents rising (+1.9%/yr); 123 active listings in the ZIP; 20 comparable units currently listed for rent nearby; rentals at typical pace (median 23d on market — plan ~3-4 weeks tenant-placement turnaround); 40% of comp listings sitting > 30 days — soft ceiling on asking rent; high-income renter base; 765 units permitted in Lehigh County in 2024 (286 in 5+ unit buildings).
Forward outlook
- Local home prices are declining (-0.7%/yr); year-one equity from $519 of loan paydown is wiped out by about $538 of value loss. Plan a longer hold.
- Lehigh County population projected at +21% by 2050 — long-run rental-demand tailwind backs the buy-and-hold thesis.
- At projected returns (-0.7% appreciation + 1.9% rent growth), your $21k cash investment doubles in ~2 years — after that, you're playing with house money.
Negotiation context
- It's been on market 823 days — a 12% lower offer ($132k) is reasonable based on typical stale-listing flexibility.
Risks & watch-outs
- Watch-outs: flood insurance adds $66/mo.
- Climate carrying-cost: severe flood risk — expect insurance premiums to compound above CPI over the hold.
Questions for the listing agent
- It's been on market 823 days. Have you received any prior offers? Is the seller open to a 12% concession, seller financing, or rate buy-down credit?
- What's the actual annual flood-insurance premium (NFIP or private), and is the property in a SFHA with mandatory coverage?
- Why hasn't it sold? Are there any deal-killer items the seller is aware of (foundation, flood, title, zoning, code violations)?
- Is there a deadline driving the sale (1031 exchange, divorce, estate, relocation)? That informs how much negotiation room exists.
- What's the average days-on-market for RENTAL listings here right now (not sales)? A rising rental-DOM trend means longer vacancies and softer asking-rent achievability than the comps imply.
- What's the recent tenant-quality profile in this submarket — average credit score on applications, eviction rate, late-payment / NSF rate, and stable-employment percentage? A property-management company in the area should have these aggregated.
- How much new for-sale + rental construction is in the pipeline within 1–3 miles? Heavy new supply typically softens prices + rents 12–24 months out; constrained supply supports both.
Investment metrics
- 1% rule
- 3.38% ✓
- Cap rate
- 30.05%
- Cash-on-cash
- 84.85%
- DSCR
- 4.78
- GRM
- 2.5
CMA / ARV
- ARV (median comp)
- $75,000
- List price
- $149,900
- Delta
- 99.87%
- Verdict
- OVERPRICED
- Comps
- 11 within 1.0 mi
Show comp detail 8 sales within ~0.75 mi
| Address | Dist | Beds/Ba | Sqft | Sold | Price | $/sf | Match |
|---|---|---|---|---|---|---|---|
| 8736 Evergreen Cir | 0.34mi | 3/2.0 | 1,568 (0%) | 11mo | $80,000 | $51 | 75 |
| 1102 Deer Xing | 0.29mi | 3/2.0 | 1,512 (-4%) | 10mo | $85,000 | $56 | 72 |
| 1006 Redwood Dr | 0.47mi | 3/2.0 | 1,568 (0%) | 11mo | $45,000 | $29 | 69 |
| 8917 Cedar Rd #120 | 0.38mi | 3/2.0 | 1,680 (+7%) | 8mo | $82,000 | $49 | 64 |
| 1012 Spruce Ln | 0.32mi | 3/2.0 | 1,344 (-14%) | 3mo | $75,000 | $56 | 59 |
| 8850 Turkey Ridge Rd | 0.22mi | 3/2.0 | 1,344 (-14%) | 11mo | $20,000 | $15 | 57 |
| 8865 Breinig Run Cir | 0.47mi | 3/2.0 | 1,344 (-14%) | 2mo | $92,500 | $69 | 53 |
| 8727 Evergreen Cir | 0.35mi | 3/2.0 | 1,344 (-14%) | 10mo | $50,000 | $37 | 52 |
Match score weights: distance 35% · size 25% · config 20% · recency 20%. Top-matched comps best support the ARV.
Projected returns pro-forma
-0.72% appreciation · 1.92% rent growth · sell at horizon
- IRR
- 81.6%
- Equity multiple
- 4.95×
- Total profit
- $83,002
- Equity at exit
- $19,124
- IRR
- 83.3%
- Equity multiple
- 9.81×
- Total profit
- $185,088
- Equity at exit
- $20,964
Cash invested: $21,000 (down + closing). Projections, not guarantees.
Landlord ↔ Tenant lean methodology
- Overall (STATE)
- 62 Landlord-Friendly
- State Pennsylvania
- 62 Landlord-Friendly · EVEN
- County
- — inherits STATE
- City
- — inherits STATE
ZIP-level market 18031
- Home prices YoY
- -0.3%
- Rents YoY
- 1.9%
- Active inventory
- 123
- Price-to-rent
- 4.9×
Monthly cashflow live
- Estimated rent
- $2,536 high interval (Pro) →
- Mortgage (P&I)
- −$393
- Tax est. 1.5%
- −$94 /mo · $1,125/yr
- Insurance
- −$31
- Flood insurance flood zone
- −$66 /mo · $798/yr
- HOA
- −$0
- Vacancy / Maint / Mgmt
- −$532
- Net cashflow
- $1,418
Break-even live
UW: 25.0% down · 7.5% · 30yr · 1.5% tax · 5.0% vac · 8.0% maint · 8.0% mgmt
Financing live
Cash to close
- Down payment
- $18,750
- Closing costs
- $2,250
- Reserves months
- —
- Total cash needed
- —
Loan-product check · same deal, 3 products live
Conventional
25% down · 7.5% · 30yr
- Down + closing
- —
- Monthly P&I
- —
- Monthly cashflow
- —
- DSCR
- —
- Eligible?
- —
Personal DTI + credit; lowest rate.
DSCR
20% down · 8.5% · 30yr
- Down + closing
- —
- Monthly P&I
- —
- Monthly cashflow
- —
- DSCR
- —
- Eligible?
- —
No personal income docs; deal must DSCR.
Hard money
10% down · 12.0% · 12mo
- Down + closing
- —
- Monthly P&I
- —
- Monthly cashflow
- —
- DSCR
- —
- Eligible?
- —
Short-term bridge; refi at stabilization.
Rent comps 20 comps
| Address | Beds | Baths | Sqft | Rent | $/sqft | DOM | Units | Dist |
|---|---|---|---|---|---|---|---|---|
| 1140 Tudor Dr Breinigsville, PA | 3.0 | 2.5 | 1670 | $2,500 | $1.50 | 23d | 1 | 0.34mi |
| 8938 Breinigsville Rd Breinigsville, PA | 3.0 | 1.5 | 1547 | $2,250 | $1.45 | 2d | 1 | 0.44mi |
| 937 King Way Breinigsville, PA | 3.0 | 2.5 | 2070 | $2,650 | $1.28 | 43d | 1 | 0.46mi |
| 1208 Martin Rd Breinigsville, PA | 3.0 | 2.5 | 1500 | $2,450 | $1.63 | 43d | 1 | 0.49mi |
| 1273 Martin Rd Breinigsville, PA | 3.0 | 2.5 | 1500 | $2,550 | $1.70 | 43d | 1 | 0.53mi |
| 1145 Martin Rd Breinigsville, PA | 3.0 | 2.5 | 1500 | $2,500 | $1.67 | 2d | 1 | 0.55mi |
| 1175 Susan Cir Breinigsville, PA | 3.0 | 2.5 | 1500 | $2,600 | $1.73 | 43d | 1 | 0.56mi |
| 1177 Susan Cir Breinigsville, PA | 3.0 | 2.5 | 1500 | $2,500 | $1.67 | 43d | 1 | 0.56mi |
| 8348 Fair Way Breinigsville, PA | 3.0 | 2.5 | 1520 | $2,750 | $1.81 | 23d | 1 | 0.59mi |
| 8704 Mayfair Ct Breinigsville, PA | 3.0 | 2.5 | 2011 | $2,700 | $1.34 | 2d | 1 | 0.60mi |
| 8328 Fair Way Breinigsville, PA | 3.0 | 2.5 | 1500 | $2,600 | $1.73 | 23d | 1 | 0.60mi |
| 8536 Mayfair Ct Breinigsville, PA | 3.0 | 2.5 | 2017 | $2,795 | $1.39 | 2d | 1 | 0.63mi |
| 8395 Saylor Ct Breinigsville, PA | 3.0 | 1.5 | 1056 | $2,100 | $1.99 | 14d | 1 | 0.74mi |
| 1447 Artisan Ct Breinigsville, PA | 2.0 | 1.5 | 1056 | $2,150 | $2.04 | 14d | 1 | 0.75mi |
| 1585 Pinewind Dr Alburtis, PA | 3.0 | 2.5 | 1618 | $2,490 | $1.54 | 43d | 1 | 1.03mi |
| 1055 Cetronia Rd Breinigsville, PA | 1.0–2.0 | 1.0–2.0 | 1094 | $2,355 | $2.15 | 2d | 8 | 1.05mi |
| 1132 Sparrow Way Breinigsville, PA | 3.0 | 2.5 | 1622 | $2,500 | $1.54 | 43d | 1 | 1.17mi |
| 1600 Greystone Cir Alburtis, PA | 3.0 | 2.5 | 1662 | $2,475 | $1.49 | 43d | 1 | 1.20mi |
| 1073 Sparrow Way Breinigsville, PA | 3.0 | 2.5 | 2050 | $2,525 | $1.23 | 2d | 1 | 1.24mi |
| 9751 Newtown Rd Unit B Breinigsville, PA | 2.0 | 1.0 | 1288 | $2,300 | $1.79 | 2d | 1 | 1.44mi |
Listing history 16 events
-
2026-06-18days on market $149,900 Active 823 DOM
-
2026-06-17days on market $149,900 Active 822 DOM
-
2026-06-16days on market $149,900 Active 821 DOM
-
2026-06-15days on market $149,900 Active 820 DOM
-
2026-06-14days on market $149,900 Active 818 DOM
-
2026-06-13days on market $149,900 Active 817 DOM
-
2026-06-10days on market $149,900 Active 815 DOM
-
2026-06-09days on market $149,900 Active 814 DOM
-
2026-06-08days on market $149,900 Active 813 DOM
-
2026-06-07days on market $149,900 Active 812 DOM
-
2026-06-03days on market $149,900 Active 808 DOM
-
2026-06-02days on market $149,900 Active 807 DOM
-
2026-06-01days on market $149,900 Active 806 DOM
-
2026-05-31days on market $149,900 Active 805 DOM
-
2026-05-31days on market $149,900 Active 804 DOM
-
2024-03-17$149,900 Active 942-char remark
Show marketing remark (942 chars)
SALE PENDING! This Beautiful home is perfectly set on a corner lot, this is a 2023 Clayton Truman, featuring 3-bedrooms and 2-bathrooms. From the moment you enter, this home is nothing short of AMAZING. It features a spacious floor plan. The living room is warm and inviting, with a bonus family room. You will love the open concept once you walk through the front door with a spacious kitchen hosting a breakfast area that looks out to the dining room. The master bedroom ensuite is large with no lack of storage, including a separate walk-in closet and a utility room attached to the master bathroom. You'll enjoy the front porch both morning and night. Make this house your home today! This home has so many features its best to see this home in person. Call Marleny our sales associate at 484-735-1005 to schedule an appointment, this location is one you just can't recreate! It truly showcases everything a community living has to offer.
ⓘ Source: listings_history table (triggers on properties + properties_extension) + one-shot
backfill from property_details.listing_events for pre-trigger history.
Climate risk First Street
- Flood 8/10 Severe FEMA zone X (unshaded) · 99% chance over 30 yrs
- Wildfire 1/10 Low
- Heat 4/10 Moderate 7 d/yr ≥100°F today · 15 d/yr by 30 yrs out
- Wind 4/10 Moderate 17% chance of damaging wind over 30 yrs
- Air quality 3/10 Moderate 2 unhealthy d/yr today · 3 by 30 yrs out
Nearby sold comps map
Loading sold comps map…
Walkable amenities ~0.75 mi
Loading nearby amenities…
Taxation est. · year 1
- Rental income
- $30,428
- − Mortgage interest
- −$4,201
- − Property taxes
- −$1,125
- − Insurance
- −$1,172
- − Repairs & maintenance
- −$2,434
- − Management
- −$2,434
- − Depreciation
- −$2,182
- Taxable income
- $16,879
- Est. tax owed @ 24.0%
- −$4,051
- After-tax cash flow
- $12,970/yr
For passive investors: Depreciation is non-cash, so a rental often shows a tax loss while cash-flowing — sheltering income. Rental losses are passive: they offset passive income freely, and up to $25,000/yr can offset ordinary (W-2) income if you actively participate and your MAGI is under $100k (phasing out to $0 by $150k); unused losses carry forward. On sale, claimed depreciation is recaptured at up to 25%, and gains may owe capital-gains tax (a 1031 exchange can defer both). Figures are a year-1 estimate at your 24.0% rate — not tax advice; consult a CPA.
Condition & rehab AI · 12 photos
This 2023 Clayton Truman manufactured home is in excellent condition with a spacious floor plan and modern finishes. It is move-in ready and has the potential for further value increases through minor exterior and landscaping improvements.
Value-add opportunities
- Both Painting the exterior siding — Enhances curb appeal and can increase both resale and rental value.
- Both Landscaping improvements — Enhances curb appeal and can increase both resale and rental value.
- Both Adding a small outdoor seating area — Can increase both resale and rental value by adding a unique feature to the property.
Renovation cost estimate screening
Value-add ROI direction
- Both Painting the exterior siding — Enhances curb appeal and can increase both resale and rental value. ↑
- Both Landscaping improvements — Enhances curb appeal and can increase both resale and rental value. ↑
- Both Adding a small outdoor seating area — Can increase both resale and rental value by adding a unique feature to the property. ↑
ⓘ Cost ranges are severity-bucket heuristics (US national rule-of-thumb). Get contractor quotes + a written scope before underwriting a rehab budget.
Schools (NCES district)
- District
- Parkland SD
- NCES district ID
- 4218510
- Math proficiency
- 59% ▼ -11.00%
- Reading proficiency
- 70% ▼ -12.00%
- Median HH income
- $77,976
- Composite
- 57.44/100
- National rank
- #1074
- State rank
- #40 of 539 in PA
Livability — Upper Macungie
No livability data for this city. (Only ~50 U.S. cities are tracked.)
Census & demographics
- Census place
- Breinigsville, PA
- County
- Lehigh County · 333,019 people
- Metro
- Allentown-Bethlehem-Easton, PA-NJ
- Population (ZIP)
- 11,570
- Household income
- $113,625
- Rent vs Own
- Severe rent burden
- 52.0
Population outlook (Lehigh County) Hauer SSP2
- Today (2025)
- 392,957 people
- By 2030
- 408,319 · +3.9%
- By 2040
- 440,007 · +12.0%
- By 2050
- 475,940 · +21.1%
- By 2075
- 590,448 · +50.3%
- By 2100
- 690,314 · +75.7%
Race, ethnicity, and origin ACS 2023
- Neighborhood character
- Diverse neighborhood (Simpson 0.58)
- Race & ethnicity
- White 61% Hispanic / Latino 19% Two or more races 17% Asian 12% Black 5%
- Hispanic origin (detail)
- Mexican 6% Puerto Rican 7% Dominican 3%
- Common ancestry
- Polish 4% Lithuanian 3% Scandinavian 3%
- Foreign-born
- 19% · Canada, United Kingdom, China
- Languages at home
- 76% English-only · Spanish 10% Other Indo-European 8% Other Asian/Pacific 2%
Political lean MEDSL · Lehigh
- 2024 margin
- Toss-up / Even · D 50.7% · R 48.0% · Other 1.2%
- 2008→2024 swing
- -12.9pp toward R · 2008: 15.6pp · 2024: 2.7pp
- All cycles
- 2024: D+2.7 2020: D+7.6 2016: D+4.4 2012: D+7.5 2008: D+15.6
Not yet ingested
- Civics
- —
Market trends
- HPI YoY
- ▼ -0.72%
- Current HPI
- 267.8218
- Rent YoY
- ▲ 1.92%
- Metro
- Allentown-Bethlehem-Easton, PA-NJ
- State GDP YoY
- ▲ 1.68%
- F500 in state
- 34
Industry mix (Fortune 500 HQ in PA)
| Industry | F500 HQs | Revenue |
|---|---|---|
| Healthcare | 2 | $309B |
|
||
| Insurance | 2 | $27B |
|
||
| Telecommunications / Media | 1 | $124B |
|
||
| Industrial Distribution | 1 | $22B |
|
||
| Financial Services | 1 | $20B |
|
||
| Chemicals / Materials | 1 | $18B |
|
||
Price history
1 event — show timeline
- 2024-03-17 Listed $149,900 Zillow
Cash-flow waterfall
monthlySold comps — $/sqft
last 12 mo · ≤1 miLoading sold comps…