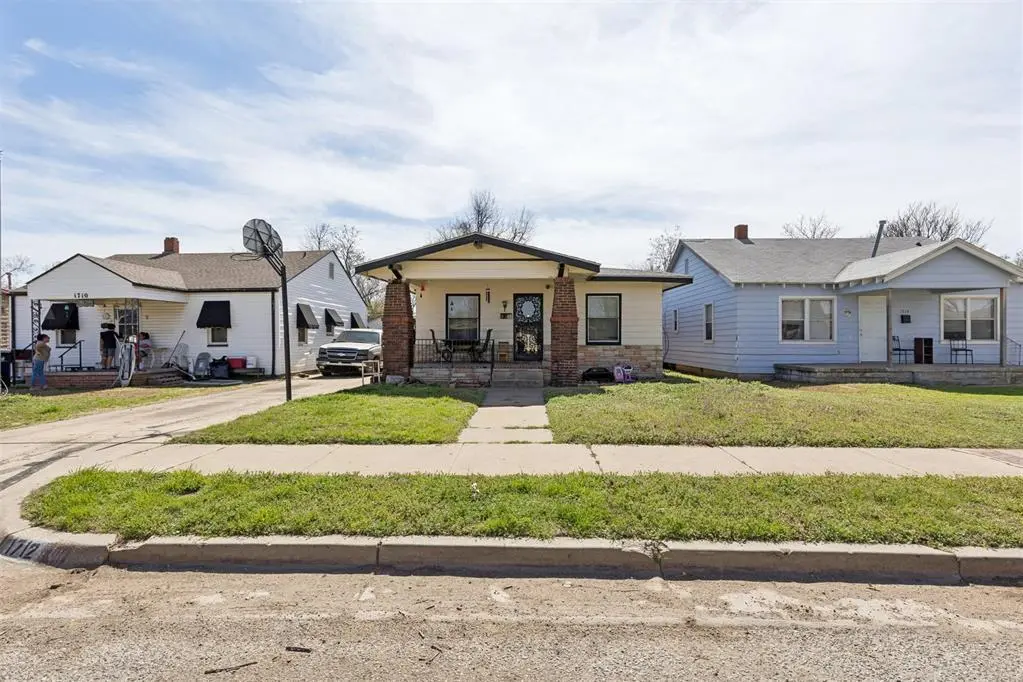
1712 SW 14th St · Oklahoma City, OK
Flood risk 1/10 · Minimal
- FEMA flood zone
- X (unshaded)
- Chance of flooding over 30 yrs
- 0.0%
- Est. flood insurance / yr
- $507 – $1,088
Fire risk 1/10 · Minimal
- Est. fire insurance / yr
- $2,463 – $4,575
Heat risk 6/10 · Moderate
- Hot days now (above 107°F)
- 7 days/yr
- Hot days in 30 yrs
- 19 days/yr
Wind risk 2/10 · Minimal
- Chance of severe wind over 30 yrs
- 4.0%
Air-quality risk 2/10 · Minimal
- Unhealthy air days now
- 1 days/yr
- Unhealthy air days in 30 yrs
- 2 days/yr
Risk factors via First Street. Map © Google.
Why this score? — see what drove the B- grade
The composite is a weighted blend of 9 inputs, each scored 0–100. Each bar is that input's sub-score; the figure is the points it added to the 100-point composite (weight × sub-score).
- Cash flow +21.7/30.0
- ARV discount +14.8/15.0
- Appreciation +7.5/10.0
- DSCR +6.9/10.0
- 1% rule +4.8/10.0
- Livability +4.0/5.0
- Rent growth +2.5/5.0
- Condition / age +2.5/5.0
- Schools +0.7/10.0
$99,500
🖨 Deal sheet (PDF) 📄 Offer letter ✓ Due diligence
Listing remarks MLS
Located at 1712 SW 14th St, this 3-bedroom, 2-bathroom home built in 1928 offers a great opportunity for an investor or a buyer looking to make it their own. With its original character and solid layout, the property provides a strong starting point for renovation, updates, or a full reimagining. Whether you're looking for your next investment project or a place to restore and call home, this property has plenty of potential. Property is being sold as-is.
Key facts
- 6,020 sq ft lot
- Built 1928
- Listed 97 days
Neighborhood map
What this means for you Summary
Snapshot
- This is a 3-bed/1.0-bath single-family listed at $100k.
Deal economics
- At list price, monthly cash flow is $154 ($2k/yr) — positive.
- The deal already cash-flows at list — no discount required.
- To meet the 1% rule (rent ≥ 1% of price), the offer needs to be $97k (2.4% below list).
- Recommended offer: $91k (9.0% below list) — sets the bar for market timing.
- Cap rate 8.1% vs local median 3.7% in Oklahoma City — top-decile yield for the area; either an underpriced asset or a hidden risk that comps aren't pricing in. Stress-test before assuming the spread holds.
Location & tenants
- Location reads 80/100 on livability (#3 in OK, #1,635 nationally) — a professional / high-income tenant draw. Strengths: amenities A+, commute A+, cost of living A+; Watch: crime F.
- Oklahoma City (urban): math 7% / reading 10% proficiency, ranked #254 of 270 in OK (top 94%) — low school quality limits family demand, transient renter base, plan for 1-2y turnover; 82% free/reduced lunch — lower-income household profile, screen leases tightly.
- Zoned schools: Emerson Alternative Ed. (Es) (math 24% / reading 24%, grade F, #354 of 845 statewide, top 47%, 64 students, 0% FRL); Classen Ms of Advanced Studies (math 35% / reading 46%, grade F, #6 of 345 statewide, top 1%, 855 students, 0% FRL); Capitol Hill Hs (math 2% / reading 4%, grade F, #444 of 447 statewide, top 99%, 1,455 students, 0% FRL) — zoned schools average 0% FRL vs 82% district-wide (82 pts lower); this property's tenant base skews higher-income than the district average.
- Zoned-school proficiency averages 23% at this address vs 8% district-wide (+14 pts) — the actual schools serving this property are materially stronger than the Oklahoma City average implies; a family-tenant draw the district grade alone would hide.
- Market conditions: 79 active listings in the ZIP; 9 comparable units currently listed for rent nearby; rentals leasing fast (median 5d on market — plan ~1-2 weeks tenant-placement turnaround); 5,365 units permitted in Oklahoma County in 2024 (569 in 5+ unit buildings).
Forward outlook
- In year one you build about $6k of equity ($688 loan paydown + $5k appreciation (4.9% local appreciation)).
- Oklahoma County population projected at +41% by 2050 — long-run rental-demand tailwind backs the buy-and-hold thesis.
- At projected returns (4.9% appreciation + 3.0% rent growth), your $28k cash investment doubles in ~4 years — after that, you're playing with house money.
- By year 6, paydown + projected appreciation supports a ~$30k cash-out refi (75% LTV) — recoverable capital for the next deal without selling this one.
Negotiation context
- It's been on market 98 days — a 9% lower offer ($91k) is reasonable based on typical stale-listing flexibility.
Risks & watch-outs
- Watch-outs: built in 1928 — expect roof / HVAC / electrical / plumbing capex.
- Climate carrying-cost: extreme-heat days projected 7→19/yr by 2055 (HVAC capex compounding) — expect insurance premiums to compound above CPI over the hold.
Questions for the listing agent
- It's been on market 98 days. Have you received any prior offers? Is the seller open to a 9% concession, seller financing, or rate buy-down credit?
- Built in 1928 — when were the roof, HVAC, electrical panel, plumbing, and water heater last replaced?
- Why hasn't it sold? Are there any deal-killer items the seller is aware of (foundation, flood, title, zoning, code violations)?
- Is there a deadline driving the sale (1031 exchange, divorce, estate, relocation)? That informs how much negotiation room exists.
- Schools are F-rated, which usually means shorter tenancies and higher turnover. Who's the typical renter profile here, and what's been the actual vacancy rate?
- Crime grade is F in this area — have there been break-ins, vandalism, or insurance claims at this property in the last 3 years? What carrier currently insures it and at what premium?
- What's the average days-on-market for RENTAL listings here right now (not sales)? A rising rental-DOM trend means longer vacancies and softer asking-rent achievability than the comps imply.
- What's the recent tenant-quality profile in this submarket — average credit score on applications, eviction rate, late-payment / NSF rate, and stable-employment percentage? A property-management company in the area should have these aggregated.
- How much new for-sale + rental construction is in the pipeline within 1–3 miles? Heavy new supply typically softens prices + rents 12–24 months out; constrained supply supports both.
Investment metrics
- 1% rule
- 0.98% ✗
- Cap rate
- 8.15%
- Cash-on-cash
- 6.62%
- DSCR
- 1.29
- GRM
- 8.5
CMA / ARV
- ARV (median comp)
- $118,736
- List price
- $99,500
- Delta
- -16.20%
- Verdict
- UNDERPRICED
- Comps
- 20 within 1.0 mi
Show comp detail 12 sales within ~0.75 mi
| Address | Dist | Beds/Ba | Sqft | Sold | Price | $/sf | Match |
|---|---|---|---|---|---|---|---|
| 1700 SW 18th St | 0.24mi | 3/2.0 | 1,334 (-8%) | 2mo | $152,000 | $114 | 69 |
| 1232 SW 17th St | 0.42mi | 3/2.0 | 1,376 (-5%) | 2mo | $187,000 | $136 | 66 |
| 1317 SW 13th St | 0.54mi | 3/1.0 | 1,380 (-5%) | 12mo | $67,500 | $49 | 56 |
| 1321 SW 13th St | 0.54mi | 3/2.0 | 1,530 (+5%) | 11mo | $80,000 | $52 | 53 |
| 1636 S Douglas Ave | 0.58mi | 3/2.5 | 1,583 (+9%) | 0mo | $475,000 | $300 | 52 |
| 1743 Oso Ave | 0.63mi | 3/2.5 | 1,331 (-8%) | 1mo | $415,000 | $312 | 49 |
| 1640 S Douglas Ave | 0.59mi | 3/2.5 | 1,583 (+9%) | 3mo | $475,000 | $300 | 49 |
| 1817 Runway Blvd | 0.73mi | 3/2.5 | 1,413 (-3%) | 8mo | $367,000 | $260 | 48 |
| 1624 S Douglas Ave | 0.58mi | 2/2.5 (-1) | 1,332 (-8%) | 3mo | $395,000 | $297 | 45 |
| 1911 Oso Ave | 0.68mi | 3/2.5 | 1,556 (+7%) | 14mo | $495,000 | $318 | 39 |
| 1628 S Douglas Ave | 0.58mi | 3/2.5 | 1,670 (+15%) | 6mo | $485,000 | $290 | 37 |
| 1719 Oso Ave | 0.61mi | 2/2.5 (-1) | 1,250 (-14%) | 12mo | $430,000 | $344 | 27 |
Match score weights: distance 35% · size 25% · config 20% · recency 20%. Top-matched comps best support the ARV.
Projected returns pro-forma
4.94% appreciation · 3.0% rent growth · sell at horizon
- IRR
- 18.4%
- Equity multiple
- 2.16×
- Total profit
- $32,330
- Equity at exit
- $56,007
- IRR
- 18.4%
- Equity multiple
- 4.21×
- Total profit
- $89,405
- Equity at exit
- $96,348
Cash invested: $27,860 (down + closing). Projections, not guarantees.
Landlord ↔ Tenant lean methodology
- Overall (STATE)
- 83 Strongly Landlord-Friendly
- State Oklahoma
- 83 Strongly Landlord-Friendly · R+20
- County
- — inherits STATE
- City
- — inherits STATE
ZIP-level market 73108
- Home prices YoY
- 1.7%
- Active inventory
- 79
- Price-to-rent
- 8.5×
Monthly cashflow live
- Estimated rent
- $971 high interval (Pro) →
- Mortgage (P&I)
- −$522
- Tax from tax record
- −$50 /mo · $605/yr
- Insurance
- −$41
- HOA
- −$0
- Vacancy / Maint / Mgmt
- −$204
- Net cashflow
- $154
Break-even live
Sensitivity live
| Price | -10% $210 | -5% $182 | +0% $154 | +5% $125 | +10% $97 |
|---|---|---|---|---|---|
| Rent | -10% $77 | -5% $115 | +0% $154 | +5% $192 | +10% $230 |
| Rate | -1.0pp $204 | -0.5pp $179 | base $154 | +0.5pp $128 | +1.0pp $102 |
UW: 25.0% down · 7.5% · 30yr · 1.5% tax · 5.0% vac · 8.0% maint · 8.0% mgmt
Financing live
Cash to close
- Down payment
- $24,875
- Closing costs
- $2,985
- Reserves months
- —
- Total cash needed
- —
Loan-product check · same deal, 3 products live
Conventional
25% down · 7.5% · 30yr
- Down + closing
- —
- Monthly P&I
- —
- Monthly cashflow
- —
- DSCR
- —
- Eligible?
- —
Personal DTI + credit; lowest rate.
DSCR
20% down · 8.5% · 30yr
- Down + closing
- —
- Monthly P&I
- —
- Monthly cashflow
- —
- DSCR
- —
- Eligible?
- —
No personal income docs; deal must DSCR.
Hard money
10% down · 12.0% · 12mo
- Down + closing
- —
- Monthly P&I
- —
- Monthly cashflow
- —
- DSCR
- —
- Eligible?
- —
Short-term bridge; refi at stabilization.
Rent comps 9 comps
| Address | Beds | Baths | Sqft | Rent | $/sqft | DOM | Units | Dist |
|---|---|---|---|---|---|---|---|---|
| 1416 S Daugherty Ave Oklahoma City, OK | 3.0 | 1.0 | 1164 | $1,120 | $0.96 | 13d | 1 | 0.14mi |
| 1632 Birch St Oklahoma City, OK | 2.0 | 1.0 | 935 | $775 | $0.83 | 4d | 1 | 0.22mi |
| 1802 Exchange Ave Unit 1802 Oklahoma City, OK | 2.0 | 1.0 | 1312 | $875 | $0.67 | 4d | 1 | 0.24mi |
| 1802 Exchange Ave Oklahoma City, OK | 2.0 | 1.0 | 1312 | $875 | $0.67 | 45d | 1 | 0.24mi |
| 1616 Linden St Oklahoma City, OK | 3.0 | 1.5 | 1175 | $975 | $0.83 | 25d | 1 | 0.30mi |
| 900 Hangar Dr Oklahoma City, OK | 2.0 | 1.0–2.0 | 743 | $2,075 | $2.79 | 3d | 37 | 0.86mi |
| 1345 SW 27th St Oklahoma City, OK | 3.0 | 2.0 | 1153 | $1,095 | $0.95 | 4d | 1 | 0.89mi |
| 2922 SW 19th St Oklahoma City, OK | 3.0 | 1.0 | 1056 | $1,350 | $1.28 | 4d | 1 | 1.27mi |
| 2140 SW 35th St Oklahoma City, OK | 3.0 | 2.0 | 976 | $1,300 | $1.33 | 45d | 1 | 1.48mi |
Listing history 16 events
-
2026-06-21days on market $99,500 Active 98 DOM
-
2026-06-18days on market $99,500 Active 95 DOM
-
2026-06-17days on market $99,500 Active 94 DOM
-
2026-06-16days on market $99,500 Active 93 DOM
-
2026-06-15days on market $99,500 Active 92 DOM
-
2026-06-13days on market $99,500 Active 90 DOM
-
2026-06-09days on market $99,500 Active 86 DOM
-
2026-06-08days on market $99,500 Active 85 DOM
-
2026-06-07days on market $99,500 Active 84 DOM
-
2026-06-05days on market $99,500 Active 81 DOM
-
2026-06-03days on market $99,500 Active 80 DOM
-
2026-06-02days on market $99,500 Active 79 DOM
-
2026-06-01days on market $99,500 Active 78 DOM
-
2026-05-31days on market $99,500 Active 77 DOM
-
2026-04-07price $110,000 459-char remark
Show marketing remark (459 chars)
Located at 1712 SW 14th St, this 3-bedroom, 2-bathroom home built in 1928 offers a great opportunity for an investor or a buyer looking to make it their own. With its original character and solid layout, the property provides a strong starting point for renovation, updates, or a full reimagining. Whether you're looking for your next investment project or a place to restore and call home, this property has plenty of potential. Property is being sold as-is.
-
2026-03-16$115,000 Active 459-char remark
Show marketing remark (459 chars)
Located at 1712 SW 14th St, this 3-bedroom, 2-bathroom home built in 1928 offers a great opportunity for an investor or a buyer looking to make it their own. With its original character and solid layout, the property provides a strong starting point for renovation, updates, or a full reimagining. Whether you're looking for your next investment project or a place to restore and call home, this property has plenty of potential. Property is being sold as-is.
ⓘ Source: listings_history table (triggers on properties + properties_extension) + one-shot
backfill from property_details.listing_events for pre-trigger history.
Tax reassessment forecast OK · Resets to sale price
- Current annual tax
- $605 · $50/mo
- Projected year-2 tax
- $895 · $75/mo
- Expected delta
- +$290/yr (+$24/mo · 47.9%)
ⓘ Screening estimate from a state-policy table — verify with the county assessor before closing.
Climate risk First Street
- Flood 1/10 Low FEMA zone X (unshaded) · 0% chance over 30 yrs
- Wildfire 1/10 Low
- Heat 6/10 Major 7 d/yr ≥107°F today · 19 d/yr by 30 yrs out
- Wind 2/10 Low 4% chance of damaging wind over 30 yrs
- Air quality 2/10 Low 1 unhealthy d/yr today · 2 by 30 yrs out
Nearby sold comps map
Loading sold comps map…
Walkable amenities ~0.75 mi
Loading nearby amenities…
Taxation est. · year 1
- Rental income
- $11,655
- − Mortgage interest
- −$5,574
- − Property taxes
- −$605
- − Insurance
- −$498
- − Repairs & maintenance
- −$932
- − Management
- −$932
- − Depreciation
- −$2,895
- Taxable income
- $219
- Est. tax owed @ 24.0%
- −$53
- After-tax cash flow
- $1,791/yr
For passive investors: Depreciation is non-cash, so a rental often shows a tax loss while cash-flowing — sheltering income. Rental losses are passive: they offset passive income freely, and up to $25,000/yr can offset ordinary (W-2) income if you actively participate and your MAGI is under $100k (phasing out to $0 by $150k); unused losses carry forward. On sale, claimed depreciation is recaptured at up to 25%, and gains may owe capital-gains tax (a 1031 exchange can defer both). Figures are a year-1 estimate at your 24.0% rate — not tax advice; consult a CPA.
Schools (NCES district)
- District
- Oklahoma City
- NCES district ID
- 4022770
- Math proficiency
- 7% ▼ -5.00%
- Reading proficiency
- 10% ▼ -6.00%
- Median HH income
- $35,606
- Composite
- 7.0/100
- National rank
- #9970
- State rank
- #254 of 270 in OK
Livability — Oklahoma City
- Score
- 80/100
- State rank
- #3
- US rank
- #1635
Category grades
Schools grade is shown separately in the Schools card above.
Census & demographics
- Census place
- Oklahoma City, OK
- City population
- 498,656
- Population (ZIP)
- 15,239
Population outlook (Oklahoma County) Hauer SSP2
- Today (2025)
- 911,875 people
- By 2030
- 982,413 · +7.7%
- By 2040
- 1,130,468 · +24.0%
- By 2050
- 1,288,422 · +41.3%
- By 2075
- 1,711,482 · +87.7%
- By 2100
- 2,088,448 · +129.0%
Race, ethnicity, and origin ACS 2023
- Neighborhood character
- Majority Hispanic (65%)
- Race & ethnicity
- Hispanic / Latino 65% Two or more races 28% White 20% Black 8% Native American 7%
- Hispanic origin (detail)
- Mexican 59% Puerto Rican 1%
- Common ancestry
- Italian 1%
- Foreign-born
- 27% · Canada
- Languages at home
- 46% English-only · Spanish 52%
Political lean MEDSL · Oklahoma
- 2024 margin
- Toss-up / Even · D 48.0% · R 49.7% · Other 2.3%
- 2008→2024 swing
- +15.1pp toward D · 2008: -16.8pp · 2024: -1.7pp
- All cycles
- 2024: R+1.7 2020: R+1.1 2016: R+10.5 2012: R+16.7 2008: R+16.8
Not yet ingested
- Civics
- —
Market trends
- HPI YoY
- ▲ 4.94%
- Current HPI
- 293.2571
- Rent YoY
- —
- Metro
- —
- State GDP YoY
- ▲ 1.55%
- F500 in state
- 6
Industry mix (Fortune 500 HQ in OK)
| Industry | F500 HQs | Revenue |
|---|---|---|
| Energy | 3 | $48B |
|
||
Price history
-4.3% since first listed2 events — show timeline
- 2026-04-07 Price Changed $110,000 MLSOK
- 2026-03-16 Listed $115,000 MLSOK
Property tax history
+4.2%/yrLatest (2025): $605 · +3.0% YoY. Source: county tax records.
Cash-flow waterfall
monthlySold comps — $/sqft
last 12 mo · ≤1 miLoading sold comps…