 Multi-family
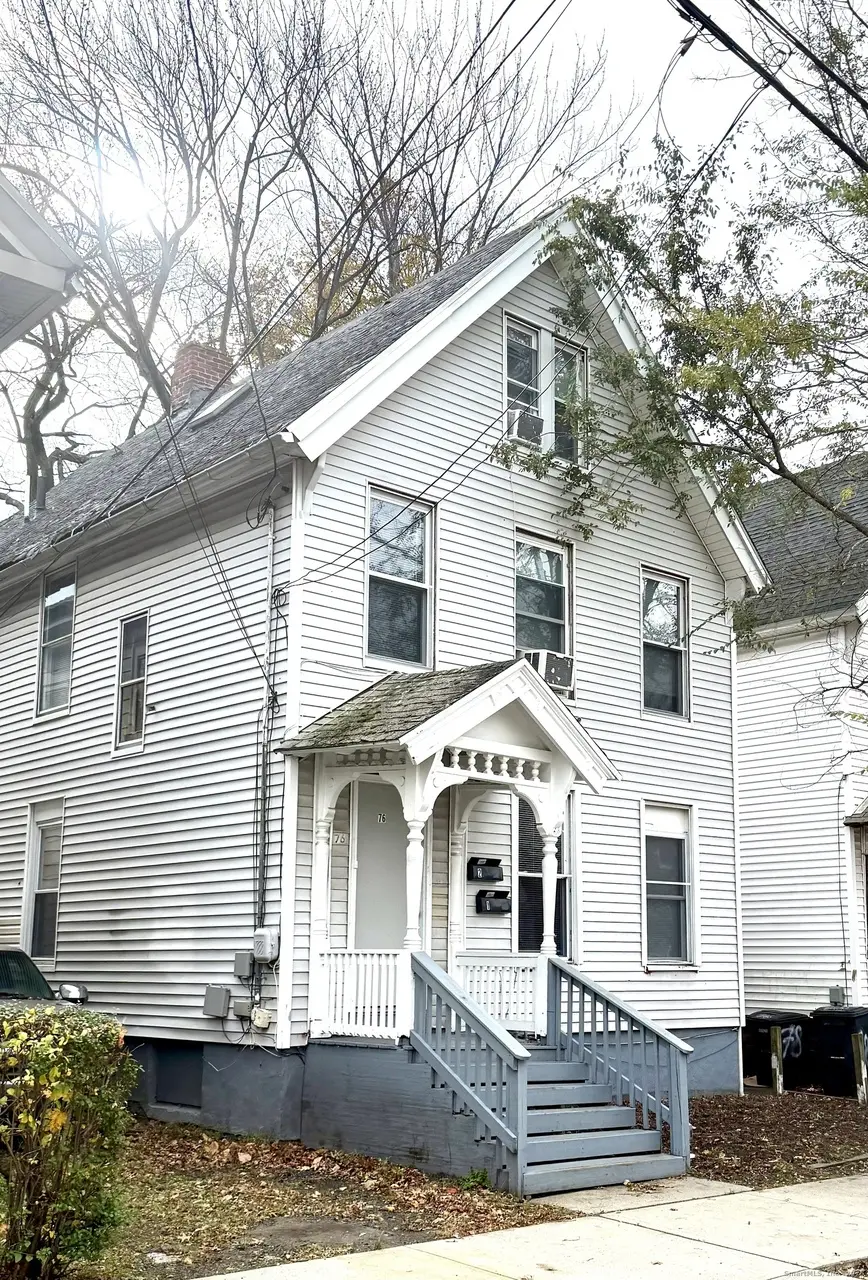
76 3rd St · New Haven, CT
Flood risk 1/10 · Minimal
- FEMA flood zone
- X (unshaded)
- Chance of flooding over 30 yrs
- 0.0%
- Est. flood insurance / yr
- $473 – $860
Fire risk 1/10 · Minimal
- Est. fire insurance / yr
- $829 – $1,539
Heat risk 7/10 · Major
- Hot days now (above 99°F)
- 7 days/yr
- Hot days in 30 yrs
- 16 days/yr
Wind risk 6/10 · Moderate
- Chance of severe wind over 30 yrs
- 55.0%
Air-quality risk 5/10 · Moderate
- Unhealthy air days now
- 6 days/yr
- Unhealthy air days in 30 yrs
- 8 days/yr
Risk factors via First Street. Map © Google.
Why this score? — see what drove the B grade
The composite is a weighted blend of 9 inputs, each scored 0–100. Each bar is that input's sub-score; the figure is the points it added to the 100-point composite (weight × sub-score).
- Cash flow +30.0/30.0
- 1% rule +10.0/10.0
- DSCR +10.0/10.0
- Appreciation +9.9/10.0
- Livability +4.0/5.0
- Rent growth +3.3/5.0
- Condition / age +2.5/5.0
- ARV discount +1.8/15.0
- Schools +1.5/10.0
$379,900
🖨 Deal sheet 📄 Offer letter ✓ Due diligence
Multi-family units
County records classify this as Multi-Family (2-4 Unit). Listing-text estimate: 1 unit. estimate disagrees with records
Listing remarks MLS
Fantastic property for first time homeowners, investors and owner occupants. Great value-add opportunity. Motivated Seller will entertain all serious offers.
Key facts
- 2,613 sq ft lot
- Built 1900
- Listed 96 days
Neighborhood map
What this means for you Summary
Snapshot
- This is a 2-bed/2.0-bath multifamily listed at $380k.
Deal economics
- At list price, monthly cash flow is $3k ($33k/yr) — positive.
- The deal already cash-flows at list — no discount required.
- Meets the 1% rule at list price ($7k rent vs $380k).
- Recommended offer: $346k (9.0% below list) — sets the bar for market timing.
- Cap rate 15.1% vs local median 4.8% in New Haven — top-decile yield for the area; either an underpriced asset or a hidden risk that comps aren't pricing in. Stress-test before assuming the spread holds.
Location & tenants
- Location reads 79/100 on livability (#31 in CT, #2,190 nationally) — a middle-class / working-renter tenant base. Strengths: amenities A+, commute A+, health & safety A+; Watch: schools D+, employment D, crime F.
- New Haven School District (urban): math 12% / reading 25% proficiency, ranked #147 of 153 in CT (top 96%) — low school quality limits family demand, transient renter base, plan for 1-2y turnover; 66% free/reduced lunch — lower-income household profile, screen leases tightly.
- Market conditions: Rents rising (+3.3%/yr); 46 active listings in the ZIP; 40 comparable units currently listed for rent nearby; rentals at typical pace (median 19d on market — plan ~3-4 weeks tenant-placement turnaround); 1,059 units permitted in South Central Connecticut Planning Region in 2024 (779 in 5+ unit buildings).
- At $6,610/mo this rent would consume 160% of the median local household income ($50k/yr) (locally 1321% of renters already pay >50% of income on rent) — very limited rent-growth headroom before tenants either downsize or default.
Forward outlook
- In year one you build about $40k of equity ($3k loan paydown + $37k appreciation (9.8% local appreciation)).
- At projected returns (9.8% appreciation + 3.3% rent growth), your $106k cash investment doubles in ~2 years — after that, you're playing with house money.
- By year 2, paydown + projected appreciation supports a ~$64k cash-out refi (75% LTV) — recoverable capital for the next deal without selling this one.
Negotiation context
- It's been on market 96 days — a 9% lower offer ($346k) is reasonable based on typical stale-listing flexibility.
- 4 sale attempts since 20y ago; this cycle's ask is 12% above the opening price — seller raised mid-cycle; expect resistance to lowballs.
- Current owner paid $118k; list at $380k implies a 222% gain — meaningful room to come down on a strong offer.
Risks & watch-outs
- Watch-outs: built in 1900 — expect roof / HVAC / electrical / plumbing capex.
- Climate carrying-cost: major wind risk, 55% chance of damaging wind over 30y; extreme-heat days projected 7→16/yr by 2055 (HVAC capex compounding) — expect insurance premiums to compound above CPI over the hold.
Questions for the listing agent
- It's been on market 96 days. Have you received any prior offers? Is the seller open to a 9% concession, seller financing, or rate buy-down credit?
- Built in 1900 — when were the roof, HVAC, electrical panel, plumbing, and water heater last replaced?
- Why hasn't it sold? Are there any deal-killer items the seller is aware of (foundation, flood, title, zoning, code violations)?
- Is there a deadline driving the sale (1031 exchange, divorce, estate, relocation)? That informs how much negotiation room exists.
- Schools are D-rated, which usually means shorter tenancies and higher turnover. Who's the typical renter profile here, and what's been the actual vacancy rate?
- Crime grade is F in this area — have there been break-ins, vandalism, or insurance claims at this property in the last 3 years? What carrier currently insures it and at what premium?
- What's the average days-on-market for RENTAL listings here right now (not sales)? A rising rental-DOM trend means longer vacancies and softer asking-rent achievability than the comps imply.
- What's the recent tenant-quality profile in this submarket — average credit score on applications, eviction rate, late-payment / NSF rate, and stable-employment percentage? A property-management company in the area should have these aggregated.
- How much new apartment / multifamily construction is in the pipeline within 1–3 miles? Heavy new supply (>2% of stock underway) typically softens rents 12–24 months out; light construction supports rent growth.
Investment metrics
- 1% rule
- 1.74% ✓
- Cap rate
- 15.10%
- Cash-on-cash
- 31.44%
- DSCR
- 2.40
- GRM
- 4.8
CMA / ARV
- ARV (median comp)
- $337,342
- List price
- $379,900
- Delta
- 12.62%
- Verdict
- OVERPRICED
- Comps
- 20 within 1.0 mi
Show comp detail 1 sale within ~0.75 mi
| Address | Dist | Beds/Ba | Sqft | Sold | Price | $/sf | Match |
|---|---|---|---|---|---|---|---|
| 149 Greenwich Ave | 0.23mi | 2/2.0 | 1,548 (-6%) | 17mo | $278,000 | $180 | 65 |
Match score weights: distance 35% · size 25% · config 20% · recency 20%. Top-matched comps best support the ARV.
Projected returns pro-forma
9.81% appreciation · 3.3% rent growth · sell at horizon
- IRR
- 48.1%
- Equity multiple
- 4.59×
- Total profit
- $381,435
- Equity at exit
- $336,978
- IRR
- 42.2%
- Equity multiple
- 10.27×
- Total profit
- $986,459
- Equity at exit
- $721,174
Cash invested: $106,372 (down + closing). Projections, not guarantees.
Landlord ↔ Tenant lean methodology
- Overall (STATE)
- 27 Tenant-Leaning
- State Connecticut
- 27 Tenant-Leaning · D+7
- County
- — inherits STATE
- City
- — inherits STATE
ZIP-level market 06519
- Home prices YoY
- 2.7%
- Rents YoY
- 3.3%
- Active inventory
- 46
- Price-to-rent
- 14.4×
Monthly cashflow live
- Estimated rent
- $6,610 high interval (Pro) →
- Mortgage (P&I)
- −$1,992
- Tax from tax record
- −$284 /mo · $3,414/yr
- Insurance
- −$158
- HOA
- −$0
- Vacancy / Maint / Mgmt
- −$1,388
- Net cashflow
- $2,787
Break-even live
3-unit breakdown (identical units grouped — click to expand)
| Units | Beds | Baths | Est. rent |
|---|---|---|---|
| 3× units | 2 | 1 | $6,609 |
| #1 | 2 | 1 | $2,203 |
| #2 | 2 | 1 | $2,203 |
| #3 | 2 | 1 | $2,203 |
| Total (3 units) | $6,610 | ||
UW: 25.0% down · 7.5% · 30yr · 1.5% tax · 5.0% vac · 8.0% maint · 8.0% mgmt
Financing live
Cash to close
- Down payment
- $94,975
- Closing costs
- $11,397
- Reserves months
- —
- Total cash needed
- —
Loan-product check · same deal, 3 products live
Conventional
25% down · 7.5% · 30yr
- Down + closing
- —
- Monthly P&I
- —
- Monthly cashflow
- —
- DSCR
- —
- Eligible?
- —
Personal DTI + credit; lowest rate.
DSCR
20% down · 8.5% · 30yr
- Down + closing
- —
- Monthly P&I
- —
- Monthly cashflow
- —
- DSCR
- —
- Eligible?
- —
No personal income docs; deal must DSCR.
Hard money
10% down · 12.0% · 12mo
- Down + closing
- —
- Monthly P&I
- —
- Monthly cashflow
- —
- DSCR
- —
- Eligible?
- —
Short-term bridge; refi at stabilization.
Rent comps 40 comps
| Address | Beds | Baths | Sqft | Rent | $/sqft | DOM | Units | Dist |
|---|---|---|---|---|---|---|---|---|
| 216 Howard Ave New Haven, CT | 3.0 | 1.0 | 1204 | $2,600 | $2.16 | 2d | 1 | 0.03mi |
| 234 Howard Ave Apt 2 New Haven, CT | 3.0 | 1.0 | 1277 | $1,900 | $1.49 | 3d | 1 | 0.04mi |
| 222 Hallock Ave Unit 2 New Haven, CT | 2.0 | 1.0 | 2226 | $1,700 | $0.76 | 44d | 1 | 0.15mi |
| 65 1st St Unit 2 New Haven, CT | 2.0 | 1.0 | 1100 | $1,895 | $1.72 | 44d | 1 | 0.23mi |
| 69 Harbour Close #69 New Haven, CT | 2.0 | 2.5 | 1777 | $3,500 | $1.97 | 2d | 1 | 0.36mi |
| 133 Harbour Close New Haven, CT | 2.0 | 2.5 | 1587 | $3,500 | $2.21 | 2d | 1 | 0.40mi |
| 39 Hurlburt St Unit 2ND New Haven, CT | 3.0 | 1.0 | 1200 | $1,650 | $1.38 | 19d | 1 | 0.42mi |
| 48 Hurlburt St Unit 3 New Haven, CT | 2.0 | 1.0 | 1250 | $1,650 | $1.32 | 3d | 1 | 0.45mi |
| 123 Morris St Unit 2 New Haven, CT | 3.0 | 1.0 | 1150 | $1,900 | $1.65 | 3d | 1 | 0.52mi |
| 21 Edgar St Unit 2 New Haven, CT | 3.0 | 2.0 | 1380 | $2,100 | $1.52 | 44d | 1 | 0.57mi |
| 48 Truman St New Haven, CT | 3.0 | 1.0 | 1072 | $1,900 | $1.77 | 14d | 1 | 0.65mi |
| 232 Columbus Ave Unit 5 New Haven, CT | 2.0 | 1.5 | 1400 | $2,400 | $1.71 | 14d | 1 | 0.75mi |
| 45 Frank St New Haven, CT | 2.0 | 1.0 | 2120 | $1,650 | $0.78 | 44d | 1 | 0.77mi |
| 45 Frank St Unit 3 New Haven, CT | 1.0 | 1.0 | 2120 | $1,450 | $0.68 | 44d | 1 | 0.77mi |
| 16 Daggett St #1 New Haven, CT | 2.0 | 1.0 | 1515 | $1,800 | $1.19 | 3d | 1 | 0.84mi |
| 3 Bayview Pl Unit 2nd Floor West Haven, CT | 3.0 | 1.0 | 1276 | $2,600 | $2.04 | 2d | 1 | 0.86mi |
| 69 Center St West Haven, CT | 3.0 | 2.0 | 1530 | $2,000 | $1.31 | 14d | 1 | 0.88mi |
| 72 Main St Apt 1 West Haven, CT | 3.0 | 1.0 | 1098 | $2,300 | $2.09 | 2d | 1 | 0.88mi |
| 272 1st Ave Unit 1st floor West Haven, CT | 3.0 | 1.0 | 1250 | $2,100 | $1.68 | 44d | 1 | 0.89mi |
| 29 White St Unit 3 New Haven, CT | 3.0 | 1.0 | 1240 | $1,750 | $1.41 | 23d | 1 | 0.89mi |
| 9 Tower Ln New Haven, CT | 3.0 | 1.0–2.0 | 1054 | $4,345 | $4.12 | 2d | 74 | 0.91mi |
| 188 Lafayette St Unit 1383006P New Haven, CT | 2.0–3.0 | 1.0–2.0 | 1049 | $4,388 | $4.18 | 3d | 2 | 1.00mi |
| 433 3rd Ave Unit 2 West Haven, CT | 2.0 | 1.0 | 1722 | $1,700 | $0.99 | 44d | 1 | 1.09mi |
| 201 Center St West Haven, CT | 3.0 | 2.0 | 1376 | $2,400 | $1.74 | 44d | 1 | 1.17mi |
| 60 Baggott St West Haven, CT | 3.0 | 1.0 | 1242 | $2,300 | $1.85 | 23d | 1 | 1.18mi |
| 837 Washington Ave West Haven, CT | 2.0 | 1.0 | 2050 | $1,800 | $0.88 | 23d | 1 | 1.19mi |
| 20 Fair St New Haven, CT | 2.0 | 1.0–2.0 | 921 | $3,985 | $4.32 | 2d | 146 | 1.20mi |
| 46 Orchard St Unit 46B New Haven, CT | 3.0 | 2.0 | 1200 | $2,600 | $2.17 | 23d | 1 | 1.21mi |
| 46 Orchard St Unit 46A New Haven, CT | 3.0 | 2.0 | 1200 | $2,600 | $2.17 | 44d | 1 | 1.21mi |
| 54 Orchard St Unit 52B New Haven, CT | 3.0 | 2.0 | 1200 | $2,600 | $2.17 | 44d | 1 | 1.22mi |
| 90 Crown St New Haven, CT | 2.0 | 1.0–2.0 | 780 | $2,435 | $3.12 | 44d | 7 | 1.23mi |
| 116 Crown St Unit 3A New Haven, CT | 2.0 | 1.5 | 1541 | $3,450 | $2.24 | 23d | 1 | 1.24mi |
| 87 Union St New Haven, CT | 4.0 | 1.0–4.0 | 959 | $3,519 | $3.67 | 3d | 16 | 1.24mi |
| 100 Temple St New Haven, CT | 1.0–2.0 | 1.0–2.0 | 1088 | $2,931 | $2.69 | 21d | 6 | 1.24mi |
| 271 Elm St Unit 1 West Haven, CT | 2.0 | 1.0 | 1063 | $2,500 | $2.35 | 23d | 1 | 1.25mi |
| 196 Crown St Unit 5I New Haven, CT | 3.0 | 1.0 | 1344 | $2,500 | $1.86 | 44d | 1 | 1.26mi |
| 196 Crown St New Haven, CT | 1.0–3.0 | 1.0 | 993 | $2,225 | $2.24 | 2d | 2 | 1.26mi |
| 630 Chapel St New Haven, CT | 2.0 | 1.0–2.0 | 827 | $3,668 | $4.44 | 3d | 21 | 1.30mi |
| 23 Brown St New Haven, CT | 3.0 | 2.0 | 1350 | $2,650 | $1.96 | 3d | 1 | 1.33mi |
| 23 Brown St Unit 3 New Haven, CT | 3.0 | 1.0 | 1300 | $2,650 | $2.04 | 14d | 1 | 1.33mi |
Listing history 10 events
-
2026-05-15status Under Contract 157-char remark
Show marketing remark (157 chars)
Fantastic property for first time homeowners, investors and owner occupants. Great value-add opportunity. Motivated Seller will entertain all serious offers.
-
2026-03-28price $379,900 157-char remark
Show marketing remark (157 chars)
Fantastic property for first time homeowners, investors and owner occupants. Great value-add opportunity. Motivated Seller will entertain all serious offers.
-
2026-03-28status Active 157-char remark
Show marketing remark (157 chars)
Fantastic property for first time homeowners, investors and owner occupants. Great value-add opportunity. Motivated Seller will entertain all serious offers.
-
2026-01-22status Under Contract 157-char remark
Show marketing remark (157 chars)
Fantastic property for first time homeowners, investors and owner occupants. Great value-add opportunity. Motivated Seller will entertain all serious offers.
-
2025-12-04$340,000 Active 157-char remark
Show marketing remark (157 chars)
Fantastic property for first time homeowners, investors and owner occupants. Great value-add opportunity. Motivated Seller will entertain all serious offers.
-
2007-05-31historical
-
2007-01-04$205,900
-
2006-08-31historical
-
2006-02-23$224,900
-
2004-02-05soldstatus $118,000
ⓘ Source: listings_history table (triggers on properties + properties_extension) + one-shot
backfill from property_details.listing_events for pre-trigger history.
Tax reassessment forecast CT · Partial reset (capped growth)
- Current annual tax
- $3,414 · $284/mo
- Projected year-2 tax
- $5,772 · $481/mo
- Expected delta
- +$2,358/yr (+$196/mo · 69.1%)
ⓘ Screening estimate from a state-policy table — verify with the county assessor before closing.
Climate risk First Street
- Flood 1/10 Low FEMA zone X (unshaded) · 0% chance over 30 yrs
- Wildfire 1/10 Low
- Heat 7/10 Severe 7 d/yr ≥99°F today · 16 d/yr by 30 yrs out
- Wind 6/10 Major 55% chance of damaging wind over 30 yrs
- Air quality 5/10 Major 6 unhealthy d/yr today · 8 by 30 yrs out
Nearby sold comps map
Loading sold comps map…
Walkable amenities ~0.75 mi
Loading nearby amenities…
Taxation est. · year 1
- Rental income
- $79,320
- − Mortgage interest
- −$21,280
- − Property taxes
- −$3,414
- − Insurance
- −$1,900
- − Repairs & maintenance
- −$6,346
- − Management
- −$6,346
- − Depreciation
- −$11,052
- Taxable income
- $28,983
- Est. tax owed @ 24.0%
- −$6,956
- After-tax cash flow
- $26,486/yr
For passive investors: Depreciation is non-cash, so a rental often shows a tax loss while cash-flowing — sheltering income. Rental losses are passive: they offset passive income freely, and up to $25,000/yr can offset ordinary (W-2) income if you actively participate and your MAGI is under $100k (phasing out to $0 by $150k); unused losses carry forward. On sale, claimed depreciation is recaptured at up to 25%, and gains may owe capital-gains tax (a 1031 exchange can defer both). Figures are a year-1 estimate at your 24.0% rate — not tax advice; consult a CPA.
Schools (NCES district)
- District
- New Haven School District
- NCES district ID
- 0902790
- Math proficiency
- 12% ▼ -10.00%
- Reading proficiency
- 25% ▼ -10.00%
- Median HH income
- $38,058
- Composite
- 15.48/100
- National rank
- #9308
- State rank
- #147 of 153 in CT
Livability — New Haven
- Score
- 79/100
- State rank
- #31
- US rank
- #2190
Category grades
Schools grade is shown separately in the Schools card above.
Census & demographics
- Census place
- New Haven, CT
- County
- New Haven County · 688,236 people
- City population
- 132,813
- Metro
- New Haven-Milford, CT
- Population (ZIP)
- 15,605
- Household income
- $49,619
- Rent vs Own
- Severe rent burden
- 1321.0
Population outlook (South Central Connecticut County) Hauer SSP2
- By 2040
- 608,362
Race, ethnicity, and origin ACS 2023
- Neighborhood character
- Diverse neighborhood (Simpson 0.67)
- Race & ethnicity
- Hispanic / Latino 49% Black 26% White 15% Two or more races 13% Asian 4% Native American 1%
- Hispanic origin (detail)
- Mexican 15% Puerto Rican 25% Dominican 3%
- Common ancestry
- Romanian 1% Lithuanian 1%
- Foreign-born
- 25% · Canada, Jamaica, China
- Languages at home
- 50% English-only · Spanish 42% Other Indo-European 4% Arabic 1%
Political lean MEDSL · South Central Connecticut
- 2024 margin
- Strong D (+20.1) · D 59.0% · R 38.9% · Other 2.1%
- All cycles
- 2024: D+20.1
Not yet ingested
- Civics
- —
Market trends
- HPI YoY
- ▲ 9.81%
- Current HPI
- 377.4885
- Rent YoY
- ▲ 3.30%
- Metro
- New Haven-Milford, CT
- State GDP YoY
- ▲ 1.06%
- F500 in state
- 38
Industry mix (Fortune 500 HQ in CT)
| Industry | F500 HQs | Revenue |
|---|---|---|
| Industrial Machinery | 4 | $38B |
|
||
| Insurance | 3 | $71B |
|
||
| Financial Services | 2 | $25B |
|
||
| Transportation / Logistics | 2 | $18B |
|
||
| Healthcare | 1 | $247B |
|
||
| Telecommunications | 1 | $55B |
|
||
Price history
+221.9% since first listed10 events — show timeline
- 2026-05-15 Pending — Smart MLS
- 2026-03-28 Price Changed $379,900 Smart MLS
- 2026-03-28 Relisted — Smart MLS
- 2026-01-22 Pending — Smart MLS
- 2025-12-04 Listed $340,000 Smart MLS
- 2007-05-31 Listing Removed — Smart MLS
- 2007-01-04 Listed $205,900 Smart MLS
- 2006-08-31 Listing Removed — Smart MLS
- 2006-02-23 Listed $224,900 Smart MLS
- 2004-02-05 Sold (Public Records) $118,000 Public Records
Property tax history
+6.2%/yrLatest (2023): $3,414 · -6.4% YoY. Source: county tax records.
Cash-flow waterfall
monthlySold comps — $/sqft
last 12 mo · ≤1 miLoading sold comps…