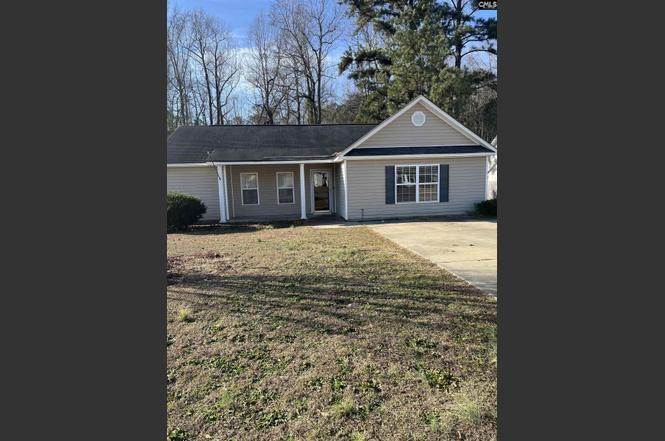
15 Derby Ln · Lugoff, SC
Flood risk 3/10 · Minor
- FEMA flood zone
- X (unshaded)
- Chance of flooding over 30 yrs
- 0.2%
- Est. flood insurance / yr
- $507 – $1,088
Fire risk 5/10 · Moderate
- Est. fire insurance / yr
- $783 – $1,453
Heat risk 7/10 · Major
- Hot days now (above 106°F)
- 7 days/yr
- Hot days in 30 yrs
- 16 days/yr
Wind risk 6/10 · Moderate
- Chance of severe wind over 30 yrs
- 70.0%
Air-quality risk 3/10 · Minor
- Unhealthy air days now
- 2 days/yr
- Unhealthy air days in 30 yrs
- 3 days/yr
Risk factors via First Street. Map © Google.
Why this score? — see what drove the C- grade
The composite is a weighted blend of 9 inputs, each scored 0–100. Each bar is that input's sub-score; the figure is the points it added to the 100-point composite (weight × sub-score).
- Cash flow +22.3/30.0
- ARV discount +7.5/15.0
- DSCR +7.1/10.0
- 1% rule +5.1/10.0
- Schools +3.8/10.0
- Livability +3.6/5.0
- Rent growth +2.5/5.0
- Condition / age +2.5/5.0
- Appreciation +0.0/10.0
$199,900
🖨 Deal sheet (PDF) 📄 Offer letter ✓ Due diligence
Listing remarks
Major price improvement! Move in ready! This spacious home features 3 bedrooms and 2 full bathrooms. Owner's bedroom features 2 walk-in closets. The kitchen has a newer refrigerator, dishwasher, microwave, and garbage disposal. Large sized backyard with shed that that backs up to wooded area. Located only minutes from shopping and restaurants. Easy access to I-20 and I-77. Disclaimer: CMLS has not reviewed and, therefore, does not endorse vendors who may appear in listings.
Key facts
- Walk-in closets
- Newer refrigerator
- Large sized backyard
Tags
Property features AI
Finance
- Other: Approximately 0.5 acre lot
Exterior
- Utilities: Public water; Public sewer
- Home design: Single-story property
- Construction: Slab foundation
- Exterior features: Vinyl exterior; Paved road access
Interior
- Bedrooms: Master bedroom on the main level
- Bathrooms: Two full bathrooms
- Interior features: Central heating and central air conditioning
Neighborhood map
What this means for you Summary
Snapshot
- This is a 3-bed/2.0-bath single-family listed at $200k.
Deal economics
- At list price, monthly cash flow is $330 ($4k/yr) — positive.
- The deal already cash-flows at list — no discount required.
- Meets the 1% rule at list price ($2k rent vs $200k).
- Recommended offer: $188k (6.0% below list) — sets the bar for market timing.
Location & tenants
- Location reads 71/100 on livability (#47 in SC) — a middle-class / working-renter tenant base. Strengths: cost of living A+, housing A+, health & safety A+; Watch: amenities F, commute F.
- Kershaw 01 (rural): math 38% / reading 51% proficiency, ranked #25 of 80 in SC (top 31%) — families likely to look elsewhere, expect single-tenant / working-renter base with shorter leases.
- Zoned schools: Lugoff Elementary (math 44% / reading 51%, grade D, #199 of 597 statewide, top 35%, 526 students, 100% FRL); Lugoff-Elgin High (math 65% / reading 89%, grade A-, #28 of 196 statewide, top 16%, 1,744 students, 62% FRL) — zoned schools average 81% FRL vs 49% district-wide (32 pts higher); higher-poverty schools than district average — tighter screening recommended.
- Zoned-school proficiency averages 62% at this address vs 44% district-wide (+18 pts) — the actual schools serving this property are materially stronger than the Kershaw 01 average implies; a family-tenant draw the district grade alone would hide.
- Market conditions: 178 active listings in the ZIP; 10 comparable units currently listed for rent nearby; rentals leasing fast (median 12d on market — plan ~1-2 weeks tenant-placement turnaround); 491 units permitted in Kershaw County in 2024 (0 in 5+ unit buildings).
- This rent runs 36% of the median local income ($68k/yr) — at the standard rent-burdened threshold; future hikes will face affordability resistance.
Forward outlook
- Local home prices are declining (-3.0%/yr); year-one equity from $1k of loan paydown is wiped out by about $6k of value loss. Plan a longer hold.
- Kershaw County population projected at +8% by 2050 — modest demand growth; plan on rents tracking national, not racing it.
Negotiation context
- It's been on market 84 days — a 6% lower offer ($188k) is reasonable based on typical stale-listing flexibility.
- 5 sale attempts since 3y ago with the ask held roughly flat each time — persistent listings suggest the price (not the market) is what's stuck; bring a comps-based counter.
Risks & watch-outs
- Climate carrying-cost: major wind risk, 70% chance of damaging wind over 30y; moderate wildfire risk; extreme-heat days projected 7→16/yr by 2055 (HVAC capex compounding) — expect insurance premiums to compound above CPI over the hold.
Questions for the listing agent
- It's been on market 84 days. Have you received any prior offers? Is the seller open to a 6% concession, seller financing, or rate buy-down credit?
- Why hasn't it sold? Are there any deal-killer items the seller is aware of (foundation, flood, title, zoning, code violations)?
- Is there a deadline driving the sale (1031 exchange, divorce, estate, relocation)? That informs how much negotiation room exists.
- What's the average days-on-market for RENTAL listings here right now (not sales)? A rising rental-DOM trend means longer vacancies and softer asking-rent achievability than the comps imply.
- What's the recent tenant-quality profile in this submarket — average credit score on applications, eviction rate, late-payment / NSF rate, and stable-employment percentage? A property-management company in the area should have these aggregated.
- How much new for-sale + rental construction is in the pipeline within 1–3 miles? Heavy new supply typically softens prices + rents 12–24 months out; constrained supply supports both.
Investment metrics
- 1% rule
- 1.01% ✓
- Cap rate
- 8.27%
- Cash-on-cash
- 7.07%
- DSCR
- 1.31
- GRM
- 8.3
CMA / ARV
No comps found within radius.
Projected returns pro-forma
-3.0% appreciation · 3.0% rent growth · sell at horizon
- IRR
- -5.5%
- Equity multiple
- 0.80×
- Total profit
- $-11,440
- Equity at exit
- $29,806
- IRR
- 4.1%
- Equity multiple
- 1.30×
- Total profit
- $16,902
- Equity at exit
- $17,284
Cash invested: $55,972 (down + closing). Projections, not guarantees.
Landlord ↔ Tenant lean methodology
- Overall (STATE)
- 90 Strongly Landlord-Friendly
- State South Carolina
- 90 Strongly Landlord-Friendly · R+6
- County
- — inherits STATE
- City
- — inherits STATE
ZIP-level market 29078
- Home prices YoY
- -22.9%
- Active inventory
- 178
- Price-to-rent
- 8.3×
Monthly cashflow live
- Estimated rent
- $2,017 high interval (Pro) →
- Mortgage (P&I)
- −$1,048
- Tax from tax record
- −$132 /mo · $1,588/yr
- Insurance
- −$83
- HOA
- −$0
- Vacancy / Maint / Mgmt
- −$424
- Net cashflow
- $330
Break-even live
Sensitivity live
| Price | -10% $443 | -5% $386 | +0% $330 | +5% $273 | +10% $216 |
|---|---|---|---|---|---|
| Rent | -10% $170 | -5% $250 | +0% $330 | +5% $409 | +10% $489 |
| Rate | -1.0pp $430 | -0.5pp $380 | base $330 | +0.5pp $278 | +1.0pp $225 |
UW: 25.0% down · 7.5% · 30yr · 1.5% tax · 5.0% vac · 8.0% maint · 8.0% mgmt
Financing live
Cash to close
- Down payment
- $49,975
- Closing costs
- $5,997
- Reserves months
- —
- Total cash needed
- —
Loan-product check · same deal, 3 products live
Conventional
25% down · 7.5% · 30yr
- Down + closing
- —
- Monthly P&I
- —
- Monthly cashflow
- —
- DSCR
- —
- Eligible?
- —
Personal DTI + credit; lowest rate.
DSCR
20% down · 8.5% · 30yr
- Down + closing
- —
- Monthly P&I
- —
- Monthly cashflow
- —
- DSCR
- —
- Eligible?
- —
No personal income docs; deal must DSCR.
Hard money
10% down · 12.0% · 12mo
- Down + closing
- —
- Monthly P&I
- —
- Monthly cashflow
- —
- DSCR
- —
- Eligible?
- —
Short-term bridge; refi at stabilization.
Rent comps 10 comps
| Address | Beds | Baths | Sqft | Rent | $/sqft | DOM | Units | Dist |
|---|---|---|---|---|---|---|---|---|
| 43 Derby Ln Lugoff, SC | 4.0 | 2.5 | 1818 | $2,150 | $1.18 | 15d | 1 | 0.08mi |
| 139 Triumph Ave Unit C Lugoff, SC | 3.0 | 2.5 | 1485 | $1,899 | $1.28 | 15d | 1 | 0.77mi |
| 260 Pine Point Rd Unit C Lugoff, SC | 3.0 | 2.5 | 1335 | $1,900 | $1.42 | 12d | 1 | 0.83mi |
| 300 Pine Point Rd Unit D Lugoff, SC | 3.0 | 2.5 | 1470 | $1,750 | $1.19 | 4d | 1 | 0.87mi |
| 1292 Champions Rest Rd Unit A Lugoff, SC | 3.0 | 2.5 | 1383 | $2,100 | $1.52 | 24d | 1 | 0.91mi |
| 1302 Champions Rest Rd Unit C Lugoff, SC | 3.0 | 2.5 | 1383 | $2,000 | $1.45 | 4d | 1 | 0.91mi |
| 1302 Champions Rest Rd Unit B Lugoff, SC | 3.0 | 2.5 | 1383 | $1,900 | $1.37 | 4d | 1 | 0.92mi |
| 40 State Rd S-28-910 Lugoff, SC | 1.0–3.0 | 1.0–2.0 | 930 | $1,249 | $1.34 | 3d | 3 | 0.93mi |
| 186 State Rd S-28-743 Lugoff, SC | 2.0–3.0 | 2.0 | 1025 | $1,199 | $1.17 | 3d | 6 | 1.18mi |
| 148 Standard Warehouse Rd Unit 148B Lugoff, SC | 2.0 | 1.5 | 1190 | $1,250 | $1.05 | 24d | 1 | 1.32mi |
Listing history 14 events
-
2026-06-02statusdays on market $199,900 Pending 84 DOM
-
2026-05-31days on market $199,900 Active - Contingent 83 DOM
-
2026-05-18historical Active - Contingent
-
2026-05-04price $199,900
-
2026-03-09$210,000 Active
-
2026-01-23status Pending
-
2026-01-05$210,000 Active
-
2024-05-22price $210,000
-
2024-05-09$225,000 Active
-
2023-03-29soldstatus $210,000
-
2023-03-06status Active
-
2023-03-01$215,000 Active
-
2015-09-03soldstatus $90,000
-
2004-07-21soldstatus $19,000
ⓘ Source: listings_history table (triggers on properties + properties_extension) + one-shot
backfill from property_details.listing_events for pre-trigger history.
Tax reassessment forecast SC · Resets to sale price
- Current annual tax
- $1,588 · $132/mo
- Projected year-2 tax
- $1,588 · $132/mo
- Expected delta
- $0/yr ($0/mo · -0.0%)
ⓘ Screening estimate from a state-policy table — verify with the county assessor before closing.
Climate risk First Street
- Flood 3/10 Moderate FEMA zone X (unshaded) · 20% chance over 30 yrs
- Wildfire 5/10 Major
- Heat 7/10 Severe 7 d/yr ≥106°F today · 16 d/yr by 30 yrs out
- Wind 6/10 Major 70% chance of damaging wind over 30 yrs
- Air quality 3/10 Moderate 2 unhealthy d/yr today · 3 by 30 yrs out
Nearby sold comps map
Loading sold comps map…
Walkable amenities ~0.75 mi
Loading nearby amenities…
Taxation est. · year 1
- Rental income
- $24,206
- − Mortgage interest
- −$11,198
- − Property taxes
- −$1,588
- − Insurance
- −$1,000
- − Repairs & maintenance
- −$1,936
- − Management
- −$1,936
- − Depreciation
- −$5,815
- Taxable income
- $733
- Est. tax owed @ 24.0%
- −$176
- After-tax cash flow
- $3,780/yr
For passive investors: Depreciation is non-cash, so a rental often shows a tax loss while cash-flowing — sheltering income. Rental losses are passive: they offset passive income freely, and up to $25,000/yr can offset ordinary (W-2) income if you actively participate and your MAGI is under $100k (phasing out to $0 by $150k); unused losses carry forward. On sale, claimed depreciation is recaptured at up to 25%, and gains may owe capital-gains tax (a 1031 exchange can defer both). Figures are a year-1 estimate at your 24.0% rate — not tax advice; consult a CPA.
Schools (NCES district)
- District
- Kershaw 01
- NCES district ID
- 4502550
- Math proficiency
- 38% ▼ -7.00%
- Reading proficiency
- 51% ▲ 6.00%
- Median HH income
- $44,585
- Composite
- 37.66/100
- National rank
- #4371
- State rank
- #25 of 80 in SC
Livability — Lugoff
- Score
- 71/100
- State rank
- #47
- US rank
- #6636
Category grades
Schools grade is shown separately in the Schools card above.
Census & demographics
- Census place
- Lugoff, SC
- County
- Kershaw County · 47,655 people
- City population
- 16,283
- Metro
- Columbia, SC
- Population (ZIP)
- 16,283
- Household income
- $67,727
- Rent vs Own
- Severe rent burden
- 61.0
Population outlook (Kershaw County) Hauer SSP2
- Today (2025)
- 67,683 people
- By 2030
- 69,374 · +2.5%
- By 2040
- 71,936 · +6.3%
- By 2050
- 73,292 · +8.3%
- By 2075
- 75,762 · +11.9%
- By 2100
- 72,620 · +7.3%
Race, ethnicity, and origin ACS 2023
- Neighborhood character
- Predominantly White (74%)
- Race & ethnicity
- White 74% Black 18% Hispanic / Latino 6% Two or more races 4%
- Hispanic origin (detail)
- Puerto Rican 3%
- Common ancestry
- Italian 2% Lithuanian 2% Slovak 1%
- Foreign-born
- 2% · Canada
- Languages at home
- 93% English-only · Spanish 6%
Political lean MEDSL · Kershaw
- 2024 margin
- Strong R (+28.2) · D 35.3% · R 63.5% · Other 1.2%
- 2008→2024 swing
- -9.5pp toward R · 2008: -18.7pp · 2024: -28.2pp
- All cycles
- 2024: R+28.2 2020: R+23.1 2016: R+24.8 2012: R+18.6 2008: R+18.7
Not yet ingested
- Civics
- —
Market trends
- HPI YoY
- ▼ -62.83%
- Current HPI
- 211.3661
- Rent YoY
- —
- Metro
- Columbia, SC
- State GDP YoY
- ▲ 4.51%
- F500 in state
- 2
Industry mix (Fortune 500 HQ in SC)
| Industry | F500 HQs | Revenue |
|---|---|---|
| Packaging | 1 | $7B |
|
||
Price history
+952.1% since first listed12 events — show timeline
- 2026-05-18 Contingent — Consolidated MLS
- 2026-05-04 Price Changed $199,900 Consolidated MLS
- 2026-03-09 Listed $210,000 Consolidated MLS
- 2026-01-23 Pending — Consolidated MLS
- 2026-01-05 Listed $210,000 Consolidated MLS
- 2024-05-22 Price Changed $210,000 Consolidated MLS
- 2024-05-09 Listed $225,000 Consolidated MLS
- 2023-03-29 Sold (Public Records) $210,000 Public Records
- 2023-03-06 Relisted — Consolidated MLS
- 2023-03-01 Listed $215,000 Consolidated MLS
- 2015-09-03 Sold (Public Records) $90,000 Public Records
- 2004-07-21 Sold (Public Records) $19,000 Public Records
Property tax history
+7.6%/yrLatest (2025): $1,588 · +6.4% YoY. Source: county tax records.
Cash-flow waterfall
monthlySold comps — $/sqft
last 12 mo · ≤1 miLoading sold comps…