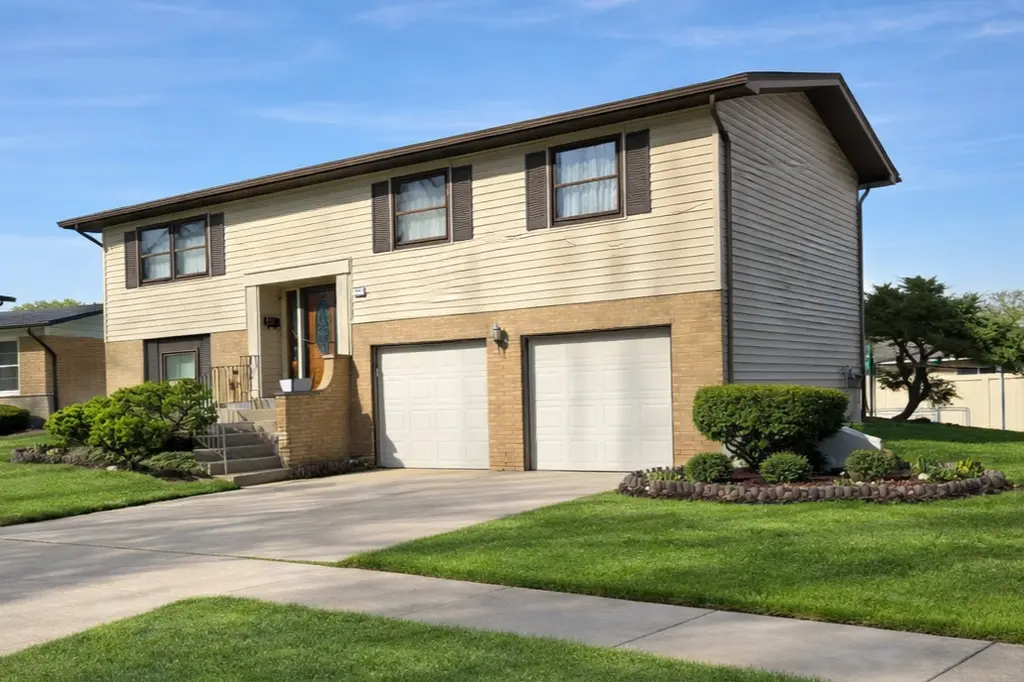
807 W Manor Ct W · Glenwood, IL
Flood risk 1/10 · Minimal
- FEMA flood zone
- X (unshaded)
- Chance of flooding over 30 yrs
- 0.0%
- Est. flood insurance / yr
- $473 – $860
Fire risk 1/10 · Minimal
- Est. fire insurance / yr
- $804 – $1,492
Heat risk 3/10 · Minor
- Hot days now (above 101°F)
- 7 days/yr
- Hot days in 30 yrs
- 15 days/yr
Wind risk 2/10 · Minimal
- Chance of severe wind over 30 yrs
- —
Air-quality risk 4/10 · Minor
- Unhealthy air days now
- 4 days/yr
- Unhealthy air days in 30 yrs
- 5 days/yr
Risk factors via First Street. Map © Google.
Why this score? — see what drove the D+ grade
The composite is a weighted blend of 9 inputs, each scored 0–100. Each bar is that input's sub-score; the figure is the points it added to the 100-point composite (weight × sub-score).
- Cash flow +16.3/30.0
- ARV discount +8.5/15.0
- 1% rule +5.7/10.0
- DSCR +5.1/10.0
- Livability +3.3/5.0
- Rent growth +2.5/5.0
- Condition / age +2.5/5.0
- Schools +2.4/10.0
- Appreciation +0.0/10.0
$239,900
🖨 Deal sheet 📄 Offer letter ✓ Due diligence
Listing remarks
Welcome FHA & VA buyers! This beautiful bi-level home shows extremely well. .. The exterior & interior compliment this well cared for home. Fenced rear yard accompanied by a shed. Current sellers are relocating. During the time of ownership this house has been well cared for. The full bath has an accessible shower, however there is no standard bathtub in this home. Sellers may be willing to sell off some of their current furniture upon relocating. Lots of updates & improvements, schedule your showing. ..
Key facts
- Shed
- Fenced in large yard
- 7,750 sq ft lot
Tags
Property features AI
Finance
- Other: Property is fee simple ownership; Living area reported as estimated; total finished area approx. 2,032; Lot dimensions approximately 62 x 125 (less than 0.25 acre); Built before 1978
- HOA & community: No master association fee required
Exterior
- Parking: Attached garage with 2 garage spaces; Concrete driveway; Garage door opener; garage is owned
- Utilities: Public water; Public sewer; Electric service with circuit breakers
- Home design: Detached single-family home; Raised ranch / bi-level design; Entry level spans main and lower levels; Facing direction not specified
- Construction: Built approximately 51–60 years ago; Brick and frame construction; Asphalt roof; Concrete perimeter foundation
- Exterior features: Patio
Interior
- Kitchen: Range; Microwave; Dishwasher; Refrigerator; Eating area with breakfast bar (kitchen approx. 13 x 12, vinyl flooring)
- Bedrooms: 4 bedrooms total; Master bedroom on the main level (16 x 12, carpet); Bedroom 2 on the main level (13 x 12, vinyl); Bedroom 3 on the main level (10 x 12, vinyl); Bedroom 4 on the lower level (13 x 10)
- Flooring: Vinyl flooring in living areas, dining room and most bedrooms; Carpet in master bedroom and family room
- Bathrooms: 1 full bathroom; 1 half bathroom; Accessible shower, no tub
- Heating & cooling: Forced air natural gas heating; Central air conditioning
- Interior features: Dining combo layout; Screens on windows; One fireplace in the family room; Eight total rooms
- Laundry & utility: In-unit laundry with gas dryer hookup, sink (laundry room approx. 4 x 6, vinyl); Washer; Dryer
Neighborhood map
What this means for you Summary
Snapshot
- This is a 3-bed/1.5-bath single-family listed at $240k.
Deal economics
- At list price, monthly cash flow is $133 ($2k/yr) — positive.
- The deal already cash-flows at list — no discount required.
- Meets the 1% rule at list price ($3k rent vs $240k).
- Recommended offer: $226k (6.0% below list) — sets the bar for market timing.
Location & tenants
- Location reads 66/100 on livability (#545 in IL) — a middle-class / working-renter tenant base. Strengths: cost of living A+, housing A+, employment B; Watch: health & safety D+, amenities F, commute F.
- Homewood Flossmoor Chsd 233 (suburban): math 21% / reading 27% proficiency, ranked #272 of 620 in IL (top 44%) — low school quality limits family demand, transient renter base, plan for 1-2y turnover.
- Zoned schools: Homewood-Flossmoor High School (math 21% / reading 27%, grade F, #304 of 693 statewide, top 44%, 2,798 students, 0% FRL).
- Market conditions: 53 active listings in the ZIP; 2 comparable units currently listed for rent nearby; 6,272 units permitted in Cook County in 2024 (4,658 in 5+ unit buildings).
Forward outlook
- Local home prices are declining (-3.0%/yr); year-one equity from $2k of loan paydown is wiped out by about $7k of value loss. Plan a longer hold.
Negotiation context
- It's been on market 73 days — a 6% lower offer ($226k) is reasonable based on typical stale-listing flexibility.
- 2 sale attempts with the ask held roughly flat each time — persistent listings suggest the price (not the market) is what's stuck; bring a comps-based counter.
- Current owner paid $124k; list at $240k implies a 94% gain — meaningful room to come down on a strong offer.
Risks & watch-outs
- Watch-outs: property tax is 2.7% of price.
Questions for the listing agent
- It's been on market 73 days. Have you received any prior offers? Is the seller open to a 6% concession, seller financing, or rate buy-down credit?
- Built in 1968 — when were the roof, HVAC, electrical panel, plumbing, and water heater last replaced?
- Property tax is high relative to price — has the assessment been appealed recently, and will the sale trigger a re-assessment?
- Why hasn't it sold? Are there any deal-killer items the seller is aware of (foundation, flood, title, zoning, code violations)?
- Is there a deadline driving the sale (1031 exchange, divorce, estate, relocation)? That informs how much negotiation room exists.
- Schools are F-rated, which usually means shorter tenancies and higher turnover. Who's the typical renter profile here, and what's been the actual vacancy rate?
- The area grade is low — what's the realistic commute time and amenity access for the typical tenant pool here? Any planned neighborhood developments (good or bad) we should know about?
- What's the average days-on-market for RENTAL listings here right now (not sales)? A rising rental-DOM trend means longer vacancies and softer asking-rent achievability than the comps imply.
- What's the recent tenant-quality profile in this submarket — average credit score on applications, eviction rate, late-payment / NSF rate, and stable-employment percentage? A property-management company in the area should have these aggregated.
- How much new for-sale + rental construction is in the pipeline within 1–3 miles? Heavy new supply typically softens prices + rents 12–24 months out; constrained supply supports both.
Investment metrics
- 1% rule
- 1.07% ✓
- Cap rate
- 6.96%
- Cash-on-cash
- 2.38%
- DSCR
- 1.11
- GRM
- 7.8
CMA / ARV
- ARV (on-the-fly)
- $245,168
- Comps found
- 12
Show comp detail 12 sales within ~0.75 mi
| Address | Dist | Beds/Ba | Sqft | Sold | Price | $/sf | Match |
|---|---|---|---|---|---|---|---|
| 807 W Manor Ct W | 0.00mi | 4/1.5 (+1) | 1,232 (0%) | 1mo | $245,000 | $199 | 94 |
| 900 W Strieff Ln | 0.30mi | 3/1.5 | 1,269 (+3%) | 3mo | $210,000 | $165 | 78 |
| 705 W Fitzhenry Ct | 0.17mi | 3/2.0 | 1,367 (+11%) | 4mo | $164,000 | $120 | 68 |
| 18430 Aberdeen St | 0.65mi | 3/2.0 | 1,223 (-1%) | 0mo | $242,000 | $198 | 66 |
| 914 Coach Rd | 0.66mi | 3/1.5 | 1,197 (-3%) | 0mo | $275,000 | $230 | 64 |
| 527 N Virginia Ave | 0.27mi | 4/2.0 (+1) | 1,100 (-11%) | 0mo | $297,797 | $271 | 62 |
| 1129 183rd St | 0.67mi | 3/2.0 | 1,216 (-1%) | 5mo | $219,150 | $180 | 61 |
| 330 N Illinois Ave | 0.55mi | 3/1.5 | 1,309 (+6%) | 5mo | $235,000 | $180 | 60 |
| 945 W 187th St | 0.67mi | 4/1.5 (+1) | 1,197 (-3%) | 4mo | $244,000 | $204 | 56 |
| 313 N Park Dr | 0.40mi | 4/2.0 (+1) | 1,064 (-14%) | 2mo | $210,000 | $197 | 50 |
| 214 N Gay Ct | 0.49mi | 4/2.0 (+1) | 1,088 (-12%) | 3mo | $294,000 | $270 | 48 |
| 18144 Aberdeen St | 0.68mi | 4/2.0 (+1) | 1,100 (-11%) | 4mo | $245,000 | $223 | 40 |
Match score weights: distance 35% · size 25% · config 20% · recency 20%. Top-matched comps best support the ARV.
Projected returns pro-forma
-3.0% appreciation · 3.0% rent growth · sell at horizon
- IRR
- -12.4%
- Equity multiple
- 0.55×
- Total profit
- $-30,219
- Equity at exit
- $35,770
- IRR
- -3.3%
- Equity multiple
- 0.78×
- Total profit
- $-14,665
- Equity at exit
- $20,742
Cash invested: $67,172 (down + closing). Projections, not guarantees.
Landlord ↔ Tenant lean methodology
- Overall (STATE)
- 43 Moderately Tenant-Leaning
- State Illinois
- 43 Moderately Tenant-Leaning · D+7
- County
- — inherits STATE
- City
- — inherits STATE
ZIP-level market 60425
- Home prices YoY
- -10.6%
- Active inventory
- 53
- Price-to-rent
- 7.8×
Monthly cashflow live
- Estimated rent
- $2,561 medium interval (Pro) →
- Mortgage (P&I)
- −$1,258
- Tax from tax record
- −$532 /mo · $6,389/yr
- Insurance
- −$100
- HOA
- −$0
- Vacancy / Maint / Mgmt
- −$538
- Net cashflow
- $133
Break-even live
UW: 25.0% down · 7.5% · 30yr · 1.5% tax · 5.0% vac · 8.0% maint · 8.0% mgmt
Financing live
Cash to close
- Down payment
- $59,975
- Closing costs
- $7,197
- Reserves months
- —
- Total cash needed
- —
Loan-product check · same deal, 3 products live
Conventional
25% down · 7.5% · 30yr
- Down + closing
- —
- Monthly P&I
- —
- Monthly cashflow
- —
- DSCR
- —
- Eligible?
- —
Personal DTI + credit; lowest rate.
DSCR
20% down · 8.5% · 30yr
- Down + closing
- —
- Monthly P&I
- —
- Monthly cashflow
- —
- DSCR
- —
- Eligible?
- —
No personal income docs; deal must DSCR.
Hard money
10% down · 12.0% · 12mo
- Down + closing
- —
- Monthly P&I
- —
- Monthly cashflow
- —
- DSCR
- —
- Eligible?
- —
Short-term bridge; refi at stabilization.
Rent comps 2 comps
| Address | Beds | Baths | Sqft | Rent | $/sqft | DOM | Units | Dist |
|---|---|---|---|---|---|---|---|---|
| 18117 Loomis Ave Homewood, IL | 4.0 | 2.0 | 1500 | $2,800 | $1.87 | 3d | 1 | 1.04mi |
| 208 Blackstone St Thornton, IL | 2.0 | 1.5 | 923 | $2,200 | $2.38 | 1d | 1 | 1.44mi |
Listing history 6 events
-
2026-04-18historical Contingent - Continue to Show
-
2026-03-30status Active
-
2026-03-20historical Contingent - Continue to Show
-
2026-03-12$239,900 Active
-
1999-07-22soldstatus $123,500
-
1977-04-04soldstatus $54,000
ⓘ Source: listings_history table (triggers on properties + properties_extension) + one-shot
backfill from property_details.listing_events for pre-trigger history.
Tax reassessment forecast IL · Partial reset (capped growth)
- Current annual tax
- $6,389 · $532/mo
- Projected year-2 tax
- $6,389 · $532/mo
- Expected delta
- $0/yr ($0/mo · 0.0%)
ⓘ Screening estimate from a state-policy table — verify with the county assessor before closing.
Climate risk First Street
- Flood 1/10 Low FEMA zone X (unshaded) · 0% chance over 30 yrs
- Wildfire 1/10 Low
- Heat 3/10 Moderate 7 d/yr ≥101°F today · 15 d/yr by 30 yrs out
- Wind 2/10 Low
- Air quality 4/10 Moderate 4 unhealthy d/yr today · 5 by 30 yrs out
Nearby sold comps map
Loading sold comps map…
Walkable amenities ~0.75 mi
Loading nearby amenities…
Taxation est. · year 1
- Rental income
- $30,737
- − Mortgage interest
- −$13,438
- − Property taxes
- −$6,389
- − Insurance
- −$1,200
- − Repairs & maintenance
- −$2,459
- − Management
- −$2,459
- − Depreciation
- −$6,979
- Taxable loss
- −$2,187
- Est. tax savings @ 24.0%
- +$525
- After-tax cash flow
- $2,121/yr
For passive investors: Depreciation is non-cash, so a rental often shows a tax loss while cash-flowing — sheltering income. Rental losses are passive: they offset passive income freely, and up to $25,000/yr can offset ordinary (W-2) income if you actively participate and your MAGI is under $100k (phasing out to $0 by $150k); unused losses carry forward. On sale, claimed depreciation is recaptured at up to 25%, and gains may owe capital-gains tax (a 1031 exchange can defer both). Figures are a year-1 estimate at your 24.0% rate — not tax advice; consult a CPA.
Schools (NCES district)
- District
- Homewood Flossmoor Chsd 233
- NCES district ID
- 1719560
- Math proficiency
- 21% ▼ -15.00%
- Reading proficiency
- 27% ▼ -13.00%
- Median HH income
- $83,564
- Composite
- 24.42/100
- National rank
- #7681
- State rank
- #272 of 620 in IL
Livability — Glenwood
- Score
- 66/100
- State rank
- #545
- US rank
- #11292
Category grades
Schools grade is shown separately in the Schools card above.
Census & demographics
- Census place
- Glenwood, IL
- City population
- 8,730
- Population (ZIP)
- 8,730
Population outlook (Cook County) Hauer SSP2
- Today (2025)
- 5,347,519 people
- By 2030
- 5,357,703 · +0.2%
- By 2040
- 5,324,924 · -0.4%
- By 2050
- 5,230,762 · -2.2%
- By 2075
- 4,785,735 · -10.5%
- By 2100
- 4,188,836 · -21.7%
Race, ethnicity, and origin ACS 2023
- Neighborhood character
- Predominantly Black (68%)
- Race & ethnicity
- Black 68% White 22% Hispanic / Latino 6% Two or more races 4%
- Hispanic origin (detail)
- Mexican 5%
- Common ancestry
- Romanian 3% Iranian 1% Lithuanian 1%
- Foreign-born
- 3% · Canada
- Languages at home
- 95% English-only · Spanish 4%
Political lean MEDSL · Cook
- 2024 margin
- Solid D (+42.0) · D 70.4% · R 28.4% · Other 1.2%
- 2008→2024 swing
- -11.4pp toward R · 2008: 53.4pp · 2024: 42.0pp
- All cycles
- 2024: D+42.0 2020: D+50.3 2016: D+53.0 2012: D+49.4 2008: D+53.4
Not yet ingested
- Civics
- —
Market trends
- HPI YoY
- ▼ -37.24%
- Current HPI
- 314.1777
- Rent YoY
- —
- Metro
- —
- State GDP YoY
- ▲ 1.59%
- F500 in state
- 60
Industry mix (Fortune 500 HQ in IL)
| Industry | F500 HQs | Revenue |
|---|---|---|
| Insurance | 4 | $201B |
|
||
| Consumer Goods | 4 | $87B |
|
||
| Industrial Machinery | 3 | $64B |
|
||
| Healthcare | 2 | $55B |
|
||
| Retail / Pharmacy | 1 | $148B |
|
||
| Agriculture / Food | 1 | $86B |
|
||
Price history
+344.3% since first listed6 events — show timeline
- 2026-04-18 Contingent — MRED as Distributed by MLS Grid
- 2026-03-30 Relisted — MRED as Distributed by MLS Grid
- 2026-03-20 Contingent — MRED as Distributed by MLS Grid
- 2026-03-12 Listed $239,900 MRED as Distributed by MLS Grid
- 1999-07-22 Sold (Public Records) $123,500 Public Records
- 1977-04-04 Sold (Public Records) $54,000 Public Records
Property tax history
+4.2%/yrLatest (2023): $6,389 · +87.5% YoY. Source: county tax records.
Cash-flow waterfall
monthlySold comps — $/sqft
last 12 mo · ≤1 miLoading sold comps…