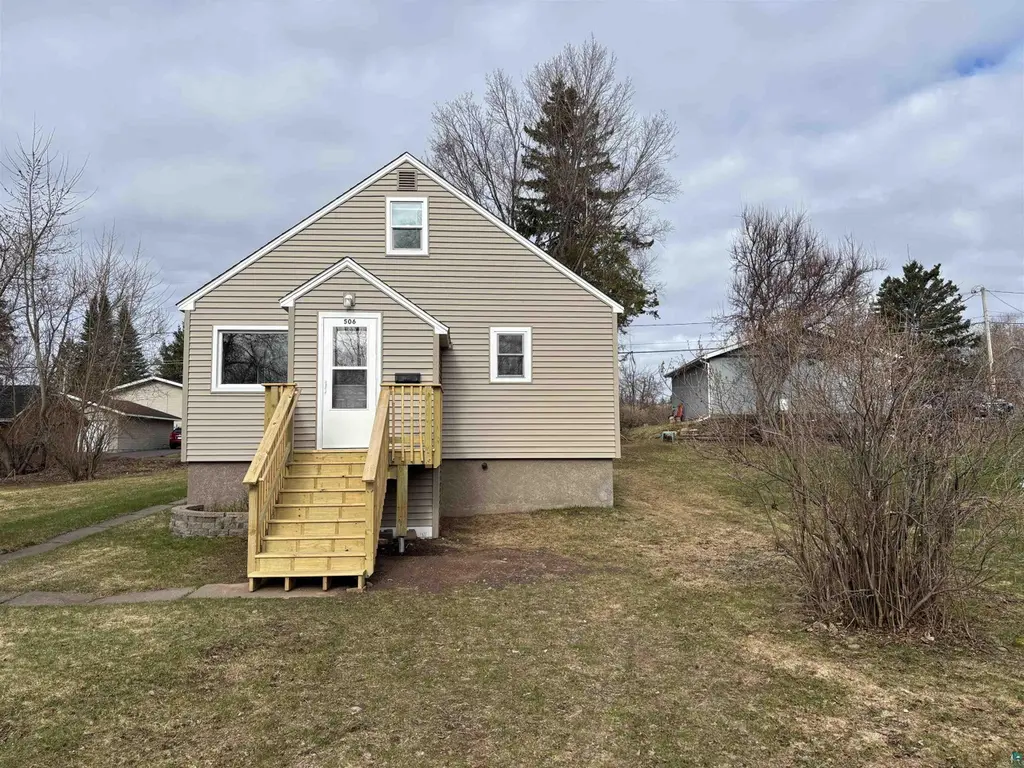
506 Midway Ave · Proctor, MN
Flood risk 1/10 · Minimal
- FEMA flood zone
- X
- Chance of flooding over 30 yrs
- 0.0%
- Est. flood insurance / yr
- $473 – $860
Fire risk 3/10 · Minor
- Est. fire insurance / yr
- $888 – $1,650
Heat risk 1/10 · Minimal
- Hot days now (above 90°F)
- 7 days/yr
- Hot days in 30 yrs
- 13 days/yr
Wind risk 1/10 · Minimal
- Chance of severe wind over 30 yrs
- —
Air-quality risk 1/10 · Minimal
- Unhealthy air days now
- 0 days/yr
- Unhealthy air days in 30 yrs
- 0 days/yr
Risk factors via First Street. Map © Google.
Why this score? — see what drove the D+ grade
The composite is a weighted blend of 9 inputs, each scored 0–100. Each bar is that input's sub-score; the figure is the points it added to the 100-point composite (weight × sub-score).
- Cash flow +12.4/30.0
- Appreciation +10.0/10.0
- ARV discount +7.5/15.0
- Schools +3.9/10.0
- Livability +3.8/5.0
- DSCR +3.7/10.0
- 1% rule +2.9/10.0
- Rent growth +2.5/5.0
- Condition / age +2.5/5.0
$170,000
🖨 Deal sheet (PDF) 📄 Offer letter ✓ Due diligence
Listing remarks
This home was just updated in 2026! Updates include new siding, new gutters, new flooring, new kitchen, new windows & doors, new water heater and more! The home has an appraised market value of $220,000 but is being sold $50,000 below market value to income qualified buyers. Home must be owner-occupied and buyer’s gross annual income cannot exceed the following (household size in parenthesis): $56,650 (1); $64,750 (2); $72,850 (3); $80,900 (4); $87,400 (5); $93,850 (6) $100,350 (7) $106,800 (8).
Key facts
- 8,712 sq ft lot
- Built 1916
- Listed 14 days
Property features AI
Finance
- Financial info: Monthly land lease of $38
Exterior
- Parking: No dedicated parking
- Utilities: Public water; Public sewer
- Home design: Single-family detached home; Single-story
- Construction: Above-grade finished living area listed as 1,051
- Exterior features: Asphalt shingle roof; Lot dimensions approximately 80 x 125
Interior
- Bedrooms: Master on main level
- Bathrooms: 1 full bathroom
- Heating & cooling: Forced air heating; Natural gas heating
- Interior features: Master bedroom located on the main level; Full, unfinished basement
Neighborhood map
What this means for you Summary
Snapshot
- This is a 4-bed/2.0-bath other listed at $170k.
Deal economics
- At list price, monthly cash flow is $-28 ($-342/yr) — negative.
- To cash-flow at today's rent, offer at most $165k (3.0% below list).
- To meet the 1% rule (rent ≥ 1% of price), the offer needs to be $135k (20.7% below list).
- Recommended offer: $135k (20.7% below list) — sets the bar for 1% rule.
Location & tenants
- Location reads 75/100 on livability (#184 in MN, #3,966 nationally) — a middle-class / working-renter tenant base. Strengths: crime A+, commute A+, cost of living A+; Watch: health & safety D, amenities F.
- Proctor Public School District (suburban): math 39% / reading 49% proficiency, ranked #177 of 301 in MN (top 59%) — families likely to look elsewhere, expect single-tenant / working-renter base with shorter leases.
- Zoned schools: Bay View Elementary (math 52% / reading 52%, grade C-, #368 of 857 statewide, top 47%, 588 students, 42% FRL); A.I. Jedlicka Middle School (math 21% / reading 39%, grade F, #199 of 258 statewide, top 78%, 448 students, 42% FRL); Proctor Senior High (math 42% / reading 67%, grade C-, #87 of 471 statewide, top 22%, 551 students, 36% FRL) — zoned schools average 40% FRL vs 22% district-wide (18 pts higher); higher-poverty schools than district average — tighter screening recommended.
- Market conditions: 51 active listings in the ZIP; 639 units permitted in St. Louis County in 2024 (338 in 5+ unit buildings).
Forward outlook
- In year one you build about $18k of equity ($1k loan paydown + $17k appreciation (10.0% local appreciation)).
- At projected returns (10.0% appreciation + 3.0% rent growth), your $48k cash investment doubles in ~3 years — after that, you're playing with house money.
- By year 3, paydown + projected appreciation supports a ~$46k cash-out refi (75% LTV) — recoverable capital for the next deal without selling this one.
Negotiation context
- Only 14 days on market — expect competitive offers; lowballing is unlikely to land.
Risks & watch-outs
- Watch-outs: built in 1916 — expect roof / HVAC / electrical / plumbing capex.
Questions for the listing agent
- What do current leases actually rent for vs. the listed asking? Can we see a recent rent roll and the last 12 months of T-12 income?
- Built in 1916 — when were the roof, HVAC, electrical panel, plumbing, and water heater last replaced?
- Is there a deadline driving the sale (1031 exchange, divorce, estate, relocation)? That informs how much negotiation room exists.
- Schools are B-rated — typically a magnet for longer-tenancy family renters. What's the average tenant stay here, and is there a school-zone premium baked into asking?
- The area grade is low — what's the realistic commute time and amenity access for the typical tenant pool here? Any planned neighborhood developments (good or bad) we should know about?
- What's the average days-on-market for RENTAL listings here right now (not sales)? A rising rental-DOM trend means longer vacancies and softer asking-rent achievability than the comps imply.
- What's the recent tenant-quality profile in this submarket — average credit score on applications, eviction rate, late-payment / NSF rate, and stable-employment percentage? A property-management company in the area should have these aggregated.
- How much new for-sale + rental construction is in the pipeline within 1–3 miles? Heavy new supply typically softens prices + rents 12–24 months out; constrained supply supports both.
Investment metrics
- 1% rule
- 0.79% ✗
- Cap rate
- 6.09%
- Cash-on-cash
- -0.72%
- DSCR
- 0.97
- GRM
- 10.5
CMA / ARV
No comps found within radius.
Projected returns pro-forma
10.0% appreciation · 3.0% rent growth · sell at horizon
- IRR
- 23.8%
- Equity multiple
- 2.91×
- Total profit
- $90,744
- Equity at exit
- $153,149
- IRR
- 21.1%
- Equity multiple
- 6.64×
- Total profit
- $268,595
- Equity at exit
- $330,273
Cash invested: $47,600 (down + closing). Projections, not guarantees.
Landlord ↔ Tenant lean methodology
- Overall (STATE)
- 46 Balanced
- State Minnesota
- 46 Balanced · D+2
- County
- — inherits STATE
- City
- — inherits STATE
ZIP-level market 55810
- Home prices YoY
- 11.6%
- Active inventory
- 51
- Price-to-rent
- 10.5×
Monthly cashflow live
- Estimated rent
- $1,349 medium interval (Pro) →
- Mortgage (P&I)
- −$891
- Tax from tax record
- −$132 /mo · $1,580/yr
- Insurance
- −$71
- HOA
- −$0
- Vacancy / Maint / Mgmt
- −$283
- Net cashflow
- $-28
Break-even live
Sensitivity live
| Price | -10% $68 | -5% $20 | +0% $-28 | +5% $-77 | +10% $-125 |
|---|---|---|---|---|---|
| Rent | -10% $-135 | -5% $-82 | +0% $-28 | +5% $25 | +10% $78 |
| Rate | -1.0pp $57 | -0.5pp $15 | base $-28 | +0.5pp $-73 | +1.0pp $-117 |
UW: 25.0% down · 7.5% · 30yr · 1.5% tax · 5.0% vac · 8.0% maint · 8.0% mgmt
Financing live
Cash to close
- Down payment
- $42,500
- Closing costs
- $5,100
- Reserves months
- —
- Total cash needed
- —
Loan-product check · same deal, 3 products live
Conventional
25% down · 7.5% · 30yr
- Down + closing
- —
- Monthly P&I
- —
- Monthly cashflow
- —
- DSCR
- —
- Eligible?
- —
Personal DTI + credit; lowest rate.
DSCR
20% down · 8.5% · 30yr
- Down + closing
- —
- Monthly P&I
- —
- Monthly cashflow
- —
- DSCR
- —
- Eligible?
- —
No personal income docs; deal must DSCR.
Hard money
10% down · 12.0% · 12mo
- Down + closing
- —
- Monthly P&I
- —
- Monthly cashflow
- —
- DSCR
- —
- Eligible?
- —
Short-term bridge; refi at stabilization.
Listing history 2 events
-
2026-05-05$170,000 Active 512-char remark
-
2025-06-10soldstatus $144,000
ⓘ Source: listings_history table (triggers on properties + properties_extension) + one-shot
backfill from property_details.listing_events for pre-trigger history.
Tax reassessment forecast MN · Partial reset (capped growth)
- Current annual tax
- $1,580 · $132/mo
- Projected year-2 tax
- $1,742 · $145/mo
- Expected delta
- +$162/yr (+$14/mo · 10.3%)
ⓘ Screening estimate from a state-policy table — verify with the county assessor before closing.
Climate risk First Street
- Flood 1/10 Low FEMA zone X · 0% chance over 30 yrs
- Wildfire 3/10 Moderate
- Heat 1/10 Low 7 d/yr ≥90°F today · 13 d/yr by 30 yrs out
- Wind 1/10 Low
- Air quality 1/10 Low 0 unhealthy d/yr today · 0 by 30 yrs out
Nearby sold comps map
Loading sold comps map…
Walkable amenities ~0.75 mi
Loading nearby amenities…
Taxation est. · year 1
- Rental income
- $16,185
- − Mortgage interest
- −$9,523
- − Property taxes
- −$1,580
- − Insurance
- −$850
- − Repairs & maintenance
- −$1,295
- − Management
- −$1,295
- − Depreciation
- −$4,945
- Taxable loss
- −$3,302
- Est. tax savings @ 24.0%
- +$793
- After-tax cash flow
- $451/yr
For passive investors: Depreciation is non-cash, so a rental often shows a tax loss while cash-flowing — sheltering income. Rental losses are passive: they offset passive income freely, and up to $25,000/yr can offset ordinary (W-2) income if you actively participate and your MAGI is under $100k (phasing out to $0 by $150k); unused losses carry forward. On sale, claimed depreciation is recaptured at up to 25%, and gains may owe capital-gains tax (a 1031 exchange can defer both). Figures are a year-1 estimate at your 24.0% rate — not tax advice; consult a CPA.
Schools (NCES district)
- District
- Proctor Public School District
- NCES district ID
- 2730090
- Math proficiency
- 39% ▼ -20.00%
- Reading proficiency
- 49% ▼ -11.00%
- Median HH income
- $61,151
- Composite
- 38.84/100
- National rank
- #4106
- State rank
- #177 of 301 in MN
Livability — Proctor
- Score
- 75/100
- State rank
- #184
- US rank
- #3966
Category grades
Schools grade is shown separately in the Schools card above.
Census & demographics
- Population (ZIP)
- 8,305
Population outlook (St. Louis County) Hauer SSP2
- Today (2025)
- 202,411 people
- By 2030
- 203,234 · +0.4%
- By 2040
- 202,520 · +0.1%
- By 2050
- 200,853 · -0.8%
- By 2075
- 200,943 · -0.7%
- By 2100
- 192,058 · -5.1%
Race, ethnicity, and origin ACS 2023
- Neighborhood character
- Predominantly White (90%)
- Race & ethnicity
- White 90% Two or more races 4% Native American 2% Asian 1% Black 1%
- Common ancestry
- Portuguese 13% Romanian 5% Lithuanian 3%
- Foreign-born
- 1% · China, Vietnam
- Languages at home
- 98% English-only · Other Indo-European 1%
Political lean MEDSL · St. Louis
- 2024 margin
- D (+13.7) · D 55.9% · R 42.2% · Other 1.8%
- 2008→2024 swing
- -18.8pp toward R · 2008: 32.5pp · 2024: 13.7pp
- All cycles
- 2024: D+13.7 2020: D+15.6 2016: D+11.8 2012: D+29.6 2008: D+32.5
Not yet ingested
- Civics
- —
Market trends
- HPI YoY
- ▲ 53.59%
- Current HPI
- 515.02
- Rent YoY
- —
- Metro
- —
- State GDP YoY
- ▲ 2.41%
- F500 in state
- 34
Industry mix (Fortune 500 HQ in MN)
| Industry | F500 HQs | Revenue |
|---|---|---|
| Healthcare | 2 | $407B |
|
||
| Retail | 2 | $150B |
|
||
| Consumer Goods | 2 | $32B |
|
||
| Industrial Machinery | 2 | $6B |
|
||
| Agriculture | 1 | $40B |
|
||
| Healthcare / Medical Devices | 1 | $32B |
|
||
Price history
+18.1% since first listed4 events — show timeline
- 2026-06-17 Sold (MLS) $170,000 LSAR
- 2026-05-19 Pending — LSAR
- 2026-05-05 Listed $170,000 LSAR
- 2025-06-10 Sold (Public Records) $144,000 Public Records
Property tax history
+2.6%/yrLatest (2026): $1,580 · +49.6% YoY. Source: county tax records.
Cash-flow waterfall
monthlySold comps — $/sqft
last 12 mo · ≤1 miLoading sold comps…