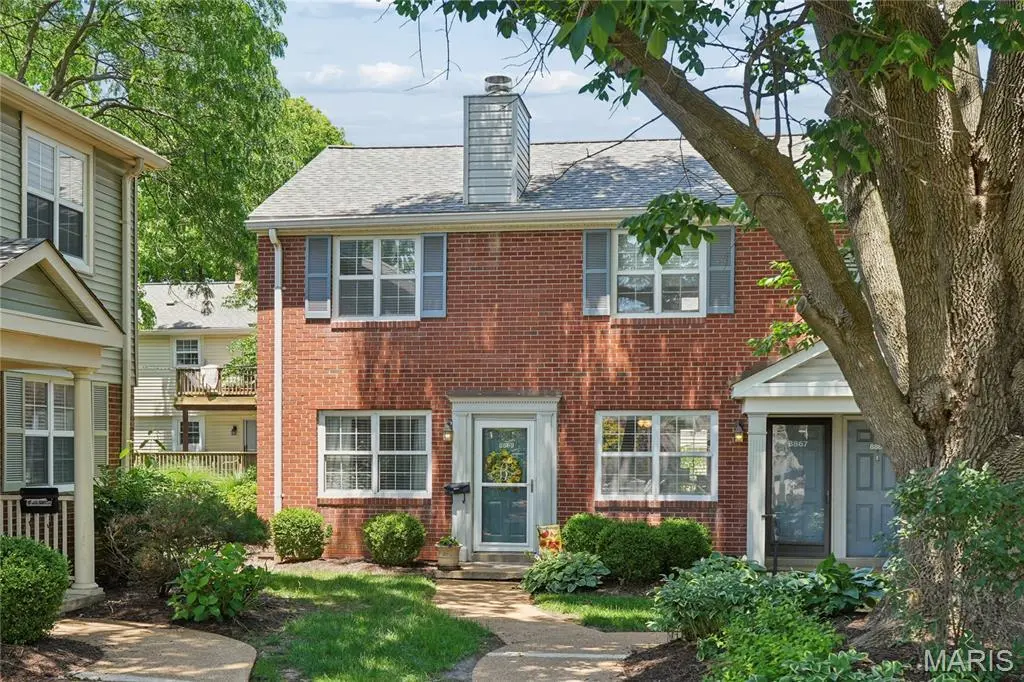
8869 Flamingo Ct · Brentwood, MO
Flood risk 1/10 · Minimal
- FEMA flood zone
- X (unshaded)
- Chance of flooding over 30 yrs
- 0.0%
- Est. flood insurance / yr
- $507 – $1,088
Fire risk 1/10 · Minimal
- Est. fire insurance / yr
- $1,054 – $1,958
Heat risk 5/10 · Moderate
- Hot days now (above 107°F)
- 7 days/yr
- Hot days in 30 yrs
- 21 days/yr
Wind risk 2/10 · Minimal
- Chance of severe wind over 30 yrs
- 1.0%
Air-quality risk 3/10 · Minor
- Unhealthy air days now
- 3 days/yr
- Unhealthy air days in 30 yrs
- 4 days/yr
Risk factors via First Street. Map © Google.
Why this score? — see what drove the D grade
The composite is a weighted blend of 9 inputs, each scored 0–100. Each bar is that input's sub-score; the figure is the points it added to the 100-point composite (weight × sub-score).
- Cash flow +10.1/30.0
- ARV discount +7.5/15.0
- Schools +5.8/10.0
- 1% rule +5.6/10.0
- Livability +4.2/5.0
- DSCR +2.9/10.0
- Rent growth +2.9/5.0
- Condition / age +2.5/5.0
- Appreciation +0.0/10.0
$162,500
🖨 Deal sheet (PDF) 📄 Offer letter ✓ Due diligence
Listing remarks MLS
Amazing first floor end unit condo updated throughout in Beautiful Brentwood Forest!! Walk-in to your large open living area with todays paint colors, updated lighting and plush carpet. Darling dining room with updated lighting and walk-out to private deck. Updated kitchen with stainless appliances, granite countertops and walk-in pantry. Large Master Suite with your own private walk-out to deck perfect for your morning cup of java or relaxing after a long day at the office. Full updated bath with linen closet and a large 2nd bedroom currently used as a home office. Refrigerator included. Just some of the amenities are pool, clubhouse, walking trails etc. Wonderful home!! Wonderful Central Location in the AAA rated Brentwood school district. Location: End Unit, Ground Level
Key facts
- $363 HOA
- Parking
- Community pool
Property features AI
Finance
- Other: Home warranty included; Seller may consider concessions; Approximately 1,500 units in the community
- HOA & community: Part of Brentwood Forest community; Monthly association fee of $363; Community amenities: clubhouse, common ground, lake, parking, party room, pool, recreation facilities, tennis courts; HOA fee covers clubhouse, insurance, grounds maintenance, parking/roads maintenance, common area maintenance, exterior maintenance, pool maintenance, management, roof, sewer, snow removal, trash, and water
Exterior
- Parking: Assigned parking; Guest parking (1 total parking space listed)
- Utilities: Public water; Public sewer; Electric service by Ameren; Cable available; Electricity connected; Sewer connected; Water connected
- Home design: Condominium (residential); One level
- Construction: Brick construction
- Exterior features: Deck; Adjoins common ground; Private ownership; Outdoor in-ground pool
Interior
- Kitchen: Dishwasher; Electric range; Microwave; Refrigerator; Disposal
- Bedrooms: 2 bedrooms (both on the main level)
- Bathrooms: 1 full bathroom (on the main level)
- Heating & cooling: Forced air heating; Central air conditioning
- Interior features: Dishwasher; Disposal; Microwave; Electric range; Refrigerator; Water heater; Central air; Forced air heating
- Laundry & utility: In-unit laundry on the main level (washer and dryer included)
Neighborhood map
What this means for you Summary
Snapshot
- This is a 2-bed/1.0-bath condo listed at $162k.
Deal economics
- At list price, monthly cash flow is $-96 ($-1k/yr) — negative.
- To cash-flow at today's rent, offer at most $146k (10.4% below list).
- Meets the 1% rule at list price ($2k rent vs $162k).
- Recommended offer: $146k (10.4% below list) — sets the bar for cash-flow.
Location & tenants
- Location reads 84/100 on livability (#6 in MO, #689 nationally) — a professional / high-income tenant draw. Strengths: employment A+, housing A+, cost of living B; Watch: crime C-.
- Brentwood (suburban): math 65% / reading 66% proficiency, ranked #4 of 324 in MO (top 1%) — acceptable for families but not a draw, mixed tenant base, ~2y average lease; only 18% free/reduced lunch — higher-income household profile.
- Zoned schools: Mcgrath Elem. (math 67% / reading 67%, grade B+, #46 of 1,115 statewide, top 5%, 195 students, 16% FRL); Brentwood Middle (math 67% / reading 62%, grade A-, #5 of 391 statewide, top 2%, 163 students, 24% FRL); Brentwood High (math 62% / reading 74%, grade B, #12 of 521 statewide, top 2%, 191 students, 30% FRL).
- Market conditions: Rents rising (+1.5%/yr); 130 active listings in the ZIP; 27 comparable units currently listed for rent nearby; rentals at typical pace (median 25d on market — plan ~3-4 weeks tenant-placement turnaround); 44% of comp listings sitting > 30 days — soft ceiling on asking rent; solid renter incomes; 920 units permitted in St. Louis County in 2024 (250 in 5+ unit buildings).
Forward outlook
- Local home prices are declining (-3.0%/yr); year-one equity from $1k of loan paydown is wiped out by about $5k of value loss. Plan a longer hold.
Negotiation context
- It's been on market 17 days — a 2% lower offer ($160k) is reasonable based on typical stale-listing flexibility.
- 6 sale attempts since 12y ago with the ask held roughly flat each time — persistent listings suggest the price (not the market) is what's stuck; bring a comps-based counter.
- Current owner paid $132k; 23% above their basis — modest negotiation headroom, anchor on the comps not their cost.
Risks & watch-outs
- Watch-outs: HOA is 21% of rent; built in 1950 — expect roof / HVAC / electrical / plumbing capex.
- Climate carrying-cost: extreme-heat days projected 7→21/yr by 2055 (HVAC capex compounding) — expect insurance premiums to compound above CPI over the hold.
Questions for the listing agent
- What do current leases actually rent for vs. the listed asking? Can we see a recent rent roll and the last 12 months of T-12 income?
- Built in 1950 — when were the roof, HVAC, electrical panel, plumbing, and water heater last replaced?
- What does the HOA fee cover, when was the last increase, and are there any pending special assessments or reserve-fund shortfalls?
- Any open or pending special assessments — roof, HVAC, plumbing, elevator, façade? What's the per-unit balance and payoff schedule, and is the seller paying it off at close or rolling it to the buyer?
- Is there a deadline driving the sale (1031 exchange, divorce, estate, relocation)? That informs how much negotiation room exists.
- Schools are A-rated — typically a magnet for longer-tenancy family renters. What's the average tenant stay here, and is there a school-zone premium baked into asking?
- The area grade is low — what's the realistic commute time and amenity access for the typical tenant pool here? Any planned neighborhood developments (good or bad) we should know about?
- What's the average days-on-market for RENTAL listings here right now (not sales)? A rising rental-DOM trend means longer vacancies and softer asking-rent achievability than the comps imply.
- What's the recent tenant-quality profile in this submarket — average credit score on applications, eviction rate, late-payment / NSF rate, and stable-employment percentage? A property-management company in the area should have these aggregated.
- How much new apartment / multifamily construction is in the pipeline within 1–3 miles? Heavy new supply (>2% of stock underway) typically softens rents 12–24 months out; light construction supports rent growth.
Investment metrics
- 1% rule
- 1.06% ✓
- Cap rate
- 5.58%
- Cash-on-cash
- -2.53%
- DSCR
- 0.89
- GRM
- 7.8
CMA / ARV
No comps found within radius.
Projected returns pro-forma
-3.0% appreciation · 1.49% rent growth · sell at horizon
- IRR
- -22.6%
- Equity multiple
- 0.24×
- Total profit
- $-34,795
- Equity at exit
- $24,229
- IRR
- -22.3%
- Equity multiple
- -0.04×
- Total profit
- $-47,513
- Equity at exit
- $14,050
Cash invested: $45,500 (down + closing). Projections, not guarantees.
Landlord ↔ Tenant lean methodology
- Overall (STATE)
- 81 Strongly Landlord-Friendly
- State Missouri
- 81 Strongly Landlord-Friendly · R+10
- County
- — inherits STATE
- City
- — inherits STATE
ZIP-level market 63144
- Rents YoY
- 1.5%
- Active inventory
- 130
- Price-to-rent
- 7.8×
Monthly cashflow live
- Estimated rent
- $1,728 high interval (Pro) →
- Mortgage (P&I)
- −$852
- Tax from tax record
- −$178 /mo · $2,140/yr
- Insurance
- −$68
- HOA
- −$363
- Vacancy / Maint / Mgmt
- −$363
- Net cashflow
- $-96
Break-even live
Sensitivity live
| Price | -10% $-4 | -5% $-50 | +0% $-96 | +5% $-142 | +10% $-188 |
|---|---|---|---|---|---|
| Rent | -10% $-232 | -5% $-164 | +0% $-96 | +5% $-28 | +10% $41 |
| Rate | -1.0pp $-14 | -0.5pp $-55 | base $-96 | +0.5pp $-138 | +1.0pp $-181 |
UW: 25.0% down · 7.5% · 30yr · 1.5% tax · 5.0% vac · 8.0% maint · 8.0% mgmt
Financing live
Cash to close
- Down payment
- $40,625
- Closing costs
- $4,875
- Reserves months
- —
- Total cash needed
- —
Loan-product check · same deal, 3 products live
Conventional
25% down · 7.5% · 30yr
- Down + closing
- —
- Monthly P&I
- —
- Monthly cashflow
- —
- DSCR
- —
- Eligible?
- —
Personal DTI + credit; lowest rate.
DSCR
20% down · 8.5% · 30yr
- Down + closing
- —
- Monthly P&I
- —
- Monthly cashflow
- —
- DSCR
- —
- Eligible?
- —
No personal income docs; deal must DSCR.
Hard money
10% down · 12.0% · 12mo
- Down + closing
- —
- Monthly P&I
- —
- Monthly cashflow
- —
- DSCR
- —
- Eligible?
- —
Short-term bridge; refi at stabilization.
Rent comps 27 comps
| Address | Beds | Baths | Sqft | Rent | $/sqft | DOM | Units | Dist |
|---|---|---|---|---|---|---|---|---|
| 1469 Bobolink Pl Saint Louis, MO | 2.0 | 1.0 | 981 | $1,700 | $1.73 | 45d | 1 | 0.09mi |
| 8901 Cardinal Ter Saint Louis, MO | 2.0 | 1.0 | 1004 | $1,600 | $1.59 | 12d | 1 | 0.14mi |
| 1607 Redbird Cv Saint Louis, MO | 2.0 | 1.0 | 946 | $2,038 | $2.15 | 0d | 1 | 0.23mi |
| 9071 Wrenwood Ln Saint Louis, MO | 2.0 | 1.0 | 1060 | $1,650 | $1.56 | 45d | 1 | 0.24mi |
| 1696 E Swan Cir Saint Louis, MO | 2.0 | 1.0 | 967 | $1,600 | $1.65 | 45d | 1 | 0.25mi |
| 1800 S Brentwood Blvd Saint Louis, MO | 1.0–3.0 | 1.0–2.0 | 1164 | $2,120 | $1.82 | 0d | 18 | 0.35mi |
| 1736 Redbird Cv Saint Louis, MO | 2.0 | 1.0 | 900 | $1,800 | $2.00 | 45d | 1 | 0.35mi |
| 8661 Litzsinger Rd Saint Louis, MO | 2.0 | 1.0 | 910 | $1,765 | $1.94 | 45d | 1 | 0.87mi |
| 2501 Mary Ave Brentwood, MO | 1.0 | 1.5 | 1100 | $1,725 | $1.57 | 9d | 1 | 0.94mi |
| 8056 Davis Dr Unit 80562N Saint Louis, MO | 1.0 | 1.0 | 840 | $1,700 | $2.02 | 45d | 1 | 0.96mi |
| 9386 Golden Gate Rd Saint Louis, MO | 2.0 | 1.0 | 840 | $2,283 | $2.72 | 0d | 1 | 1.03mi |
| 9006 Madge Ave Saint Louis, MO | 2.0 | 2.0 | 1000 | $2,100 | $2.10 | 9d | 1 | 1.03mi |
| 72 Van Mark Way Brentwood, MO | 1.0–2.0 | 1.0 | 780 | $1,236 | $1.58 | 0d | 4 | 1.13mi |
| 7570 Oxford Dr Apt 2S Clayton, MO | 2.0 | 1.0 | 1100 | $2,600 | $2.36 | 0d | 1 | 1.18mi |
| 2806 Hilldale Ave Saint Louis, MO | 2.0 | 2.0 | 1104 | $2,550 | $2.31 | 0d | 1 | 1.23mi |
| 7553 Buckingham Dr Clayton, MO | 2.0 | 1.0 | 900 | $1,695 | $1.88 | 45d | 1 | 1.27mi |
| 7530 Buckingham Dr Saint Louis, MO | 1.0 | 1.0 | 800 | $900 | $1.12 | 45d | 1 | 1.28mi |
| 7537 Buckingham Dr Saint Louis, MO | 2.0 | 1.0 | 1000 | $1,850 | $1.85 | 9d | 1 | 1.29mi |
| 7720 Gissler Ave Unit 1E Richmond Heights, MO | 1.0 | 1.0 | 900 | $925 | $1.03 | 45d | 1 | 1.30mi |
| 7784 W Bruno Ave Saint Louis, MO | 2.0 | 1.0 | 900 | $950 | $1.06 | 45d | 1 | 1.32mi |
| 7555 Byron Pl Unit 55-1N Clayton, MO | 3.0 | 1.0 | 1100 | $1,900 | $1.73 | 25d | 1 | 1.33mi |
| 7828 Laclede Forest Dr Maplewood, MO | 1.0–2.0 | 1.0 | 725 | $1,345 | $1.86 | 5d | 2 | 1.34mi |
| 7551 Byron Pl Unit 51-2S Clayton, MO | 2.0 | 1.0 | 900 | $1,500 | $1.67 | 45d | 1 | 1.34mi |
| 7551 Byron Pl Unit 51-1S Clayton, MO | 2.0 | 1.0 | 900 | $1,400 | $1.56 | 25d | 1 | 1.34mi |
| 9305 Manchester Rd St. Louis, MO | 1.0–2.0 | 1.0 | 776 | $1,445 | $1.86 | 4d | 12 | 1.37mi |
| 1421 Claytonia Ter Unit 1F Richmond Heights, MO | 2.0 | 1.0 | 855 | $1,125 | $1.32 | 12d | 1 | 1.43mi |
| 1034 N Rock Hill Rd Saint Louis, MO | 2.0 | 1.0 | 696 | $1,650 | $2.37 | 45d | 1 | 1.48mi |
HOA detail condo
- Monthly dues
- $363 · $4,356/yr
- Likely covers
- pool
- Assessments
- None detected in remarks — confirm with the listing agent.
Listing history 11 events
-
2026-06-21days on market $162,500 Active 17 DOM
-
2026-06-18days on market $162,500 Active 14 DOM
-
2026-06-17days on market $162,500 Active 13 DOM
-
2026-06-16days on market $162,500 Active 12 DOM
-
2026-06-15days on market $162,500 Active 11 DOM
-
2026-06-13days on market $162,500 Active 9 DOM
-
2026-06-13days on market $162,500 Active 8 DOM
-
2026-06-09days on market $162,500 Active 5 DOM
-
2026-06-08days on market $162,500 Active 4 DOM
-
2026-06-07remarks 693-char remark
-
2026-06-07$162,500 Active 3 DOM
ⓘ Source: listings_history table (triggers on properties + properties_extension) + one-shot
backfill from property_details.listing_events for pre-trigger history.
Tax reassessment forecast MO · Resets to sale price
- Current annual tax
- $2,140 · $178/mo
- Projected year-2 tax
- $2,140 · $178/mo
- Expected delta
- $0/yr ($0/mo · 0.0%)
ⓘ Screening estimate from a state-policy table — verify with the county assessor before closing.
Climate risk First Street
- Flood 1/10 Low FEMA zone X (unshaded) · 0% chance over 30 yrs
- Wildfire 1/10 Low
- Heat 5/10 Major 7 d/yr ≥107°F today · 21 d/yr by 30 yrs out
- Wind 2/10 Low 100% chance of damaging wind over 30 yrs
- Air quality 3/10 Moderate 3 unhealthy d/yr today · 4 by 30 yrs out
Nearby sold comps map
Loading sold comps map…
Walkable amenities ~0.75 mi
Loading nearby amenities…
Taxation est. · year 1
- Rental income
- $20,738
- − Mortgage interest
- −$9,103
- − Property taxes
- −$2,140
- − Insurance
- −$812
- − Repairs & maintenance
- −$1,659
- − Management
- −$1,659
- − HOA
- −$4,356
- − Depreciation
- −$4,727
- Taxable loss
- −$3,718
- Est. tax savings @ 24.0%
- +$892
- After-tax cash flow
- $-259/yr
For passive investors: Depreciation is non-cash, so a rental often shows a tax loss while cash-flowing — sheltering income. Rental losses are passive: they offset passive income freely, and up to $25,000/yr can offset ordinary (W-2) income if you actively participate and your MAGI is under $100k (phasing out to $0 by $150k); unused losses carry forward. On sale, claimed depreciation is recaptured at up to 25%, and gains may owe capital-gains tax (a 1031 exchange can defer both). Figures are a year-1 estimate at your 24.0% rate — not tax advice; consult a CPA.
Schools (NCES district)
- District
- Brentwood
- NCES district ID
- 2905880
- Math proficiency
- 65% ▼ -3.00%
- Reading proficiency
- 66% ▼ -1.00%
- Median HH income
- $69,522
- Composite
- 57.51/100
- National rank
- #1069
- State rank
- #4 of 324 in MO
Livability — Brentwood
- Score
- 84/100
- State rank
- #6
- US rank
- #689
Category grades
Schools grade is shown separately in the Schools card above.
Census & demographics
- Census place
- Brentwood, MO
- County
- Saint Louis County · 888,823 people
- City population
- 9,505
- Metro
- St. Louis, MO-IL
- Population (ZIP)
- 9,505
- Household income
- $104,438
- Rent vs Own
- Severe rent burden
- 310.0
Population outlook (St. Louis County) Hauer SSP2
- Today (2025)
- 1,025,227 people
- By 2030
- 1,028,023 · +0.3%
- By 2040
- 1,020,940 · -0.4%
- By 2050
- 1,007,280 · -1.8%
- By 2075
- 987,277 · -3.7%
- By 2100
- 921,984 · -10.1%
Race, ethnicity, and origin ACS 2023
- Neighborhood character
- Predominantly White (78%)
- Race & ethnicity
- White 78% Two or more races 10% Asian 7% Black 5% Hispanic / Latino 2%
- Common ancestry
- Romanian 4% Italian 3% Slovak 2%
- Foreign-born
- 11% · China, Canada, South Korea
- Languages at home
- 91% English-only · Other Asian/Pacific 2% Spanish 2% Russian/Polish/Slavic 1%
Political lean MEDSL · St. Louis
- 2024 margin
- Strong D (+23.4) · D 60.8% · R 37.4% · Other 1.7%
- 2008→2024 swing
- +3.5pp toward D · 2008: 19.9pp · 2024: 23.4pp
- All cycles
- 2024: D+23.4 2020: D+24.0 2016: D+16.2 2012: D+13.7 2008: D+19.9
Not yet ingested
- Civics
- —
Market trends
- HPI YoY
- ▼ -411.33%
- Current HPI
- 207.0145
- Rent YoY
- ▲ 1.49%
- Metro
- St. Louis, MO-IL
- State GDP YoY
- ▲ 1.84%
- F500 in state
- 20
Industry mix (Fortune 500 HQ in MO)
| Industry | F500 HQs | Revenue |
|---|---|---|
| Healthcare | 1 | $163B |
|
||
| Insurance | 1 | $21B |
|
||
| Industrial Technology | 1 | $17B |
|
||
| Retail | 1 | $16B |
|
||
| Industrial Distribution | 1 | $10B |
|
||
| Utilities | 1 | $9B |
|
||
Price history
+91.2% since first listed22 events — show timeline
- 2026-06-05 Listed $162,500 MARIS as Distributed by MLS Grid
- 2026-06-04 Coming Soon $162,500 MARIS as Distributed by MLS Grid
- 2016-11-14 Sold (Public Records) $132,000 Public Records
- 2016-11-04 Sold (MLS) — MARIS as Distributed by MLS Grid
- 2016-11-01 Pending — MARIS as Distributed by MLS Grid
- 2016-11-01 Relisted — MARIS as Distributed by MLS Grid
- 2016-10-30 Delisted — MARIS as Distributed by MLS Grid
- 2016-07-30 Contingent — MARIS as Distributed by MLS Grid
- 2016-07-30 Relisted — MARIS as Distributed by MLS Grid
- 2016-07-30 Delisted — MARIS as Distributed by MLS Grid
- 2016-07-17 Contingent — MARIS as Distributed by MLS Grid
- 2016-05-31 Relisted — MARIS as Distributed by MLS Grid
- 2016-05-30 Delisted — MARIS as Distributed by MLS Grid
- 2016-04-23 Price Changed $134,000 MARIS as Distributed by MLS Grid
- 2016-03-21 Listed $139,000 MARIS as Distributed by MLS Grid
- 2014-05-13 Sold (Public Records) $123,500 Public Records
- 2014-05-09 Sold (MLS) — MARIS as Distributed by MLS Grid
- 2014-03-03 Listed $129,000 MARIS as Distributed by MLS Grid
- 2009-10-29 Sold (Public Records) $128,500 Public Records
- 1999-03-08 Sold (Public Records) $78,326 Public Records
- 1998-06-24 Sold (Public Records) $85,000 Public Records
- 1997-03-24 Sold (Public Records) — Public Records
Property tax history
+3.0%/yrLatest (2022): $2,140 · +0.8% YoY. Source: county tax records.
Cash-flow waterfall
monthlySold comps — $/sqft
last 12 mo · ≤1 miLoading sold comps…