 Multi-family
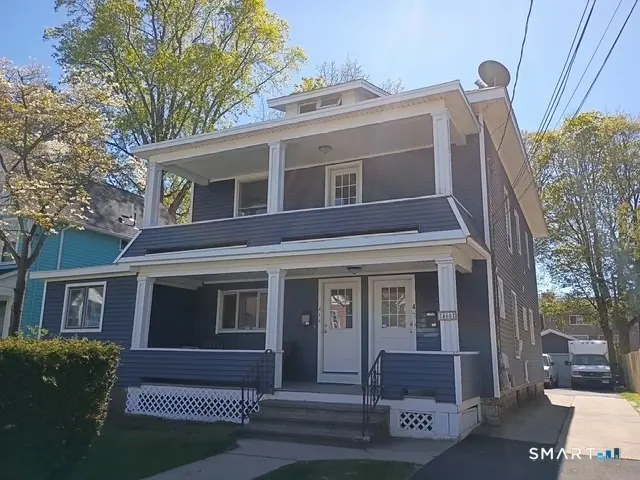
464 Third Ave · West Haven, CT
Flood risk 1/10 · Minimal
- FEMA flood zone
- X (unshaded)
- Chance of flooding over 30 yrs
- 0.0%
- Est. flood insurance / yr
- $473 – $860
Fire risk 1/10 · Minimal
- Est. fire insurance / yr
- $829 – $1,539
Heat risk 7/10 · Major
- Hot days now (above 97°F)
- 7 days/yr
- Hot days in 30 yrs
- 16 days/yr
Wind risk 6/10 · Moderate
- Chance of severe wind over 30 yrs
- 60.0%
Air-quality risk 5/10 · Moderate
- Unhealthy air days now
- 6 days/yr
- Unhealthy air days in 30 yrs
- 8 days/yr
Risk factors via First Street. Map © Google.
Why this score? — see what drove the C grade
The composite is a weighted blend of 9 inputs, each scored 0–100. Each bar is that input's sub-score; the figure is the points it added to the 100-point composite (weight × sub-score).
- Cash flow +23.2/30.0
- DSCR +7.5/10.0
- ARV discount +6.6/15.0
- 1% rule +6.1/10.0
- Livability +4.2/5.0
- Rent growth +3.5/5.0
- Schools +2.8/10.0
- Condition / age +2.5/5.0
- Appreciation +0.0/10.0
$519,000
🖨 Deal sheet 📄 Offer letter ✓ Due diligence
Multi-family units
County records classify this as Multi-Family (2-4 Unit). Listing-text estimate: 1 unit. estimate disagrees with records
Listing remarks MLS
Opportunity knocks for this centrally located 2 family house. Each unit features 2/3 bedrooms, living room, dining room and kitchen. Extra space in partially finished walk up attic. Needs work but offers a tremendous opportunity for owner occupants or investors. 2 car detached garage rounds out the picture. Come see today!
Key facts
- I-95
- Train station
- West haven beaches
Tags
Property features AI
Exterior
- Parking: Detached garage; 4 total parking spaces; 1 garage
- Utilities: Public water connection; Public sewer connection; Natural gas and oil fuel
- Home design: Multi-family property (2-family)
- Construction: Frame construction; Brick and masonry foundation
- Exterior features: Level lot; Vinyl siding; Asphalt shingle roof
Interior
- Bedrooms: 6 bedrooms
- Bathrooms: 2 full bathrooms
- Heating & cooling: Hot air heating; Window unit cooling
- Interior features: 12 total rooms; Full basement; Walk-up attic
- Laundry & utility: 40-gallon electric hot water tank
Neighborhood map
What this means for you Summary
Snapshot
- This is a 5-bed/2.0-bath multifamily listed at $519k.
Deal economics
- At list price, monthly cash flow is $943 ($11k/yr) — positive.
- The deal already cash-flows at list — no discount required.
- Meets the 1% rule at list price ($6k rent vs $519k).
- Recommended offer: $511k (1.5% below list) — sets the bar for market timing.
- Cap rate 8.5% vs local median 4.3% in West Haven — top-decile yield for the area; either an underpriced asset or a hidden risk that comps aren't pricing in. Stress-test before assuming the spread holds.
Location & tenants
- Location reads 83/100 on livability (#6 in CT, #915 nationally) — a professional / high-income tenant draw. Strengths: commute A+, housing A+, health & safety A+; Watch: amenities D.
- West Haven School District (suburban): math 26% / reading 38% proficiency, ranked #121 of 153 in CT (top 79%) — families likely to look elsewhere, expect single-tenant / working-renter base with shorter leases.
- Zoned schools: West Haven High School (math 23% / reading 39%, grade F, #135 of 194 statewide, top 70%, 1,780 students, 53% FRL) — zoned schools at 53% FRL track the district average.
- Market conditions: Rents rising (+3.9%/yr); 146 active listings in the ZIP; 6 comparable units currently listed for rent nearby; rentals at typical pace (median 24d on market — plan ~3-4 weeks tenant-placement turnaround); 1,059 units permitted in South Central Connecticut Planning Region in 2024 (779 in 5+ unit buildings).
- At $5,747/mo this rent would consume 93% of the median local household income ($74k/yr) (locally 2671% of renters already pay >50% of income on rent) — very limited rent-growth headroom before tenants either downsize or default.
Forward outlook
- Local home prices are declining (-3.0%/yr); year-one equity from $4k of loan paydown is wiped out by about $16k of value loss. Plan a longer hold.
Negotiation context
- It's been on market 25 days — a 2% lower offer ($511k) is reasonable based on typical stale-listing flexibility.
- 2 sale attempts since 10y ago with the ask held roughly flat each time — persistent listings suggest the price (not the market) is what's stuck; bring a comps-based counter.
- Current owner paid $131k; list at $519k implies a 296% gain — meaningful room to come down on a strong offer.
Risks & watch-outs
- Watch-outs: built in 1908 — expect roof / HVAC / electrical / plumbing capex.
- Climate carrying-cost: major wind risk, 60% chance of damaging wind over 30y; extreme-heat days projected 7→16/yr by 2055 (HVAC capex compounding) — expect insurance premiums to compound above CPI over the hold.
Questions for the listing agent
- Built in 1908 — when were the roof, HVAC, electrical panel, plumbing, and water heater last replaced?
- Is there a deadline driving the sale (1031 exchange, divorce, estate, relocation)? That informs how much negotiation room exists.
- Schools are D-rated, which usually means shorter tenancies and higher turnover. Who's the typical renter profile here, and what's been the actual vacancy rate?
- What's the average days-on-market for RENTAL listings here right now (not sales)? A rising rental-DOM trend means longer vacancies and softer asking-rent achievability than the comps imply.
- What's the recent tenant-quality profile in this submarket — average credit score on applications, eviction rate, late-payment / NSF rate, and stable-employment percentage? A property-management company in the area should have these aggregated.
- How much new apartment / multifamily construction is in the pipeline within 1–3 miles? Heavy new supply (>2% of stock underway) typically softens rents 12–24 months out; light construction supports rent growth.
Investment metrics
- 1% rule
- 1.11% ✓
- Cap rate
- 8.47%
- Cash-on-cash
- 7.78%
- DSCR
- 1.35
- GRM
- 7.5
CMA / ARV
- ARV (median comp)
- $509,220
- List price
- $519,000
- Delta
- 1.92%
- Verdict
- FAIR
- Comps
- 20 within 1.0 mi
Show comp detail 12 sales within ~0.75 mi
| Address | Dist | Beds/Ba | Sqft | Sold | Price | $/sf | Match |
|---|---|---|---|---|---|---|---|
| 440 Third Ave | 0.05mi | 6/3.0 (+1) | 2,482 (-3%) | 9mo | $500,000 | $201 | 77 |
| 8 Prospect Pl | 0.33mi | 5/3.0 | 2,729 (+7%) | 2mo | $629,900 | $231 | 68 |
| 24 George St | 0.48mi | 4/2.0 (-1) | 2,548 (-0%) | 6mo | $550,000 | $216 | 67 |
| 76 Center St | 0.18mi | 4/2.0 (-1) | 2,201 (-14%) | 2mo | $500,000 | $227 | 62 |
| 327 Center St | 0.48mi | 6/4.0 (+1) | 2,683 (+5%) | 2mo | $450,000 | $168 | 55 |
| 248 Elm St | 0.39mi | 5/3.0 | 2,851 (+12%) | 9mo | $460,000 | $161 | 51 |
| 33 Jones St | 0.40mi | 4/2.0 (-1) | 2,288 (-10%) | 9mo | $470,000 | $205 | 51 |
| 105 Church St | 0.60mi | 5/2.5 | 2,291 (-10%) | 5mo | $428,000 | $187 | 48 |
| 626 Savin Ave | 0.52mi | 5/3.0 | 2,840 (+11%) | 7mo | $560,000 | $197 | 48 |
| 9 Bayview Pl | 0.35mi | 6/4.0 (+1) | 2,796 (+9%) | 9mo | $875,000 | $313 | 48 |
| 72 Atwater St | 0.59mi | 5/3.5 | 2,215 (-13%) | 5mo | $565,000 | $255 | 40 |
| 90 Blohm St | 0.67mi | 6/2.0 (+1) | 2,226 (-13%) | 4mo | $550,000 | $247 | 39 |
Match score weights: distance 35% · size 25% · config 20% · recency 20%. Top-matched comps best support the ARV.
Projected returns pro-forma
-3.0% appreciation · 3.9% rent growth · sell at horizon
- IRR
- -3.4%
- Equity multiple
- 0.87×
- Total profit
- $-18,721
- Equity at exit
- $77,385
- IRR
- 7.3%
- Equity multiple
- 1.57×
- Total profit
- $83,326
- Equity at exit
- $44,874
Cash invested: $145,320 (down + closing). Projections, not guarantees.
Landlord ↔ Tenant lean methodology
- Overall (STATE)
- 27 Tenant-Leaning
- State Connecticut
- 27 Tenant-Leaning · D+7
- County
- — inherits STATE
- City
- — inherits STATE
ZIP-level market 06516
- Rents YoY
- 3.9%
- Active inventory
- 146
- Price-to-rent
- 22.6×
Monthly cashflow live
- Estimated rent
- $5,747 high interval (Pro) →
- Mortgage (P&I)
- −$2,722
- Tax from tax record
- −$660 /mo · $7,915/yr
- Insurance
- −$216
- HOA
- −$0
- Vacancy / Maint / Mgmt
- −$1,207
- Net cashflow
- $943
Break-even live
3-unit breakdown (identical units grouped — click to expand)
| Units | Beds | Baths | Est. rent |
|---|---|---|---|
| 3× units | 2 | 1 | $5,748 |
| #1 | 2 | 1 | $1,916 |
| #2 | 2 | 1 | $1,916 |
| #3 | 2 | 1 | $1,916 |
| Total (3 units) | $5,747 | ||
UW: 25.0% down · 7.5% · 30yr · 1.5% tax · 5.0% vac · 8.0% maint · 8.0% mgmt
Financing live
Cash to close
- Down payment
- $129,750
- Closing costs
- $15,570
- Reserves months
- —
- Total cash needed
- —
Loan-product check · same deal, 3 products live
Conventional
25% down · 7.5% · 30yr
- Down + closing
- —
- Monthly P&I
- —
- Monthly cashflow
- —
- DSCR
- —
- Eligible?
- —
Personal DTI + credit; lowest rate.
DSCR
20% down · 8.5% · 30yr
- Down + closing
- —
- Monthly P&I
- —
- Monthly cashflow
- —
- DSCR
- —
- Eligible?
- —
No personal income docs; deal must DSCR.
Hard money
10% down · 12.0% · 12mo
- Down + closing
- —
- Monthly P&I
- —
- Monthly cashflow
- —
- DSCR
- —
- Eligible?
- —
Short-term bridge; refi at stabilization.
Rent comps 6 comps
| Address | Beds | Baths | Sqft | Rent | $/sqft | DOM | Units | Dist |
|---|---|---|---|---|---|---|---|---|
| 203 Main St Unit 2nd fl West Haven, CT | 4.0 | 1.0 | 1967 | $2,400 | $1.22 | 23d | 1 | 0.09mi |
| 17 Treadwell St West Haven, CT | 4.0 | 1.0 | 2814 | $2,450 | $0.87 | 23d | 1 | 0.15mi |
| 37 Center St Unit 2 West Haven, CT | 5.0 | 2.0 | 2500 | $3,300 | $1.32 | 2d | 1 | 0.27mi |
| 280 3rd Ave Unit 2nd fl West Haven, CT | 4.0 | 2.0 | 1819 | $2,500 | $1.37 | 2d | 1 | 0.37mi |
| 36 Cassius St New Haven, CT | 4.0 | 1.5 | 1872 | $2,300 | $1.23 | 43d | 1 | 1.38mi |
| 34 Cassius St Unit 36 New Haven, CT | 5.0 | 2.0 | 1872 | $2,300 | $1.23 | 43d | 1 | 1.38mi |
Listing history 6 events
-
2026-05-18price $519,000 542-char remark
-
2026-05-01$536,000 Active 542-char remark
-
2017-01-13soldstatus $131,000 324-char remark
Show marketing remark (324 chars)
Opportunity knocks for this centrally located 2 family house. Each unit features 2/3 bedrooms, living room, dining room and kitchen. Extra space in partially finished walk up attic. Needs work but offers a tremendous opportunity for owner occupants or investors. 2 car detached garage rounds out the picture. Come see today!
-
2016-12-21historical 324-char remark
Show marketing remark (324 chars)
Opportunity knocks for this centrally located 2 family house. Each unit features 2/3 bedrooms, living room, dining room and kitchen. Extra space in partially finished walk up attic. Needs work but offers a tremendous opportunity for owner occupants or investors. 2 car detached garage rounds out the picture. Come see today!
-
2016-10-12$132,900 324-char remark
Show marketing remark (324 chars)
Opportunity knocks for this centrally located 2 family house. Each unit features 2/3 bedrooms, living room, dining room and kitchen. Extra space in partially finished walk up attic. Needs work but offers a tremendous opportunity for owner occupants or investors. 2 car detached garage rounds out the picture. Come see today!
-
1997-07-18soldstatus $92,900
ⓘ Source: listings_history table (triggers on properties + properties_extension) + one-shot
backfill from property_details.listing_events for pre-trigger history.
Tax reassessment forecast CT · Partial reset (capped growth)
- Current annual tax
- $7,915 · $660/mo
- Projected year-2 tax
- $9,511 · $793/mo
- Expected delta
- +$1,596/yr (+$133/mo · 20.2%)
ⓘ Screening estimate from a state-policy table — verify with the county assessor before closing.
Climate risk First Street
- Flood 1/10 Low FEMA zone X (unshaded) · 0% chance over 30 yrs
- Wildfire 1/10 Low
- Heat 7/10 Severe 7 d/yr ≥97°F today · 16 d/yr by 30 yrs out
- Wind 6/10 Major 60% chance of damaging wind over 30 yrs
- Air quality 5/10 Major 6 unhealthy d/yr today · 8 by 30 yrs out
Nearby sold comps map
Loading sold comps map…
Walkable amenities ~0.75 mi
Loading nearby amenities…
Taxation est. · year 1
- Rental income
- $68,964
- − Mortgage interest
- −$29,072
- − Property taxes
- −$7,915
- − Insurance
- −$2,595
- − Repairs & maintenance
- −$5,517
- − Management
- −$5,517
- − Depreciation
- −$15,098
- Taxable income
- $3,250
- Est. tax owed @ 24.0%
- −$780
- After-tax cash flow
- $10,531/yr
For passive investors: Depreciation is non-cash, so a rental often shows a tax loss while cash-flowing — sheltering income. Rental losses are passive: they offset passive income freely, and up to $25,000/yr can offset ordinary (W-2) income if you actively participate and your MAGI is under $100k (phasing out to $0 by $150k); unused losses carry forward. On sale, claimed depreciation is recaptured at up to 25%, and gains may owe capital-gains tax (a 1031 exchange can defer both). Figures are a year-1 estimate at your 24.0% rate — not tax advice; consult a CPA.
Schools (NCES district)
- District
- West Haven School District
- NCES district ID
- 0904950
- Math proficiency
- 26% ▼ -13.00%
- Reading proficiency
- 38% ▼ -11.00%
- Median HH income
- $52,405
- Composite
- 28.05/100
- National rank
- #6840
- State rank
- #121 of 153 in CT
Livability — West Haven
- Score
- 83/100
- State rank
- #6
- US rank
- #915
Category grades
Schools grade is shown separately in the Schools card above.
Census & demographics
- Census place
- West Haven, CT
- County
- New Haven County · 688,236 people
- City population
- 55,351
- Metro
- New Haven-Milford, CT
- Population (ZIP)
- 55,351
- Household income
- $74,382
- Rent vs Own
- Severe rent burden
- 2671.0
Population outlook (South Central Connecticut County) Hauer SSP2
- By 2040
- 608,362
Race, ethnicity, and origin ACS 2023
- Neighborhood character
- Diverse neighborhood (Simpson 0.68)
- Race & ethnicity
- White 47% Hispanic / Latino 26% Black 18% Two or more races 10% Asian 5%
- Hispanic origin (detail)
- Mexican 3% Puerto Rican 11% Dominican 1%
- Common ancestry
- Romanian 4% Lithuanian 3% Russian 2%
- Foreign-born
- 21% · Canada, Jamaica, China
- Languages at home
- 70% English-only · Spanish 17% Other Indo-European 5% Arabic 3%
Political lean MEDSL · South Central Connecticut
- 2024 margin
- Strong D (+20.1) · D 59.0% · R 38.9% · Other 2.1%
- All cycles
- 2024: D+20.1
Not yet ingested
- Civics
- —
Market trends
- HPI YoY
- ▼ -312.86%
- Current HPI
- 307.0655
- Rent YoY
- ▲ 3.90%
- Metro
- New Haven-Milford, CT
- State GDP YoY
- ▲ 1.06%
- F500 in state
- 38
Industry mix (Fortune 500 HQ in CT)
| Industry | F500 HQs | Revenue |
|---|---|---|
| Industrial Machinery | 4 | $38B |
|
||
| Insurance | 3 | $71B |
|
||
| Financial Services | 2 | $25B |
|
||
| Transportation / Logistics | 2 | $18B |
|
||
| Healthcare | 1 | $247B |
|
||
| Telecommunications | 1 | $55B |
|
||
Price history
+458.7% since first listed7 events — show timeline
- 2026-05-26 Pending — Smart MLS
- 2026-05-18 Price Changed $519,000 Smart MLS
- 2026-05-01 Listed $536,000 Smart MLS
- 2017-01-13 Sold (MLS) $131,000 Smart MLS
- 2016-12-21 Listing Removed — Smart MLS
- 2016-10-12 Listed $132,900 Smart MLS
- 1997-07-18 Sold (Public Records) $92,900 Public Records
Property tax history
+2.5%/yrLatest (2023): $7,915 · +2.0% YoY. Source: county tax records.
Cash-flow waterfall
monthlySold comps — $/sqft
last 12 mo · ≤1 miLoading sold comps…