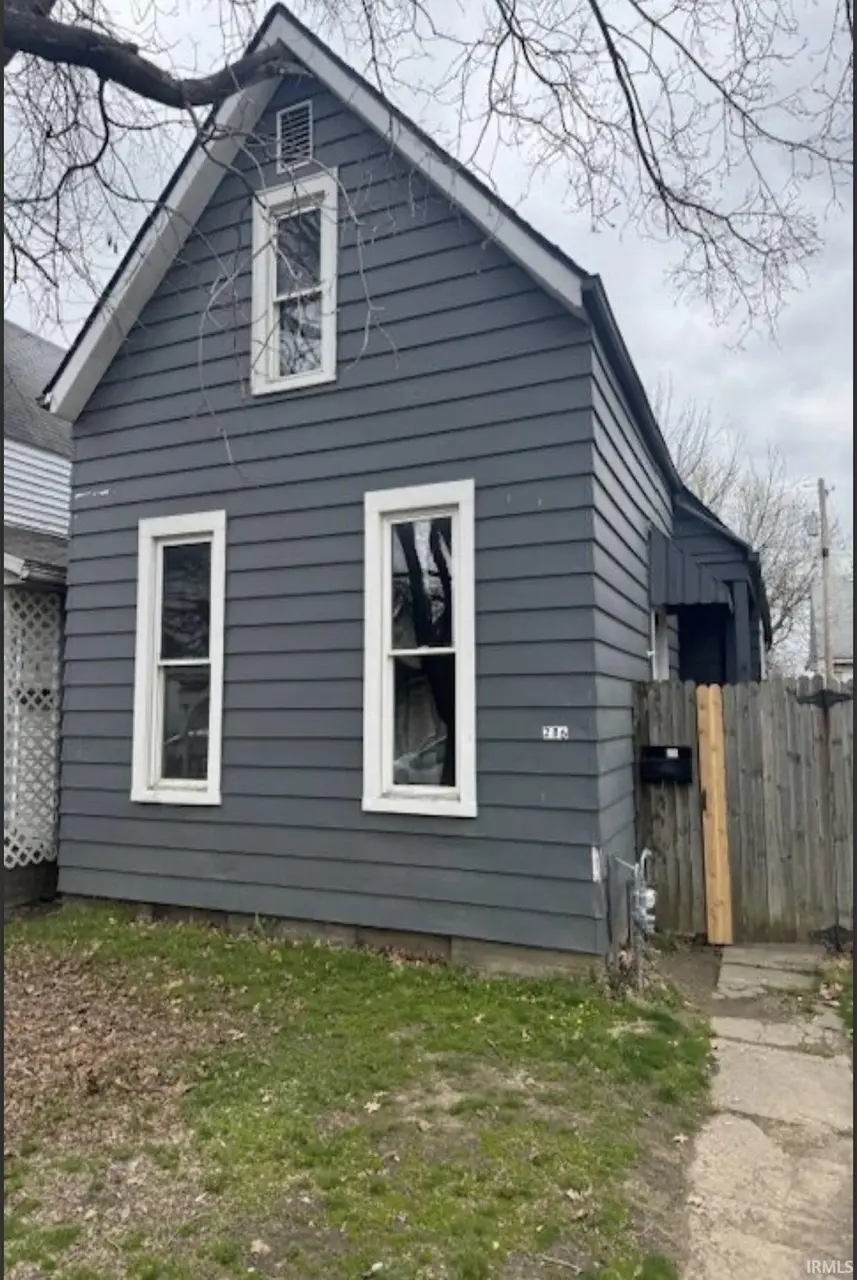
216 E Maryland St · Evansville, IN
Flood risk 1/10 · Minimal
- FEMA flood zone
- X (unshaded)
- Chance of flooding over 30 yrs
- 0.0%
- Est. flood insurance / yr
- $507 – $1,088
Fire risk 1/10 · Minimal
- Est. fire insurance / yr
- $717 – $1,331
Heat risk 5/10 · Moderate
- Hot days now (above 106°F)
- 7 days/yr
- Hot days in 30 yrs
- 19 days/yr
Wind risk 2/10 · Minimal
- Chance of severe wind over 30 yrs
- 4.0%
Air-quality risk 4/10 · Minor
- Unhealthy air days now
- 3 days/yr
- Unhealthy air days in 30 yrs
- 5 days/yr
Risk factors via First Street. Map © Google.
Why this score? — see what drove the B- grade
The composite is a weighted blend of 9 inputs, each scored 0–100. Each bar is that input's sub-score; the figure is the points it added to the 100-point composite (weight × sub-score).
- Cash flow +29.2/30.0
- DSCR +10.0/10.0
- 1% rule +6.9/10.0
- ARV discount +6.5/15.0
- Rent growth +4.2/5.0
- Schools +3.3/10.0
- Livability +3.2/5.0
- Condition / age +2.5/5.0
- Appreciation +0.0/10.0
$89,900
🖨 Deal sheet (PDF) 📄 Offer letter ✓ Due diligence
Listing remarks
This established rental property offers strong cash flow and immediate income potential for investors. Featuring a long-term tenant on a yearly lease, the property currently generates $995 per month in rent, with the tenant responsible for all utilities and lawn care. All appliances are included, making this a low-maintenance investment opportunity.
Key facts
- 3,250 sq ft lot
- Built 1939
- Listed 86 days
Property features AI
Exterior
- Security: Smoke detector(s)
- Utilities: Public water; Public sewer
- Home design: Single-family residence; Site-built home; One story
- Construction: Aluminum siding
- Exterior features: Privacy fencing; Level lot
Interior
- Kitchen: Please see full listing for kitchen appliance details
- Bedrooms: Bedrooms (see full listing for counts and locations)
- Bathrooms: 1 full bathroom (main level)
- Heating & cooling: Central air conditioning; Natural gas forced-air heating
- Interior features: One fireplace; Smoke detector(s); 7 total rooms; Crawl space/partial unfinished basement
- Laundry & utility: Laundry on the main level
Neighborhood map
What this means for you Summary
Snapshot
- This is a 1-bed/1.0-bath single-family listed at $90k.
Deal economics
- At list price, monthly cash flow is $314 ($4k/yr) — positive.
- The deal already cash-flows at list — no discount required.
- Meets the 1% rule at list price ($1k rent vs $90k).
- Recommended offer: $85k (6.0% below list) — sets the bar for market timing.
- Cap rate 10.5% vs local median 4.6% in Evansville — top-decile yield for the area; either an underpriced asset or a hidden risk that comps aren't pricing in. Stress-test before assuming the spread holds.
Location & tenants
- Location reads 63/100 on livability (#416 in IN) — a middle-class / working-renter tenant base. Strengths: cost of living A+, housing A+, health & safety A+; Watch: crime F, commute F, employment D-.
- Evansville Vanderburgh School Corporation (urban): math 36% / reading 43% proficiency, ranked #153 of 301 in IN (top 51%) — families likely to look elsewhere, expect single-tenant / working-renter base with shorter leases.
- Zoned schools: Delaware Elementary School (math 22% / reading 16%, grade F, #829 of 994 statewide, top 84%, 338 students, 90% FRL); North Junior High School (math 44% / reading 57%, grade C, #43 of 330 statewide, top 14%, 929 students, 42% FRL); North High School (math 57% / reading 74%, grade B, #29 of 369 statewide, top 8%, 1,674 students, 35% FRL).
- Market conditions: Rents rising fast (+6.7%/yr); 229 active listings in the ZIP; 8 comparable units currently listed for rent nearby; rentals at typical pace (median 22d on market — plan ~3-4 weeks tenant-placement turnaround); 508 units permitted in Vanderburgh County in 2024 (32 in 5+ unit buildings).
Forward outlook
- Local home prices are declining (-3.0%/yr); year-one equity from $622 of loan paydown is wiped out by about $3k of value loss. Plan a longer hold.
- At projected returns (-3.0% appreciation + 6.7% rent growth), your $25k cash investment doubles in ~7 years — after that, you're playing with house money.
Negotiation context
- It's been on market 86 days — a 6% lower offer ($85k) is reasonable based on typical stale-listing flexibility.
- 7 sale attempts since 9y ago; this cycle's ask has dropped $7k (8%) from the opening price — seller is motivated, your offer sets the floor, not the list.
- Current owner paid $60k; 50% above their basis — modest negotiation headroom, anchor on the comps not their cost.
Risks & watch-outs
- Watch-outs: built in 1939 — expect roof / HVAC / electrical / plumbing capex.
- Climate carrying-cost: extreme-heat days projected 7→19/yr by 2055 (HVAC capex compounding) — expect insurance premiums to compound above CPI over the hold.
Questions for the listing agent
- It's been on market 86 days. Have you received any prior offers? Is the seller open to a 6% concession, seller financing, or rate buy-down credit?
- Built in 1939 — when were the roof, HVAC, electrical panel, plumbing, and water heater last replaced?
- Why hasn't it sold? Are there any deal-killer items the seller is aware of (foundation, flood, title, zoning, code violations)?
- Is there a deadline driving the sale (1031 exchange, divorce, estate, relocation)? That informs how much negotiation room exists.
- Schools are D-rated, which usually means shorter tenancies and higher turnover. Who's the typical renter profile here, and what's been the actual vacancy rate?
- Crime grade is F in this area — have there been break-ins, vandalism, or insurance claims at this property in the last 3 years? What carrier currently insures it and at what premium?
- What's the average days-on-market for RENTAL listings here right now (not sales)? A rising rental-DOM trend means longer vacancies and softer asking-rent achievability than the comps imply.
- What's the recent tenant-quality profile in this submarket — average credit score on applications, eviction rate, late-payment / NSF rate, and stable-employment percentage? A property-management company in the area should have these aggregated.
- How much new for-sale + rental construction is in the pipeline within 1–3 miles? Heavy new supply typically softens prices + rents 12–24 months out; constrained supply supports both.
Investment metrics
- 1% rule
- 1.19% ✓
- Cap rate
- 10.49%
- Cash-on-cash
- 14.99%
- DSCR
- 1.67
- GRM
- 7.0
CMA / ARV
- ARV (on-the-fly)
- $87,874
- Comps found
- 7
Show comp detail 7 sales within ~0.75 mi
| Address | Dist | Beds/Ba | Sqft | Sold | Price | $/sf | Match |
|---|---|---|---|---|---|---|---|
| 107 E Missouri St | 0.13mi | 2/1.0 (+1) | 1,486 (-10%) | 18mo | $30,000 | $20 | 56 |
| 20 W Eichel Ave | 0.43mi | 2/2.0 (+1) | 1,552 (-6%) | 6mo | $134,000 | $86 | 55 |
| 401 E Iowa St | 0.24mi | 2/1.0 (+1) | 1,868 (+13%) | 17mo | $98,500 | $53 | 49 |
| 1112 1114 Read St | 0.45mi | 2/2.0 (+1) | 1,456 (-12%) | 2mo | $17,500 | $12 | 48 |
| 620 Maxwell Ave | 0.63mi | 2/1.0 (+1) | 1,488 (-10%) | 4mo | $139,900 | $94 | 45 |
| 328 Keck Ave | 0.70mi | 2/1.5 (+1) | 1,442 (-13%) | 4mo | $157,500 | $109 | 35 |
| 613 Keck Ave | 0.74mi | 2/2.0 (+1) | 1,818 (+10%) | 14mo | $60,400 | $33 | 29 |
Match score weights: distance 35% · size 25% · config 20% · recency 20%. Top-matched comps best support the ARV.
Projected returns pro-forma
-3.0% appreciation · 6.72% rent growth · sell at horizon
- IRR
- 9.3%
- Equity multiple
- 1.38×
- Total profit
- $9,569
- Equity at exit
- $13,404
- IRR
- 21.1%
- Equity multiple
- 3.08×
- Total profit
- $52,349
- Equity at exit
- $7,773
Cash invested: $25,172 (down + closing). Projections, not guarantees.
Landlord ↔ Tenant lean methodology
- Overall (STATE)
- 90 Strongly Landlord-Friendly
- State Indiana
- 90 Strongly Landlord-Friendly · R+11
- County
- — inherits STATE
- City
- — inherits STATE
ZIP-level market 47711
- Home prices YoY
- -32.3%
- Rents YoY
- 6.7%
- Active inventory
- 229
- Price-to-rent
- 7.0×
Monthly cashflow live
- Estimated rent
- $1,069 high interval (Pro) →
- Mortgage (P&I)
- −$471
- Tax from tax record
- −$21 /mo · $256/yr
- Insurance
- −$37
- HOA
- −$0
- Vacancy / Maint / Mgmt
- −$225
- Net cashflow
- $314
Break-even live
Sensitivity live
| Price | -10% $365 | -5% $340 | +0% $314 | +5% $289 | +10% $264 |
|---|---|---|---|---|---|
| Rent | -10% $230 | -5% $272 | +0% $314 | +5% $357 | +10% $399 |
| Rate | -1.0pp $360 | -0.5pp $337 | base $314 | +0.5pp $291 | +1.0pp $267 |
UW: 25.0% down · 7.5% · 30yr · 1.5% tax · 5.0% vac · 8.0% maint · 8.0% mgmt
Financing live
Cash to close
- Down payment
- $22,475
- Closing costs
- $2,697
- Reserves months
- —
- Total cash needed
- —
Loan-product check · same deal, 3 products live
Conventional
25% down · 7.5% · 30yr
- Down + closing
- —
- Monthly P&I
- —
- Monthly cashflow
- —
- DSCR
- —
- Eligible?
- —
Personal DTI + credit; lowest rate.
DSCR
20% down · 8.5% · 30yr
- Down + closing
- —
- Monthly P&I
- —
- Monthly cashflow
- —
- DSCR
- —
- Eligible?
- —
No personal income docs; deal must DSCR.
Hard money
10% down · 12.0% · 12mo
- Down + closing
- —
- Monthly P&I
- —
- Monthly cashflow
- —
- DSCR
- —
- Eligible?
- —
Short-term bridge; refi at stabilization.
Rent comps 8 comps
| Address | Beds | Baths | Sqft | Rent | $/sqft | DOM | Units | Dist |
|---|---|---|---|---|---|---|---|---|
| 200 N Main St Evansville, IN | 2.0 | 1.0–2.0 | 857 | $1,287 | $1.50 | 14d | 7 | 0.49mi |
| 41 W Division St Apt 200 Evansville, IN | 2.0 | 2.0 | 1083 | $1,500 | $1.39 | 22d | 1 | 0.65mi |
| 706 Court St Evansville, IN | 2.0 | 1.5 | 1100 | $850 | $0.77 | 22d | 1 | 0.87mi |
| 313 NW Martin Luther King Junior Blvd Unit 311 Evansville, IN | 2.0 | 1.0 | 1200 | $950 | $0.79 | 22d | 1 | 0.87mi |
| 202 SE 1st St Evansville, IN | 1.0–2.0 | 1.0 | 926 | $1,439 | $1.55 | 22d | 4 | 1.40mi |
| 322 SE 1st St Evansville, IN | 1.0–2.0 | 1.0 | 1100 | $1,200 | $1.09 | 22d | 6 | 1.47mi |
| 315 SE 1st St Evansville, IN | 1.0 | 1.0 | 1331 | $1,695 | $1.27 | 22d | 1 | 1.47mi |
| 615 SE 3rd St Unit D Evansville, IN | 1.0 | 1.0 | 1122 | $895 | $0.80 | 22d | 1 | 1.48mi |
Listing history 26 events
-
2026-06-18days on market $89,900 Active 86 DOM
-
2026-06-17remarks 351-char remark
-
2026-06-17price $89,900 Active 85 DOM
-
2026-06-17days on market $95,500 Active 85 DOM
-
2026-06-16days on market $95,500 Active 84 DOM
-
2026-06-15days on market $95,500 Active 83 DOM
-
2026-06-14days on market $95,500 Active 81 DOM
-
2026-06-13days on market $95,500 Active 80 DOM
-
2026-06-10days on market $95,500 Active 78 DOM
-
2026-06-09days on market $95,500 Active 77 DOM
-
2026-06-08days on market $95,500 Active 76 DOM
-
2026-06-07days on market $95,500 Active 75 DOM
-
2026-06-02days on market $95,500 Active 70 DOM
-
2026-06-01days on market $95,500 Active 69 DOM
-
2026-05-31days on market $95,500 Active 68 DOM
-
2026-05-30days on market $95,500 Active 67 DOM
-
2026-05-01price $95,500
-
2026-03-24$97,250 Active
-
2026-03-24$97,250 Active
-
2024-04-07historical $975
-
2024-03-20$975
-
2021-10-05soldstatus $60,000
-
2021-08-07$65,000
-
2018-11-19$50,000
-
2018-01-12$50,000
-
2017-10-05$48,000
ⓘ Source: listings_history table (triggers on properties + properties_extension) + one-shot
backfill from property_details.listing_events for pre-trigger history.
Tax reassessment forecast IN · Partial reset (capped growth)
- Current annual tax
- $256 · $21/mo
- Projected year-2 tax
- $510 · $42/mo
- Expected delta
- +$254/yr (+$21/mo · 99.5%)
ⓘ Screening estimate from a state-policy table — verify with the county assessor before closing.
Climate risk First Street
- Flood 1/10 Low FEMA zone X (unshaded) · 0% chance over 30 yrs
- Wildfire 1/10 Low
- Heat 5/10 Major 7 d/yr ≥106°F today · 19 d/yr by 30 yrs out
- Wind 2/10 Low 4% chance of damaging wind over 30 yrs
- Air quality 4/10 Moderate 3 unhealthy d/yr today · 5 by 30 yrs out
Nearby sold comps map
Loading sold comps map…
Walkable amenities ~0.75 mi
Loading nearby amenities…
Taxation est. · year 1
- Rental income
- $12,830
- − Mortgage interest
- −$5,036
- − Property taxes
- −$256
- − Insurance
- −$450
- − Repairs & maintenance
- −$1,026
- − Management
- −$1,026
- − Depreciation
- −$2,615
- Taxable income
- $2,421
- Est. tax owed @ 24.0%
- −$581
- After-tax cash flow
- $3,192/yr
For passive investors: Depreciation is non-cash, so a rental often shows a tax loss while cash-flowing — sheltering income. Rental losses are passive: they offset passive income freely, and up to $25,000/yr can offset ordinary (W-2) income if you actively participate and your MAGI is under $100k (phasing out to $0 by $150k); unused losses carry forward. On sale, claimed depreciation is recaptured at up to 25%, and gains may owe capital-gains tax (a 1031 exchange can defer both). Figures are a year-1 estimate at your 24.0% rate — not tax advice; consult a CPA.
Schools (NCES district)
- District
- Evansville Vanderburgh School Corporation
- NCES district ID
- 1803450
- Math proficiency
- 36% ▼ -7.00%
- Reading proficiency
- 43% ▼ -3.00%
- Median HH income
- $43,270
- Composite
- 33.41/100
- National rank
- #5471
- State rank
- #153 of 301 in IN
Livability — Evansville
- Score
- 63/100
- State rank
- #416
- US rank
- #15047
Category grades
Schools grade is shown separately in the Schools card above.
Census & demographics
- Census place
- Evansville, IN
- County
- Vanderburgh County · 146,793 people
- City population
- 146,793
- Metro
- Evansville, IN-KY
- Population (ZIP)
- 30,944
- Household income
- $66,320
- Rent vs Own
- Severe rent burden
- 659.0
Population outlook (Vanderburgh County) Hauer SSP2
- Today (2025)
- 187,038 people
- By 2030
- 188,907 · +1.0%
- By 2040
- 190,272 · +1.7%
- By 2050
- 188,871 · +1.0%
- By 2075
- 180,751 · -3.4%
- By 2100
- 163,015 · -12.8%
Race, ethnicity, and origin ACS 2023
- Neighborhood character
- Predominantly White (85%)
- Race & ethnicity
- White 85% Black 8% Two or more races 5% Hispanic / Latino 2%
- Common ancestry
- Lithuanian 2% Romanian 2% Slovak 1%
- Foreign-born
- 2% · Canada
- Languages at home
- 97% English-only · Spanish 2%
Political lean MEDSL · Vanderburgh
- 2024 margin
- R (+12.7) · D 43.0% · R 55.6% · Other 1.4%
- 2008→2024 swing
- -15.1pp toward R · 2008: 2.5pp · 2024: -12.7pp
- All cycles
- 2024: R+12.7 2020: R+9.6 2016: R+16.9 2012: R+10.8 2008: D+2.5
Not yet ingested
- Civics
- —
Market trends
- HPI YoY
- ▼ -97.98%
- Current HPI
- 205.62
- Rent YoY
- ▲ 6.72%
- Metro
- Evansville, IN-KY
- State GDP YoY
- ▲ 2.90%
- F500 in state
- 18
Industry mix (Fortune 500 HQ in IN)
| Industry | F500 HQs | Revenue |
|---|---|---|
| Industrial Machinery | 2 | $37B |
|
||
| Healthcare | 1 | $177B |
|
||
| Pharmaceuticals | 1 | $45B |
|
||
| Metals / Steel | 1 | $18B |
|
||
| Agriculture | 1 | $17B |
|
||
| Packaging | 1 | $12B |
|
||
Price history
+99.0% since first listed10 events — show timeline
- 2026-05-01 Price Changed $95,500 IRMLS
- 2026-03-24 Listed $97,250 IRMLS
- 2026-03-24 Listed $97,250 IRMLS
- 2024-04-07 Rental Removed $975 APPFOLIO
- 2024-03-20 Listed for Rent $975 APPFOLIO
- 2021-10-05 Sold (MLS) $60,000 IRMLS
- 2021-08-07 Listed $65,000 IRMLS
- 2018-11-19 Listed $50,000 IRMLS
- 2018-01-12 Listed $50,000 IRMLS
- 2017-10-05 Listed $48,000 IRMLS
Property tax history
-8.1%/yrLatest (2024): $256 · +5.1% YoY. Source: county tax records.
Cash-flow waterfall
monthlySold comps — $/sqft
last 12 mo · ≤1 miLoading sold comps…