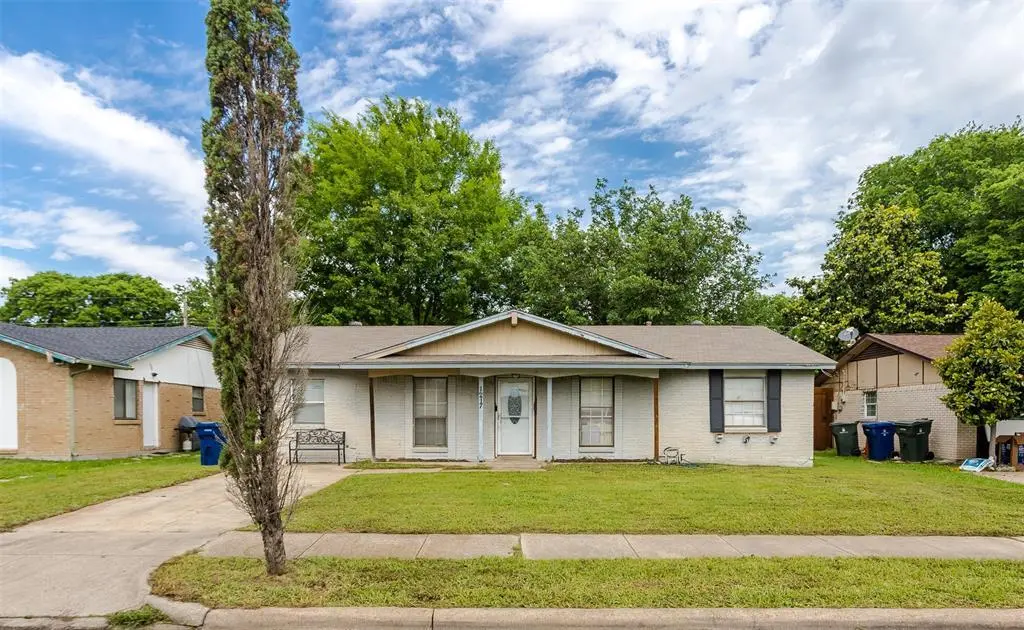
1217 Greencove Dr · Garland, TX
Flood risk 1/10 · Minimal
- FEMA flood zone
- X (unshaded)
- Chance of flooding over 30 yrs
- 0.0%
- Est. flood insurance / yr
- $507 – $1,088
Fire risk 1/10 · Minimal
- Est. fire insurance / yr
- $1,222 – $2,270
Heat risk 7/10 · Major
- Hot days now (above 109°F)
- 7 days/yr
- Hot days in 30 yrs
- 23 days/yr
Wind risk 6/10 · Moderate
- Chance of severe wind over 30 yrs
- 27.0%
Air-quality risk 2/10 · Minimal
- Unhealthy air days now
- 2 days/yr
- Unhealthy air days in 30 yrs
- 2 days/yr
Risk factors via First Street. Map © Google.
Why this score? — see what drove the D+ grade
The composite is a weighted blend of 9 inputs, each scored 0–100. Each bar is that input's sub-score; the figure is the points it added to the 100-point composite (weight × sub-score).
- ARV discount +15.0/15.0
- Cash flow +10.9/30.0
- 1% rule +5.4/10.0
- Livability +3.7/5.0
- DSCR +3.2/10.0
- Schools +2.9/10.0
- Rent growth +2.6/5.0
- Condition / age +2.5/5.0
- Appreciation +0.0/10.0
$185,000
🖨 Deal sheet 📄 Offer letter ✓ Due diligence
Listing remarks
INVESTOR SPECIAL! This fixer upper is a great opportunity for both investors & first-time home buyers. This charming single story home is located in a quiet, established Garland neighborhood with a strong rental demand & offers 3 bedrooms, 1.5 bathrooms & multiple living & dining areas on a generously sized lot. Enjoy meals in the formal dining room or sunny eat-in kitchen area, each designed for everyday living. The functional kitchen features granite counters, ss appliances, ample counter space & plenty of cabinetry with separate pantry. The main living room is equipped with a sliding glass door with outdoor access & views to the backyard. The garage co
Key facts
- Ample counter space
- Formal dining room
- Sunny eat-in kitchen
Tags
Property features AI
Finance
- Other: Possession negotiable; Restrictions: deed and other
- Financial info: Listing terms include Cash, FHA-203K and Other; No second mortgage indicated
- HOA & community: No association
Exterior
- Parking: Driveway (no garage, carport, or covered spaces listed)
- Security: Smoke detector(s)
- Utilities: City water; City sewer; Individual water meter; Cable available; Concrete curbs and sidewalks; Alley access; Other utilities available
- Home design: Single family residence; One story; Residential property; Not attached; Year built 1968; Preowned
- Construction: Brick and siding construction; Composition roof; Slab foundation
- Exterior features: Covered porch(es); Covered patio/porch; Chain link fencing; Shed(s); Few trees; Large backyard with grass; Interior lot; Easements for utilities and other
Interior
- Kitchen: Dishwasher; Electric range; Microwave; Ice maker; Built-in cabinets; Granite countertops; Eat-in kitchen / breakfast area; Pantry
- Bedrooms: 3 bedrooms (all on one level); Primary bedroom with ensuite bath and walk-in closet
- Flooring: Brick; Carpet; Ceramic tile; Concrete; Laminate
- Bathrooms: 1 full bathroom; 1 half bathroom
- Heating & cooling: Central heating; Central air; Ceiling fan(s)
- Interior features: Eat-in kitchen; Granite counters; Pantry; Paneling; Cable TV available; High speed internet available; Window coverings
- Laundry & utility: Full-size washer/dryer area; Washer hookup; Electric dryer hookup; Electric water heater
Neighborhood map
What this means for you Summary
Snapshot
- This is a 2-bed/1.5-bath single-family listed at $185k.
Deal economics
- At list price, monthly cash flow is $-82 ($-988/yr) — negative.
- To cash-flow at today's rent, offer at most $170k (7.9% below list).
- Meets the 1% rule at list price ($2k rent vs $185k).
- Recommended offer: $170k (7.9% below list) — sets the bar for cash-flow.
- Cap rate 5.8% vs local median 3.5% in Garland — top-decile yield for the area; either an underpriced asset or a hidden risk that comps aren't pricing in. Stress-test before assuming the spread holds.
Location & tenants
- Location reads 74/100 on livability (#165 in TX, #4,447 nationally) — a middle-class / working-renter tenant base. Strengths: commute A+, housing A+, cost of living A-; Watch: amenities C-, schools D+, health & safety F.
- Garland ISD (suburban): math 27% / reading 37% proficiency, ranked #553 of 826 in TX (top 67%) — families likely to look elsewhere, expect single-tenant / working-renter base with shorter leases.
- Market conditions: Rents flat; 230 active listings in the ZIP; 40 comparable units currently listed for rent nearby; rentals at typical pace (median 19d on market — plan ~3-4 weeks tenant-placement turnaround); 12,577 units permitted in Dallas County in 2024 (6,829 in 5+ unit buildings).
- This rent runs 31% of the median local income ($75k/yr) — at the standard rent-burdened threshold; future hikes will face affordability resistance.
Forward outlook
- Local home prices are declining (-3.0%/yr); year-one equity from $1k of loan paydown is wiped out by about $6k of value loss. Plan a longer hold.
- Dallas County population projected at +35% by 2050 — long-run rental-demand tailwind backs the buy-and-hold thesis.
Negotiation context
- It's been on market 46 days — a 3% lower offer ($179k) is reasonable based on typical stale-listing flexibility.
- 2 sale attempts since 22y ago; this cycle's ask has dropped $40k (18%) from the opening price — seller is motivated, your offer sets the floor, not the list.
Risks & watch-outs
- Watch-outs: property tax is 3.6% of price.
- Climate carrying-cost: major wind risk, 27% chance of damaging wind over 30y; extreme-heat days projected 7→23/yr by 2055 (HVAC capex compounding) — expect insurance premiums to compound above CPI over the hold.
Questions for the listing agent
- What do current leases actually rent for vs. the listed asking? Can we see a recent rent roll and the last 12 months of T-12 income?
- It's been on market 46 days. Have you received any prior offers? Is the seller open to a 8% concession, seller financing, or rate buy-down credit?
- Built in 1968 — when were the roof, HVAC, electrical panel, plumbing, and water heater last replaced?
- Property tax is high relative to price — has the assessment been appealed recently, and will the sale trigger a re-assessment?
- Is there a deadline driving the sale (1031 exchange, divorce, estate, relocation)? That informs how much negotiation room exists.
- Schools are D-rated, which usually means shorter tenancies and higher turnover. Who's the typical renter profile here, and what's been the actual vacancy rate?
- The area grade is low — what's the realistic commute time and amenity access for the typical tenant pool here? Any planned neighborhood developments (good or bad) we should know about?
- What's the average days-on-market for RENTAL listings here right now (not sales)? A rising rental-DOM trend means longer vacancies and softer asking-rent achievability than the comps imply.
- What's the recent tenant-quality profile in this submarket — average credit score on applications, eviction rate, late-payment / NSF rate, and stable-employment percentage? A property-management company in the area should have these aggregated.
- How much new for-sale + rental construction is in the pipeline within 1–3 miles? Heavy new supply typically softens prices + rents 12–24 months out; constrained supply supports both.
Investment metrics
- 1% rule
- 1.04% ✓
- Cap rate
- 5.76%
- Cash-on-cash
- -1.91%
- DSCR
- 0.92
- GRM
- 8.0
CMA / ARV
- ARV (median comp)
- $233,128
- List price
- $185,000
- Delta
- -20.64%
- Verdict
- UNDERPRICED
- Comps
- 20 within 1.0 mi
Show comp detail 12 sales within ~0.75 mi
| Address | Dist | Beds/Ba | Sqft | Sold | Price | $/sf | Match |
|---|---|---|---|---|---|---|---|
| 1412 Morrison Pl | 0.21mi | 3/1.5 (+1) | 1,296 (-9%) | 2mo | $224,999 | $174 | 68 |
| 918 Greencove Dr | 0.24mi | 3/2.0 (+1) | 1,551 (+8%) | 3mo | $265,000 | $171 | 66 |
| 501 Bay Shore Dr | 0.56mi | 3/2.0 (+1) | 1,441 (+1%) | 2mo | $190,000 | $132 | 64 |
| 1506 Whiteoak Dr | 0.67mi | 3/2.0 (+1) | 1,435 (+0%) | 2mo | $264,900 | $185 | 60 |
| 1425 Whitney Dr | 0.63mi | 3/2.0 (+1) | 1,471 (+3%) | 4mo | $294,900 | $200 | 56 |
| 1453 Shorecrest Dr | 0.27mi | 3/2.0 (+1) | 1,228 (-14%) | 3mo | $195,000 | $159 | 55 |
| 1426 Whiteoak Dr | 0.65mi | 3/2.0 (+1) | 1,384 (-3%) | 3mo | $262,000 | $189 | 55 |
| 1813 Castle Dr | 0.54mi | 3/2.0 (+1) | 1,310 (-8%) | 3mo | $270,000 | $206 | 52 |
| 909 Lister Dr | 0.55mi | 3/1.0 (+1) | 1,278 (-11%) | 2mo | $239,990 | $188 | 48 |
| 322 Davidson Dr | 0.47mi | 3/1.0 (+1) | 1,239 (-13%) | 2mo | $149,000 | $120 | 47 |
| 914 Toyah Creek Ln | 0.64mi | 3/2.0 (+1) | 1,248 (-13%) | 1mo | $275,000 | $220 | 41 |
| 1409 Meridian Way | 0.73mi | 3/2.0 (+1) | 1,253 (-12%) | 4mo | $240,000 | $192 | 35 |
Match score weights: distance 35% · size 25% · config 20% · recency 20%. Top-matched comps best support the ARV.
Projected returns pro-forma
-3.0% appreciation · 0.43% rent growth · sell at horizon
- IRR
- -23.0%
- Equity multiple
- 0.23×
- Total profit
- $-39,838
- Equity at exit
- $27,584
- IRR
- -29.2%
- Equity multiple
- -0.15×
- Total profit
- $-59,404
- Equity at exit
- $15,995
Cash invested: $51,800 (down + closing). Projections, not guarantees.
Landlord ↔ Tenant lean methodology
- Overall (STATE)
- 87 Strongly Landlord-Friendly
- State Texas
- 87 Strongly Landlord-Friendly · R+5
- County
- — inherits STATE
- City
- — inherits STATE
ZIP-level market 75040
- Rents YoY
- 0.4%
- Active inventory
- 230
- Price-to-rent
- 8.0×
Monthly cashflow live
- Estimated rent
- $1,922 high interval (Pro) →
- Mortgage (P&I)
- −$970
- Tax from tax record
- −$553 /mo · $6,641/yr
- Insurance
- −$77
- HOA
- −$0
- Vacancy / Maint / Mgmt
- −$404
- Net cashflow
- $-82
Break-even live
UW: 25.0% down · 7.5% · 30yr · 1.5% tax · 5.0% vac · 8.0% maint · 8.0% mgmt
Financing live
Cash to close
- Down payment
- $46,250
- Closing costs
- $5,550
- Reserves months
- —
- Total cash needed
- —
Loan-product check · same deal, 3 products live
Conventional
25% down · 7.5% · 30yr
- Down + closing
- —
- Monthly P&I
- —
- Monthly cashflow
- —
- DSCR
- —
- Eligible?
- —
Personal DTI + credit; lowest rate.
DSCR
20% down · 8.5% · 30yr
- Down + closing
- —
- Monthly P&I
- —
- Monthly cashflow
- —
- DSCR
- —
- Eligible?
- —
No personal income docs; deal must DSCR.
Hard money
10% down · 12.0% · 12mo
- Down + closing
- —
- Monthly P&I
- —
- Monthly cashflow
- —
- DSCR
- —
- Eligible?
- —
Short-term bridge; refi at stabilization.
Rent comps 40 comps
| Address | Beds | Baths | Sqft | Rent | $/sqft | DOM | Units | Dist |
|---|---|---|---|---|---|---|---|---|
| 617 Rosewood Hills Dr Garland, TX | 3.0 | 2.0 | 1272 | $1,800 | $1.42 | 24d | 1 | 0.48mi |
| 1009 Foxe Basin Dr Garland, TX | 3.0 | 1.5 | 1019 | $1,850 | $1.82 | 2d | 1 | 0.49mi |
| 1406 Yukon Dr Garland, TX | 2.0 | 1.5 | 950 | $1,395 | $1.47 | 43d | 1 | 0.53mi |
| 501 Rosewood Hills Dr Garland, TX | 3.0 | 1.5 | 1304 | $1,850 | $1.42 | 19d | 1 | 0.57mi |
| 820 Courtenay Pl Garland, TX | 3.0 | 2.0 | 1224 | $1,845 | $1.51 | 43d | 1 | 0.58mi |
| 822 Courtenay Pl Garland, TX | 2.0 | 2.0 | 1296 | $1,845 | $1.42 | 22d | 1 | 0.58mi |
| 1506 Whiteoak Dr Garland, TX | 3.0 | 2.0 | 1435 | $2,000 | $1.39 | 17d | 1 | 0.65mi |
| 1506 Whiteoak Dr Garland, TX | 3.0 | 2.0 | 1435 | $2,000 | $1.39 | 17d | 1 | 0.65mi |
| 1617 Meridian Way Garland, TX | 3.0 | 2.0 | 1476 | $1,900 | $1.29 | 24d | 1 | 0.71mi |
| 822 Milky Way Garland, TX | 3.0 | 2.0 | 1141 | $2,100 | $1.84 | 7d | 1 | 0.73mi |
| 1130 Richard Dr Garland, TX | 3.0 | 1.0 | 891 | $2,000 | $2.24 | 43d | 1 | 0.75mi |
| 1024 Sunset Dr Garland, TX | 3.0 | 2.0 | 1512 | $2,000 | $1.32 | 14d | 1 | 0.81mi |
| 1841 Sage Dr Garland, TX | 3.0 | 2.0 | 1356 | $1,995 | $1.47 | 14d | 1 | 0.84mi |
| 502 Moonlight Dr Garland, TX | 3.0 | 2.0 | 1496 | $1,900 | $1.27 | 12d | 1 | 0.86mi |
| 1834 Sage Dr Garland, TX | 3.0 | 2.0 | 1422 | $2,100 | $1.48 | 7d | 1 | 0.87mi |
| 618 Pleasant Valley Rd Garland, TX | 3.0 | 2.0 | 1003 | $2,095 | $2.09 | 43d | 1 | 0.88mi |
| 1630 Dell Oak Dr Garland, TX | 3.0 | 2.0 | 1268 | $2,100 | $1.66 | 7d | 1 | 0.93mi |
| 510 Sunset Dr Garland, TX | 3.0 | 2.0 | 1265 | $1,800 | $1.42 | 4d | 1 | 0.97mi |
| 613 Dawn Dr Garland, TX | 3.0 | 2.0 | 1026 | $2,200 | $2.14 | 4d | 1 | 1.01mi |
| 1101 Tensley Dr Garland, TX | 3.0 | 1.5 | 950 | $1,600 | $1.68 | 43d | 1 | 1.03mi |
| 1206 Misty Way Garland, TX | 3.0 | 2.0 | 1568 | $2,075 | $1.32 | 24d | 1 | 1.05mi |
| 1505 Bergen Dr Garland, TX | 3.0 | 2.0 | 1702 | $2,000 | $1.18 | 24d | 1 | 1.11mi |
| 1446 Cross Courts Dr Garland, TX | 3.0 | 2.0 | 1302 | $1,950 | $1.50 | 7d | 1 | 1.11mi |
| 1429 Eastview Dr Garland, TX | 3.0 | 2.0 | 1529 | $2,145 | $1.40 | 22d | 1 | 1.12mi |
| 1429 Eastview Dr Garland, TX | 3.0 | 2.0 | 1529 | $2,145 | $1.40 | 20d | 1 | 1.12mi |
| 917 Piedmont Dr Garland, TX | 3.0 | 1.5 | 1053 | $1,500 | $1.42 | 7d | 1 | 1.14mi |
| 1446 Cross Courts Dr Garland, TX | 3.0 | 2.0 | 1302 | $1,961 | $1.51 | 43d | 1 | 1.15mi |
| 614 Melissa Ln Garland, TX | 3.0 | 2.0 | 1837 | $2,230 | $1.21 | 6d | 1 | 1.22mi |
| 2309 Shalimar Dr Garland, TX | 3.0 | 2.0 | 1592 | $2,000 | $1.26 | 7d | 1 | 1.27mi |
| 1301 Quail Dr Garland, TX | 3.0 | 2.0 | 1428 | $2,000 | $1.40 | 43d | 1 | 1.28mi |
| 1509 Quail Dr Garland, TX | 3.0 | 1.5 | 1176 | $1,795 | $1.53 | 22d | 1 | 1.37mi |
| 1413 Eagle Pass Dr Garland, TX | 3.0 | 3.0 | 1280 | $1,835 | $1.43 | 15d | 1 | 1.40mi |
| 1413 Eagle Pass Dr Garland, TX | 3.0 | 3.0 | 1280 | $1,835 | $1.43 | 43d | 1 | 1.40mi |
| 1405 Meandering Way Garland, TX | 3.0 | 2.0 | 1446 | $2,100 | $1.45 | 7d | 1 | 1.40mi |
| 1809 Pecan View Dr Garland, TX | 3.0 | 2.0 | 1647 | $2,141 | $1.30 | 43d | 1 | 1.41mi |
| 2606 Shalimar Dr Garland, TX | 3.0 | 2.0 | 1242 | $1,850 | $1.49 | 15d | 1 | 1.43mi |
| 1002 Westminster Ln Garland, TX | 3.0 | 2.0 | 1626 | $2,075 | $1.28 | 17d | 1 | 1.45mi |
| 1902 High Meadow Dr Garland, TX | 3.0 | 2.0 | 1452 | $2,750 | $1.89 | 43d | 1 | 1.46mi |
| 219 Loma Dr Garland, TX | 3.0 | 1.5 | 884 | $1,699 | $1.92 | 43d | 1 | 1.47mi |
| 2013 Victoria Dr Garland, TX | 3.0 | 2.0 | 1159 | $1,900 | $1.64 | 4d | 1 | 1.49mi |
Listing history 19 events
-
2026-06-18days on market $185,000 Active 46 DOM
-
2026-06-17days on market $185,000 Active 45 DOM
-
2026-06-16days on market $185,000 Active 44 DOM
-
2026-06-15days on market $185,000 Active 43 DOM
-
2026-06-13days on market $185,000 Active 41 DOM
-
2026-06-09days on market $185,000 Active 37 DOM
-
2026-06-08pricedays on market $185,000 Active 36 DOM
-
2026-06-07days on market $200,000 Active 35 DOM
-
2026-06-04days on market $200,000 Active 32 DOM
-
2026-06-03days on market $200,000 Active 31 DOM
-
2026-06-02days on market $200,000 Active 30 DOM
-
2026-06-01days on market $200,000 Active 29 DOM
-
2026-05-31days on market $200,000 Active 28 DOM
-
2026-05-14price $200,000 1640-char remark
-
2026-05-03$225,000 Active 1640-char remark
-
2004-05-19soldstatus
-
2004-04-04historical
-
2004-02-07$84,500
-
1981-11-01soldstatus
ⓘ Source: listings_history table (triggers on properties + properties_extension) + one-shot
backfill from property_details.listing_events for pre-trigger history.
Tax reassessment forecast TX · Resets to sale price
- Current annual tax
- $6,641 · $553/mo
- Projected year-2 tax
- $6,641 · $553/mo
- Expected delta
- $0/yr ($0/mo · 0.0%)
ⓘ Screening estimate from a state-policy table — verify with the county assessor before closing.
Climate risk First Street
- Flood 1/10 Low FEMA zone X (unshaded) · 0% chance over 30 yrs
- Wildfire 1/10 Low
- Heat 7/10 Severe 7 d/yr ≥109°F today · 23 d/yr by 30 yrs out
- Wind 6/10 Major 27% chance of damaging wind over 30 yrs
- Air quality 2/10 Low 2 unhealthy d/yr today · 2 by 30 yrs out
Nearby sold comps map
Loading sold comps map…
Walkable amenities ~0.75 mi
Loading nearby amenities…
Taxation est. · year 1
- Rental income
- $23,064
- − Mortgage interest
- −$10,363
- − Property taxes
- −$6,641
- − Insurance
- −$925
- − Repairs & maintenance
- −$1,845
- − Management
- −$1,845
- − Depreciation
- −$5,382
- Taxable loss
- −$3,937
- Est. tax savings @ 24.0%
- +$945
- After-tax cash flow
- $-43/yr
For passive investors: Depreciation is non-cash, so a rental often shows a tax loss while cash-flowing — sheltering income. Rental losses are passive: they offset passive income freely, and up to $25,000/yr can offset ordinary (W-2) income if you actively participate and your MAGI is under $100k (phasing out to $0 by $150k); unused losses carry forward. On sale, claimed depreciation is recaptured at up to 25%, and gains may owe capital-gains tax (a 1031 exchange can defer both). Figures are a year-1 estimate at your 24.0% rate — not tax advice; consult a CPA.
Schools (NCES district)
- District
- Garland ISD
- NCES district ID
- 4820340
- Math proficiency
- 27% ▼ -23.00%
- Reading proficiency
- 37% ▼ -10.00%
- Median HH income
- $58,392
- Composite
- 28.63/100
- National rank
- #6706
- State rank
- #553 of 826 in TX
Livability — Garland
- Score
- 74/100
- State rank
- #165
- US rank
- #4447
Category grades
Schools grade is shown separately in the Schools card above.
Census & demographics
- Census place
- Garland, TX
- County
- Dallas County · 2,612,404 people
- City population
- 246,342
- Metro
- Dallas-Fort Worth-Arlington, TX
- Population (ZIP)
- 64,606
- Household income
- $74,519
- Rent vs Own
- Severe rent burden
- 1746.0
Population outlook (Dallas County) Hauer SSP2
- Today (2025)
- 2,979,839 people
- By 2030
- 3,191,823 · +7.1%
- By 2040
- 3,619,611 · +21.5%
- By 2050
- 4,026,915 · +35.1%
- By 2075
- 4,957,073 · +66.4%
- By 2100
- 5,508,725 · +84.9%
Race, ethnicity, and origin ACS 2023
- Neighborhood character
- Diverse neighborhood (Simpson 0.69)
- Race & ethnicity
- Hispanic / Latino 48% Two or more races 29% White 21% Black 15% Asian 11%
- Hispanic origin (detail)
- Mexican 38% Puerto Rican 1%
- Common ancestry
- Lithuanian 1% Romanian 1%
- Foreign-born
- 33% · Canada, Vietnam, China
- Languages at home
- 45% English-only · Spanish 40% Vietnamese 7% Other Indo-European 1%
Political lean MEDSL · Dallas
- 2024 margin
- Strong D (+22.2) · D 60.2% · R 38.0% · Other 1.8%
- 2008→2024 swing
- +6.9pp toward D · 2008: 15.3pp · 2024: 22.2pp
- All cycles
- 2024: D+22.2 2020: D+31.6 2016: D+26.2 2012: D+15.4 2008: D+15.3
Not yet ingested
- Civics
- —
Market trends
- HPI YoY
- ▼ -203.91%
- Current HPI
- 325.6966
- Rent YoY
- ▲ 0.43%
- Metro
- Dallas-Fort Worth-Arlington, TX
- State GDP YoY
- ▲ 3.95%
- F500 in state
- 110
Industry mix (Fortune 500 HQ in TX)
| Industry | F500 HQs | Revenue |
|---|---|---|
| Energy | 16 | $1,198B |
|
||
| Technology | 5 | $198B |
|
||
| Engineering / Construction | 4 | $72B |
|
||
| Energy Services | 3 | $60B |
|
||
| Utilities | 3 | $41B |
|
||
| Healthcare | 2 | $330B |
|
||
Price history
+118.9% since first listed7 events — show timeline
- 2026-06-08 Price Changed $185,000 NTREIS
- 2026-05-14 Price Changed $200,000 NTREIS
- 2026-05-03 Listed $225,000 NTREIS
- 2004-05-19 Sold (Public Records) — Public Records
- 2004-04-04 Listing Removed — NTREIS
- 2004-02-07 Listed $84,500 NTREIS
- 1981-11-01 Sold (Public Records) — Public Records
Property tax history
+8.3%/yrLatest (2025): $6,641 · +5.3% YoY. Source: county tax records.
Cash-flow waterfall
monthlySold comps — $/sqft
last 12 mo · ≤1 miLoading sold comps…